
Analysis of Time – Frequency EEG Feature Extraction Methods for Mental Task Classification
- DOI
- 10.2991/ijcis.10.1.87How to use a DOI?
- Keywords
- Feature extraction; time-frequency EEG analysis; task classification; artificial intelligence
- Abstract
Many endogenous and external components may affect the physiological, mental and behavioral states in humans. Monitoring tools are required to evaluate biomarkers, identify biological events, and predict their outcomes. Being one of the valuable indicators, brain biomarkers derived from temporal or spectral electroencephalography (EEG) signals processing, allow for the classification of mental disorders and mental tasks. An EEG signal has a non-stationary nature and individual frequency feature, hence it can be concluded that each subject has peculiar timing and data to extract unique features. In order to classify data, which are collected by performing four mental task (reciting the alphabet backwards, imagination of rotation of a cube, imagination of right hand movements (open/close) and performing mathematical operations), discriminative features were extracted using four competitive time-frequency techniques; Wavelet Packet Decomposition (WPD), Morlet Wavelet Transform (MWT), Short Time Fourier Transform (STFT) and Wavelet Filter Bank (WFB), respectively. The extracted features using both time and frequency domain information were then reduced using a principal component analysis for subset reduction. Finally, the reduced subsets were fed into a multi-layer perceptron neural network (MP-NN) trained with back propagation (BP) algorithm to generate a predictive model. This study mainly focuses on comparing the relative performance of time-frequency feature extraction methods that are used to classify mental tasks. The real-time (RT) conducted experimental results underlined that the WPD feature extraction method outperforms with 92% classification accuracy compared to three other aforementioned methods for four different mental tasks.
- Copyright
- © 2017, the Authors. Published by Atlantis Press.
- Open Access
- This is an open access article under the CC BY-NC license (http://creativecommons.org/licences/by-nc/4.0/).
1. Introduction
Biomarkers are valuable parameters derived from biological systems which could be grouped into two categories. The first group is called as “structural” biomarkers that are extracted from physiological structures and principally defined at the genetic and/or molecular level while the second group, “functional”, is related to continuous measurements of body function throughout time to track physiological, mental and behavioral states. Other important subgroup of functional biomarkers includes status measurements of brain functions to monitor and interpret neural activity, identify specific neurological events and predict the outcomes. EEG signals have an event-dependent nature, therefore, it should be analyzed the variations of a signal feature both in time and frequency domains [1, 2]. Time-frequency feature extraction methods are investigated to extract features for classification of mental tasks. Four time-frequency based feature extraction methods to examine the dominant frequency band and timing in EEG signals are proposed and compared with each other’s classification performance for all dual and triple combinations of four pre-selected mental tasks. The mental tasks are defined as; a) Reciting the alphabet backwards, b) Imagination of rotation of a cube, c) Imagination of right hand movements (open/close), d) Performing mathematical operations. Following the feature extraction process, since non-linear classification methods outperform compared to linear approaches for non-linear systems [3], NN method to dichotomize the mental tasks were attached. Besides, prior to feature extraction step, due to high-dimensional characteristics of the EEG signals and possible accompanying artificial noise, a filtering procedure were applied. The remaining of the paper is organized as follows: In section 1, related studies are underlined, In section 3, four different feature extraction methods, WPD, MWT, STFT, and WFB are studied. Materials and methods are given in Section 4. Simulation and RT experiments are Section 5 discusses the performance of the generated model. Finally, the outcomes are discussed in terms of engineering perspective and future studies in Section 6.
2. Related Studies
Recent studies focus on the applications combining EEG and brain-computer interface (BCI). For example, mental tasks with speech imagery were extracted and classified by common spatial patterns (CSP) and support vector machine (SVM) with 82.3% classification accuracy in a study [4]. Motor imagery EEG signal processing were introduced by utilizing wavelet transformation (WT) under different classification performances varied between 78.5%-90.1% in [5]. A classification rate of about 80% was achieved using WPD based independent component analysis (ICA) in motor imagery of lower limb action in another study [6]. Wavelet NN models with various activation functions and different feature extraction techniques were analyzed in the task of epileptic seizure classification with high classification rates over 90% in [7]. Wavelet multi-resolution analysis was also performed to extract the various sub-bands of the raw EEG signal for the analysis of event related potentials in a study [8]. Left and right hand imagery movements were identified using STFT [9]. Comparison methods such as the discrete wavelet transform (DWT) and STFT were examined in detail [10]. A wavelet-packet-base dalgorithm were conducted for the extraction of neural rhythms [11]. Several cognitive tasks such as text reading, mathematical problem solving, watching videos etc. were also investigated in the sense of classification via DWT and principal component analysis (PCA), SVM with 86.09% accuracy [12, 13]. In [14], a multi-class filter bank CSP for four class motor imagery BCI was implemented to find a strong discriminative time-frequency based feature extraction method, which acquires higher satisfactory classification accuracy for all mental tasks to be used in BCI applications [15, 16]. The higher frequency components, which store valuable information of the signal, can only be observed in the WPD, which allows wavelet detail components to be divided into its own approximation and detail components [5, 13, 17–20]. In another study, a BCI based on using EEG signals associated with three arm movements for controlling robotic arm was designed and WT was used and performed with 91.1% classification rate with a MPNN. A multi-mental task classification based BCI was designed in [21] and the majority of classification errors are below 30% for recognizing EEG signals. Supervised classification methods were utilized to discriminate the EEG activity patterns to learn the mapping between EEG data and EEG classes corresponding to mental tasks in [22], where the best classification accuracy was 85.71% with a sigmoid transfer function, 0.1 learning rate and 0.2 momentum rate. A WPD based time-frequency approach were developed to classify motor imagery tasks, and reached an averaged classification of 78% in nine human subjects [23]. Comparison of performances by five NN training methods to classify five mental states, and the relevant frequency bands from EEG were studied in [24] and 90% accuracy was obtained with resilient BP algorithm. The classification results of SVM classifiers indicate that it is suitable for imagined motor and cognitive classification. Classifier performances of better than 80% for six imagined motor tasks, and for two affective tasks were achieved. Three cognitive tasks were successfully classified with 70% accuracy using wavelet features in [25]. Multi signal WPD based parameters could also be used as valuable features in RT EEG applications.
3. Materials and Methods
In this study, feature extraction, feature reduction and classification approaches have been applied to raw EEG data respectively. Later, generated model was tested using simulations and RT experiments. No prior study has been carried out combining aforementioned methods to make a RT trajectory tracking application. The aforementioned steps are designed considering the given flow chart given in figure 1.
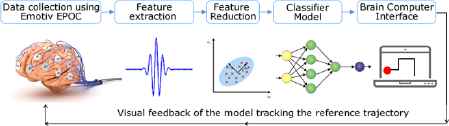
Designed architecture of RT trajectory tracking system
Emotiv EPOC wireless EEG headset was used to collect data. Matlab R2017a was used for data processing and BCI design steps on Intel Core i7, 8 GB memory configuration hardware running with Windows 7 OS.
3.1. Feature Extraction Methods in EEG Signals
Various time-frequency methods are used for feature extraction. Time-frequency methods analyze time-varying spectral properties of the non-stationary signals. In this section, STFT, WFB, WPD and MWT methods will be presented in details.
3.1.1. Short – Time Fourier Transform (STFT)
Basically, STFT extracts several frames of the original signal to be analyzed with a window frame that shifts with time. If the time window utilized, is narrow enough, each frame extracted could be evaluated as stationary which enables using Fourier transform (FT) [2]. STFT calculates a time-varying spectrum by implementing the Discrete Fourier transform (DFT) to a framed part of the data and by moving the frame through the whole record. With this approach, the spectral characteristics are processed as constant for each constant frame time, but catches the switches in the spectral characteristics using various, possibly overlapping, frame locations throughout the time. The magnitude squared of STFT yields the spectrogram of the function. STFT spectrogram is the normalized, squared magnitude of the STFT coefficients produced by the STFT [26]. Supposing x(n) a nonstationary EEG signal, STFT is applied to the EEG signal as in Eq. (1).
Here ψ(n) represents the windowing function. STFT shows the FT of the local windowed signal splitted in time domain and also represents frequency part of time variation. A spectrogram is defined as in Eq. (2).
3.1.2. Morlet Wavelet Transform (MWT)
Morlet wavelet (MW) is a form of continuous WT, which discriminate the phase and the amplitude elements of the signal. Thus it can be analyzed with this approach the alpha and beta frequency bands in the time-spectral domain. The theoretical background of the MW has been mentioned in the textbooks [27, 28]. The function of the Morlet wavelet ψ(t) is called as Gabor wavelet, which is given by [29] as in Eq.(3)
MW is a complex wave, which is composed with a normalization factor, complex sinusoid and a Gaussian bell curve envelope [28]. It gives a result of complex coefficient values, which consist of an imaginary and real part, after applying the MWT on a signal. From a computational view point, complex time-domain convolutions perform lack of efficiency. Therefore, power spectral density (PSD) is utilized to reveal the frequency domain response [29].
3.1.3. The Wavelet Packet Decomposition (WPD)
In EEG signal analysis, the components related to high-frequencies are strictly spaced in time domain, while the components related to low-frequencies are strictly spaced in frequency domain. Wavelets provide a way to analyze this type of signals both in time and frequency domains with a good frequency resolution along with finite time resolution by localizing the low frequency components and resolving high frequency components, respectively [28, 29]. The WPD can be modeled as a tree of subspaces. Ω0,0 shows the root of the signal space. The node Ωr,q with r standing for the scale and q correlating the sub-band index within the scale is decomposed into two orthogonal subspaces; an approximation space Ωr,q → Ωr+1,2q and a detailed space Ωr,q → Ωr+1,2q+1 [30]. The orthogonal basis {ϕr(t − 2rq)}q∈Z of Ωr,q were break down into two new orthogonal bases {ϕr+1(t − 2r+1q)}q∈Z of Ωr+1,2q and {ψr+1(t − 2r+1q)}q∈Z of Ωr+1,2q+1 where ϕr,q(t) and ψr,q(t) are the scaling and wavelet functions are represented in [31] as in Eq. (4).
Where 2r is known as the scaling parameter, 2rq is also known as translation parameter, which resolves the time location of the wavelet. The original signal can be analyzed in the selected time and frequency span [32, 33]. The feature vector of the signals, which are collected from each electrode channel has been obtained. The decomposition level is 7. The tree has 127 (2N-1) feature vector, where N=7 nodes in total. Since Daubechies wavelet family provides robust performance [33, 34], the main wavelet was selected as Daubechies-2. The pruning search algorithm and log-energy cost function was used.
3.1.4. Wavelet Filter Bank (WFB)
DWT produces wave from a signal and these waves can also be utilized to re-construct the signal again. There are produced two sets of function at each step of DWT decomposition referred as scaling coefficients xk+1(n) and the wavelet coefficients yk+1(n). These coefficients are given in Eq. (5) [35].
The original signal is performed by x0(n), while k is the scaling coefficient. DWT decomposes the original signal into sub-band frequency components by applying filtering process at each level of decomposition. The decomposition is made by using successive low-pass and high-pass filters [36]. Here g(n) and h(n) represents the low pass and high pass filters. The input of the next level decomposition, named as approximation coefficients is the output of the scaling function. The high-pass filter coefficients are related to any decomposed signal as detail coefficients. The low-pass filter is associated as scaling function, while high-pass filter is associated as wavelet function. These relationships can be constructed as in Eq. (7) [37].
Filter banks are used to produce orthogonal sets of wavelets that illustrates orthogonality characteristic on the subject of the even shifts [38].
3.2. Signal Acquisition
Ten able-bodied volunteers took part on the experiments. The volunteers were healthy and middle-aged. Before conducting the tests, the volunteers performed previous training sessions to increase their concentrations. EEG signals were measured when a subject is sitting in a chair. The EEG electrodes embedded in the neuro-headset are positioned according to the “International 10-20 method of placement”. EEG data were collected using “EMOTIV EPOC” neuroheadset that enables recording EEG signals from 14 channels of the headset (AF3-F7-F3-FC5-T7-P7-O1-O2-P8-T8-FC6-F4-F8-AF4), and also trace the power of the four main brain frequency bands [39] of signal using FFT. The neuro-headset collects samples from 14 channels with 128 samples/second. Simulink-EEG Importer was used for data recording process, which also communicates with “Matlab & Simulink” software. EEG data was collected from neuro-headset with the interface and transferred to “Matlab & Simulink” platform. While performing mental task classification, training and testing data were collected first for 10 seconds for each task. The sessions were repeated 40 times for training and 10 times for testing processes. Totally, 14x1600 train, 14x400 test data were collected for 4 mental tasks from 14 channels.
3.3. Pre-processing
Since the noise is a disturbing factor imported from various sources to the EEG signal, application of signal pre-processing step is vital to maximize the signal to-noise ratio (SNR). The noise could imported from non-neural sources or even from neural such as EEG features excluding the biomarkers. Notch filters with their null frequency of 50 Hz are employed to remove the strong power supply impact. On the other hand the use of a high-pass filters with a cut-off frequency lower than 0.3 Hz is employed to reject the disturbance effect of very low frequency components such as breathing. Besides, high-frequency noise is also extenuated via using low-pass filters with a cut-off frequency of 40 Hz. For eye-movement and muscular artifacts, various filters were used to remove the intervention of this kind of possible artifacts [40]. In our study, EEG signals collected from the subjects were first filtered using band-pass filter between 0,5 and 45 Hz with a 6th-order Butterworth band-pass filter to eliminate the artifacts. Since in electrophysiology commonly Butterworth and elliptic Infinite Impulse Response (IIR) filters are employed widely [41] and recent studies [42–44] underline the performance of Butterworth filters, it was applied in our study for pre-processing step. Besides, ICA is also another tool used to remove the artifacts caused by external stimuli. Due to its contribution to EEG source separation, pre-processing tools have been successfully implemented to EEG research to reduce EEG artifact, enhance the SNR of task-related EEG signals, and facilitate EEG source localization [45, 46]. Therefore, the utilization of a pre-processing step should be considered before initializing the classification process that is mostly achieved by taking the amplitude of pre-processed EEG time points as features, with low-pass or band-pass filtering and down-sampling as preprocessing. EEG data generally consist of main signal with additive noise, which is sufficiently different in frequency content from the signal. Non-neural physiological activities such as skin/sweat potentials should be removed to work on a noise-free signal, which is significant to reduce the execution time but increasing memory utilization [47].
4. Results and Evaluation
After applying the filtering and WPD, a valuable feature is to be determined. The dimension of the input training matrix and input test matrix for each feature was set as 14x1600 and 14x400 before the training process. MPNN trained by a standard BP algorithm, which uses the gradient steepest descent method to train the parameters of the network, was implemented later for classification. Nevertheless, the error curve may converge very slowly or the solution may fall into local minima at the end of the training process. Since there are 14 electrodes and approximately 18 features from each electrode, 250 neurons were assigned first but observed that the accuracy was better for 190 neurons for the hidden layer. As far as the learning rate is concerned, it is an important factor to control the gradient descent and to find an optimal learning rate. A small learning rate affects the convergence speed and the training may take much longer time than with a higher learning rate. A large learning rate may help the network escape from local minima, but the NN may go through a large oscillations and may never converge [48]. It was also explored that the values from “0.001” to “0.25”, namely “0.001, 0.01, 0.03, 0.1” and “0.25” as the various values of learning rate, and the optimal results were achieved with the learning rate of “0.03”. The results are given in table 1.

Performance comparison for various learning rates
Another important parameter to control convergence speed is momentum. During the calculation of weight-change value, a fraction of the previous change is added. The main idea is to keep the variations of weights going faster in the same direction. Momentum is usually set between 0.1 and 0.9. Former studies underlined that 0.9 is a reasonable choice [48]. In addition, three other levels “0.3, 0.5, 0.7” were set for the experiments conducted. The result of the experiments with the momentum value “0.7” outperformed compared to other values, therefore it was assigned as “0.7” for the momentum parameter.
4.1. Modelling and Cross Validation
To eliminate overfitting, it is a common to hold out part of the available data as a test set when performing a supervised learning experiment. such as NN. While evaluating “hyper parameters” for the predictive models there is still a risk of overfitting on the test set since the parameters could be tweaked until the estimator performs optimally. Thus, the information could “leak” into the model and the evaluation metrics then no longer report on generalization performance. In order to overcome the problem, whole data is split into 3 parts. Firstly, 70% of the data is processed as training set while the remaining data is split into equally sized “validation set” and “test set”. The training set was first used to fit the models and the validation set was then used to estimate prediction error for model selection. Finally, the test set was used for assessment of the generalization error of the final chosen model. Since partitioning the available data into three separate sets, we drastically reduce the number of sample sets which could be used for learning the model, and the results could depend on a particular random choice for train, validation sets. A valuable solution to this problem is cross-validation (CV). Basically, with k-fold CV the whole dataset is employed efficiently. A test set is still held out for final evaluation, but the validation set is no longer needed for CV. The training dataset is split into k smaller sets, the model is trained using k-1 of the folds as training data and then the resulting model is validated on the remaining data in order to compute a performance measure such as accuracy. This approach could be computationally expensive, but values the dataset is very small [49]. In this study, 6-fold CV with stratified sampling was used. To compare the performance of NN, SVM, k-Nearest neighbors (k-NN) and Naïve-Bayes (NB) models [50] were created using the datasets generated following four feature extraction methods. SVM represents a framework interesting from a machine learning perspective. A SVM is a linear or non-linear classifier and a mathematical function that is preferred to distinguish two different classes. In pattern recognition or classification, the k-NN algorithm is a technique for classifying objects based on the closest training examples in the problem space. k-NN is a type of instance-based learning, or lazy learning where the function is approximated locally and all computation is deferred until classification. NB is a set of supervised algorithm based on applying Bayes’ theorem with the naive assumption of independence between features [48].
Whereas in this research, various machine learning approaches and four feature extraction methods were combined in order to reveal the outperforming model. Therefore, especially for RT applications of nonlinear systems it is valuable and vital to generate a hybrid model prior to model selection process. The results given in table 2 highlights the significance and necessity of the process followed in our study. Since the performance of NN outperforms compared to the other classifiers, NN model was used for task classification.
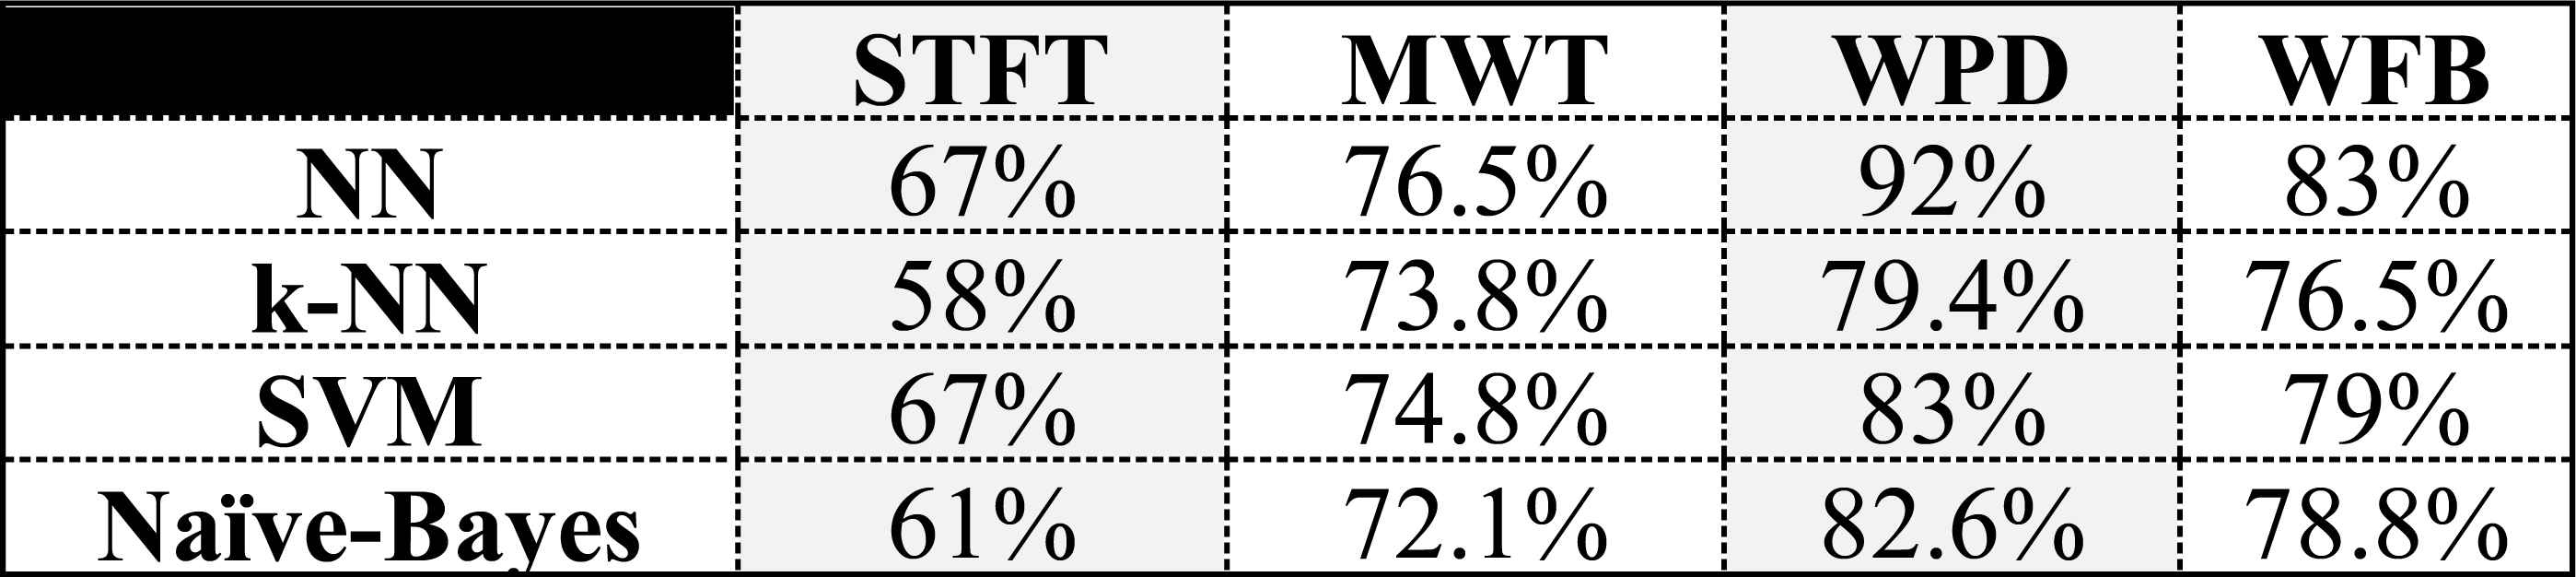
Classification performances of NN, k-NN, SVM, NB
Following the modeling process, the performance of each feature extraction method was assessed for each mental task group as given in table 3. The mental task classes are classified as; Recite the alphabet backwards (1), Imagination of rotation of a cube (2), Imagination of right hand movements (3), Mentally perform mathematical operation (4). From the results presented in table 3, WPD performed quite satisfactory classification performance almost for all task classes. WFB method has shown the best classification performance in discriminating “2-3”, “2-4” numbered classes, however it has shown worst classification performance in “1-3”, “1-4”, respectively.
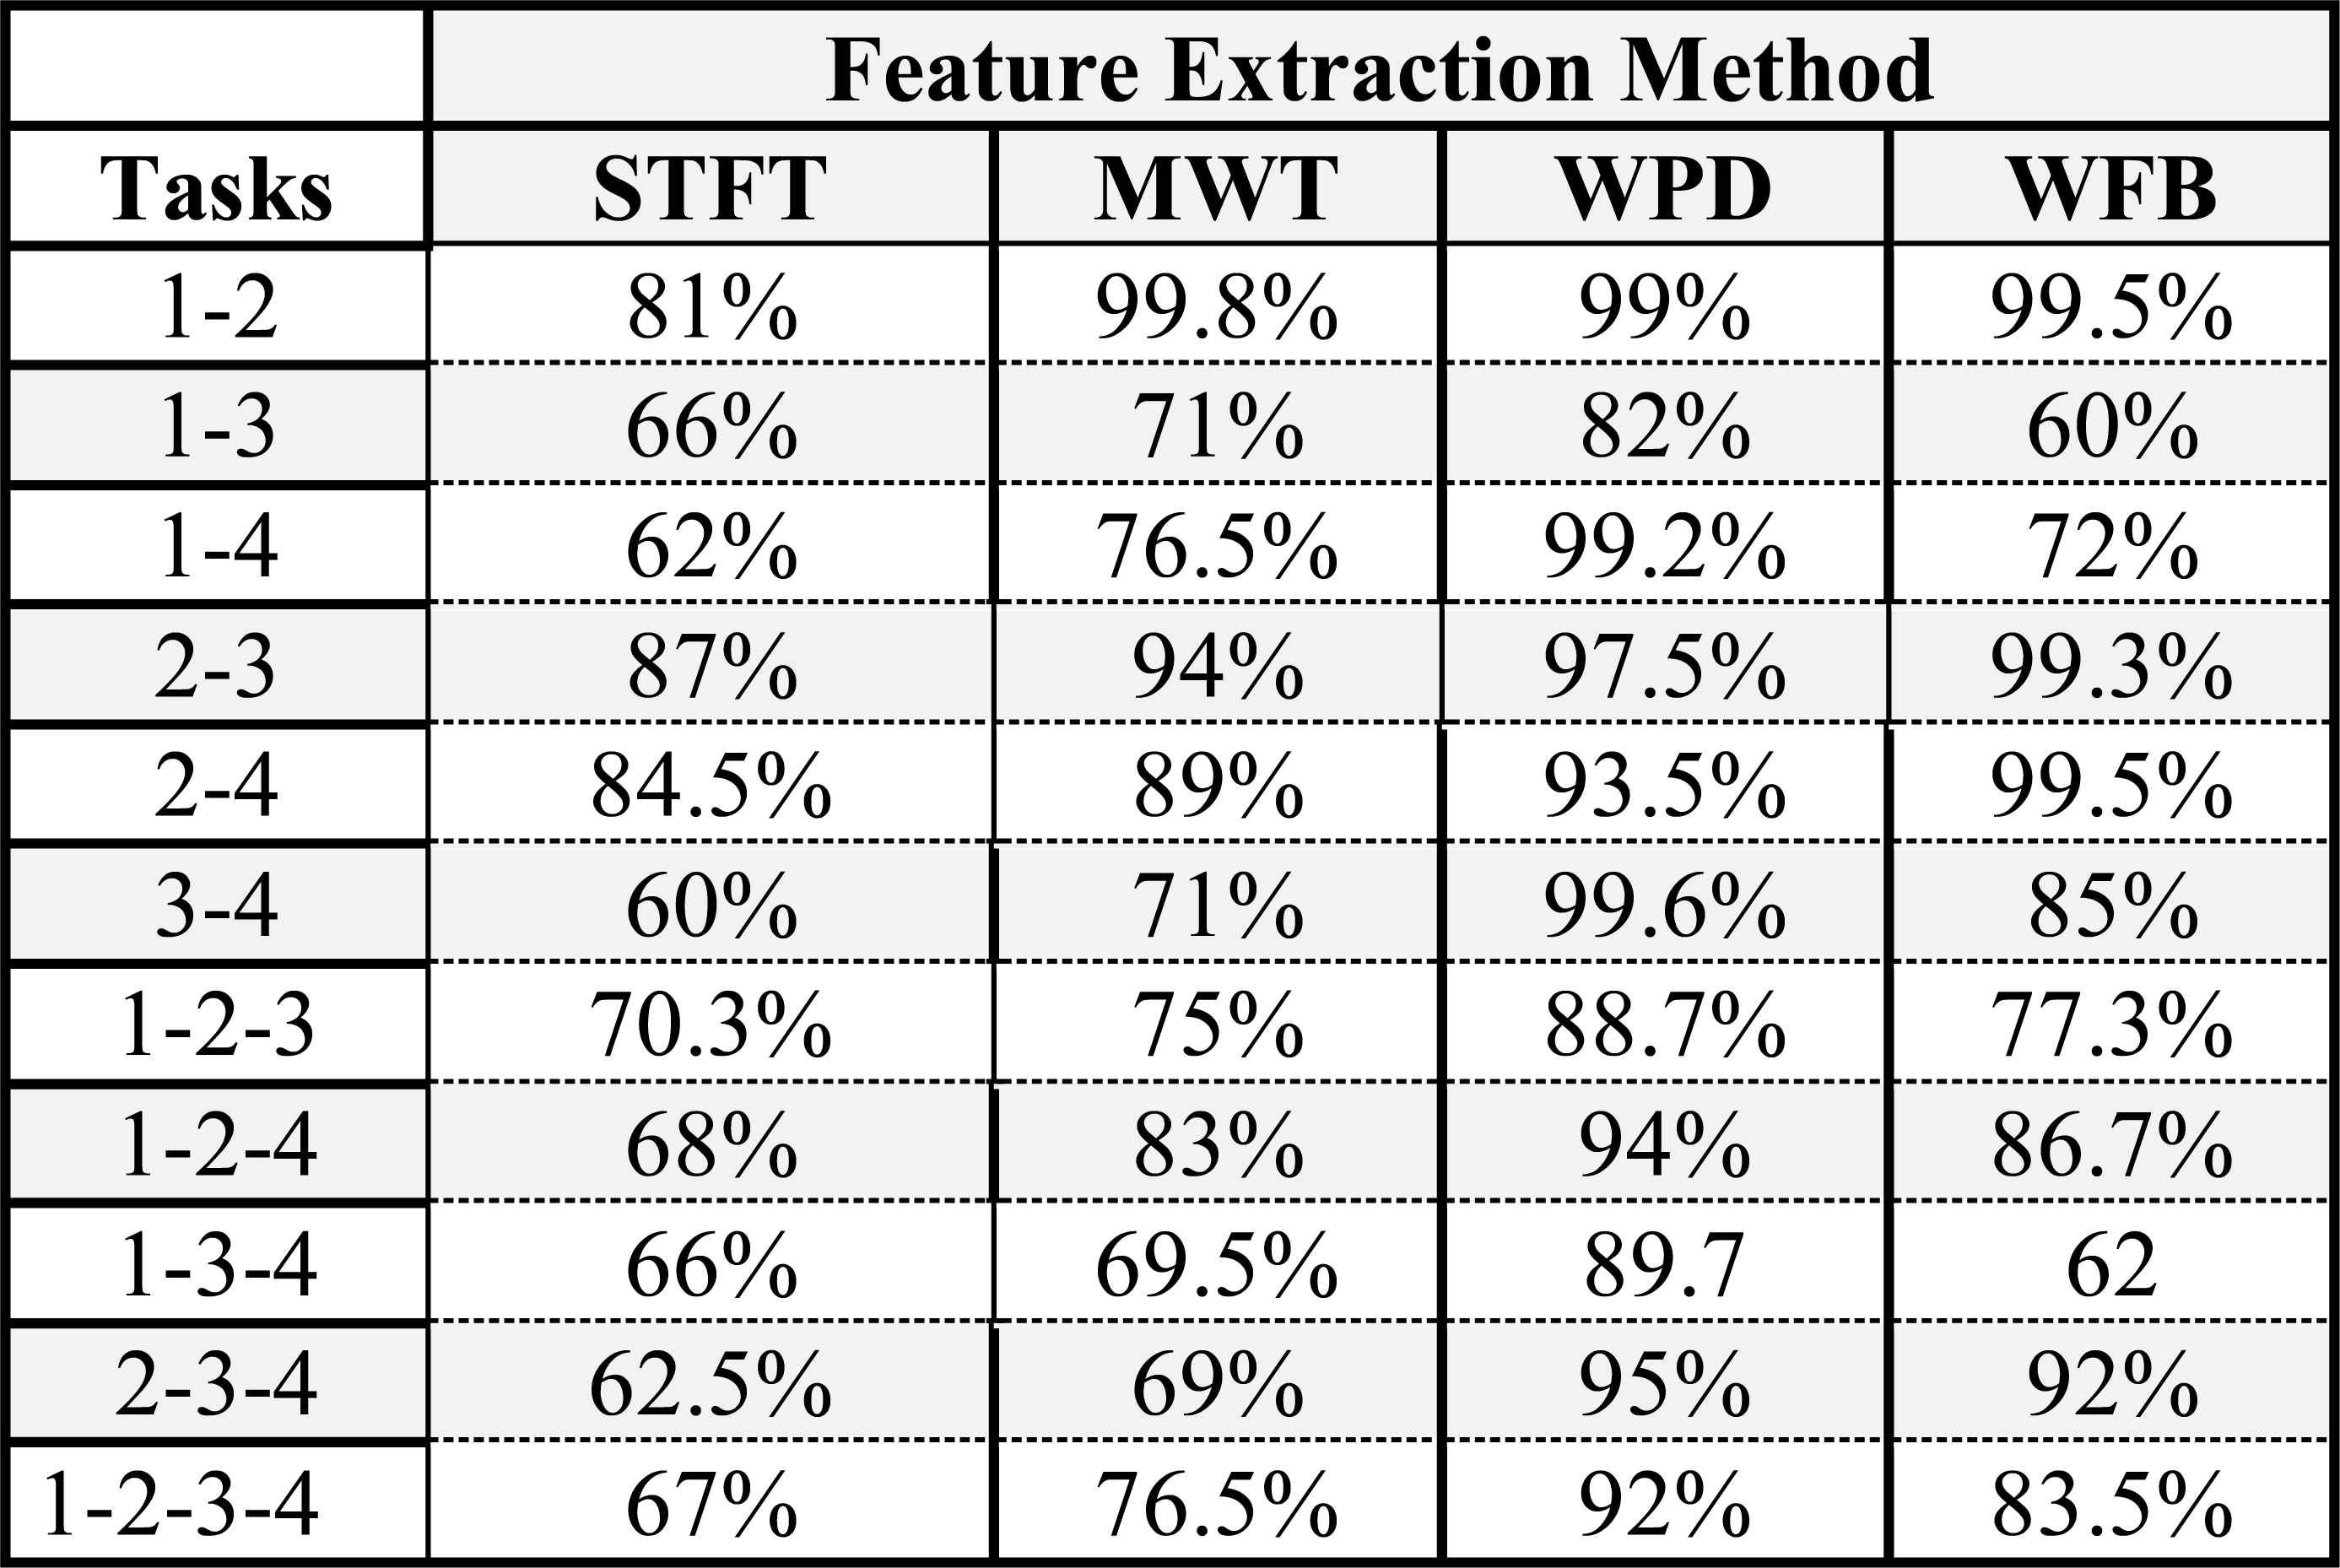
Classification accuracy of feature extraction methods
The WPD method is also good for classifying “2-3”, “2-4” numbered tasks. STFT and MWT revealed the worst performance in the classification of “1-3”, “1-4”, “3-4”, “1-2-3”, “1-3-4”, “2-3-4” numbered tasks. Table 4 gives the confusion matrix for four mental tasks using WPD.
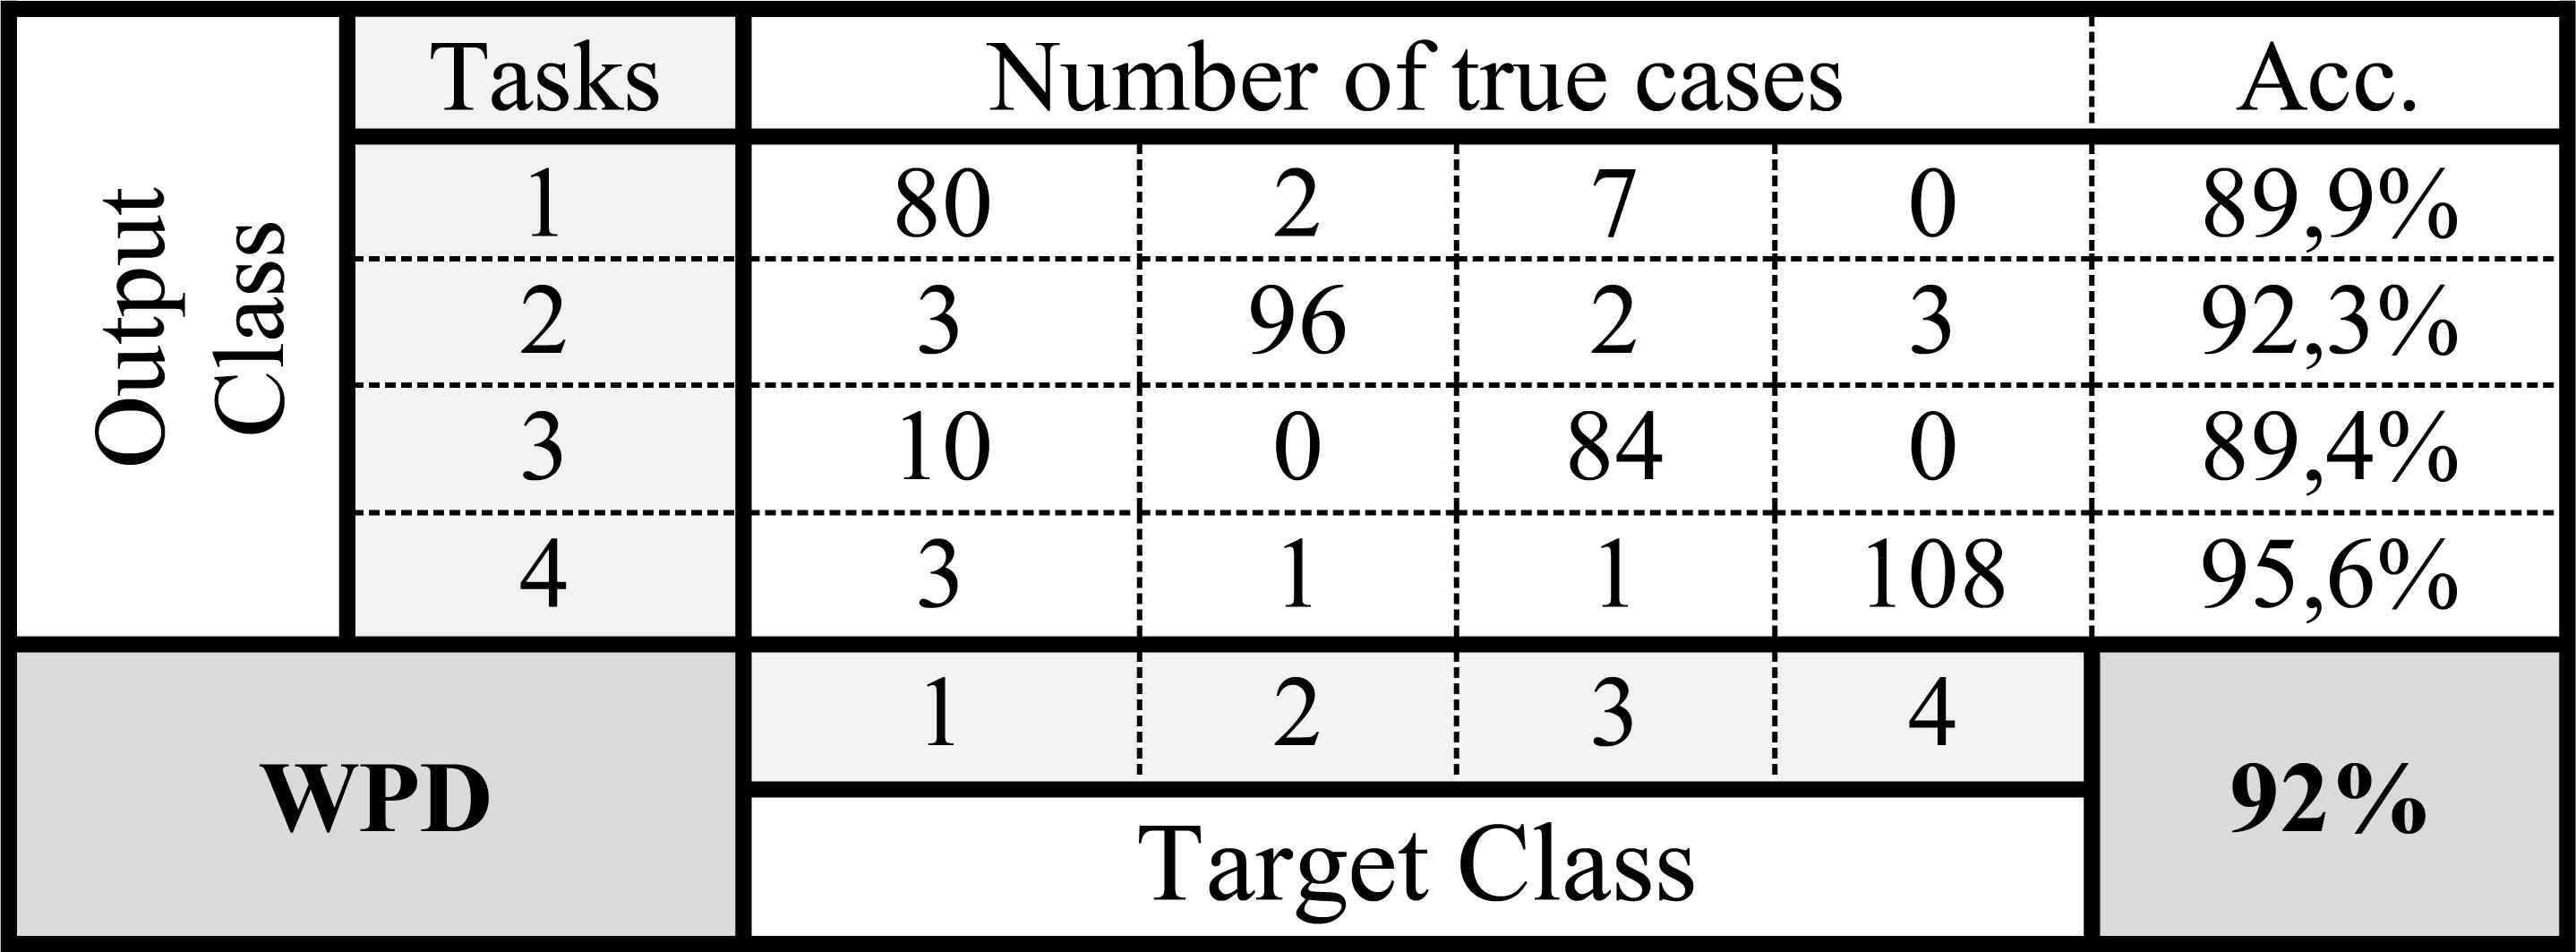
Confusion matrix for the 4 mental task with WPD
4.2. Simulation Experiments
Following the model generation process, various experiments were performed to demonstrate the efficacy of the model performance. Firstly, triple combination of the tasks was tested to observe the switching ability of the model. Later, four of the tasks were used consecutively to test the overall RT tracking performance. In figure 2, the reference trajectory is followed using “reciting the alphabet backwards (UP), imagination of right hand movements (RIGHT) and performing mathematical operation (DOWN).
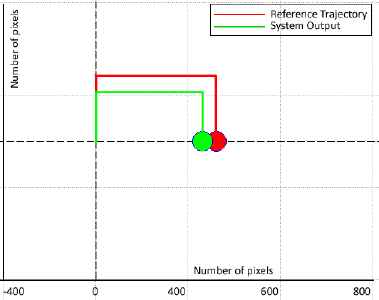
Reciting the alphabet backwards, Imagining right hand movements and performing mathematical operation tasks
4.3. Real-time Experiments
Following the simulation process, the reference trajectories are set as given in figure 3 and 4 to test RT tracking performance. Since repeated switching in a short period of time is distracting, the switching between 4 tasks after 30 seconds, so that the user could concentrate on a specific task and maintain the stability of the active task, was tried. The dual task combination is given in figure 3. Here, the user initiated the test from a starting point to reach 4 different targets. The reference trajectories are plotted as dashed lines and the system output is plotted as straight colored lines. For each target, the user restarted the process. As each target is accessed, the new trajectory is given to the user. For the first target, T1, the user is supposed to imagine the tasks to move the green ball to T1 by reciting the alphabet backwards and imagining the rotation of a cube. Later, for target T2, the user focused on the tasks reciting the alphabet backwards to move the green ball up and imagining of right hand movements to move the green ball right respectively. In order to move the green ball to target T3, the user focused on performing mathematical operations to move the ball down and imagined rotation of a cube to move the ball left respectively. Finally, the user made mathematical operations to move the ball down and later imagined right hand movement tasks to move the ball right for target T4.
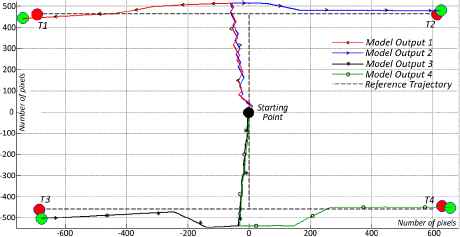
RT trajectory tracking test for 4 target points
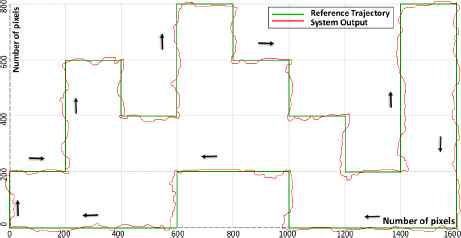
RT tracking response to step transition reference
Completing the first step, second step of RT trajectory tracking experiments was performed as depicted in figure 4. Here, a reference with step inputs was set and the user switched between the tasks considering the trajectory. Each axis is represented with the number of pixels. The model output is plotted as red line. First, the reference trajectory was defined and presented to the user on the screen. Then, the user with wireless EEG neuro-headset was instructed to imagine the related task to move the ball on the reference trajectory. The arrows exhibit the direction of the reference trajectory. As it is seen from the system output, the user selects the proper task to move to the related direction. Complete set of four tasks were employed and all directions were visited successively. Therefore, the user could switch from one task to another to complete the loop. That was a critical step for the user to evaluate both the switching ability and overall classification performance of the system for all four tasks. In case of misclassification or decrease of concentration the model could deviate from the trajectory. That is why the calculated classification accuracy is 92% and the reflection of that accuracy is depicted on the figure as deviations. Because of the lack of concentration and misclassification, the model output did not completely fit on the trajectory but from the figure given below, it is possible to deduce that the RT performance of the generated model is quite satisfactory.
5. Conclusion
This study has underlined the methods used for feature extraction of EEG signals to be used to classify mental tasks in order to be applied to a BCI application. Following the feature extraction procedure, the classification of the patterns based on the time-frequency spectrum features were carried out using NN. We confirmed that the WPD approach is more proper feature extraction technique. However, each time-frequency feature extraction method has weak and strong sides compared to each other. The experimental results showed that the WPD algorithm generates comparatively better classification accuracy rates 92% for all mental tasks together. STFT algorithm on the other hand generated the worst classification performance with 67% for all mental tasks. Early studies revealed that the use of the STFT and MWT to extract reliable features from EEG signals outperforms in Motor Imagery tasks classification [50]. Similar other studies underlined that better classification performance could be achieved with STFT and MWT methods on motor imagery tasks rather than visual, mental imagery tasks not related with motor activity of the brain. Studies specifically focus on those tasks, because they strongly involve hemispheric brainwave asymmetry. In a recent study, it was underlined that arithmetic tasks exhibit a higher power spectrum in the right hemisphere while visual tasks do so in the left hemisphere [49]. Thus, feature vector extracted by WPD method performed better classification accuracy to discriminate “Cube” and “MathOp” tasks. Mapping brain activity patterns were studied in recent decades and contributes to development process of BCI design. This type of interface is extremely useful for disabled subjects where one can control robotic systems that assist non-functional body members. Part of the studies in this area focuses on noninvasive interfaces, in order to broaden the interface usage to a larger number of users without surgical risks. Thus, the purpose of this study focused on assessing the performance of different feature extraction methods to classify four different mental tasks using EEG signals. The use of an efficient method based on time-frequency representations was of vital importance of the researchers for future studies. Future work will utilize for applying these promising methods to RT BCI systems. A real environment could be designed to perform grasping tasks for daily used objects using task classification. In this sense, a pneumatic gripper could be attached to the robotic system as end effector. The control strategies could also be improved using fuzzy controller to reduce the positioning error, when necessary.
Ethical approval
For this type of study formal consent is not required.
References
Cite this article
TY  - JOUR
AU  - Caglar Uyulan
AU  - Turker Tekin Erguzel
PY  - 2017
DA  - 2017/07/26
TI  - Analysis of Time – Frequency EEG Feature Extraction Methods for Mental Task Classification
JO  - International Journal of Computational Intelligence Systems
SP  - 1280
EP  - 1288
VL  - 10
IS  - 1
SN  - 1875-6883
UR  - https://doi.org/10.2991/ijcis.10.1.87
DO  - 10.2991/ijcis.10.1.87
ID  - Uyulan2017
ER  -