
Modeling radial artery pressure waveforms using curve fitting: Comparison of four types of fitting functions
- DOI
- 10.1016/j.artres.2018.08.003How to use a DOI?
- Keywords
- Curve fitting; Raleigh function; Double-exponential function; Gaussian function; Logarithmic normal function; Radial artery pressure waveform (RAPW); Mean absolute error
- Abstract
Background: Curve fitting has been intensively used to model artery pressure waveform (APW). The modelling accuracy can greatly influence the calculation of APWs parameters that serve as quantitative measures for assessing the morphological characteristics of APWs. However, it is unclear which fitting function is more suitable for APW. In this paper, we compared the fitting accuracies of four types of fitting functions, including Raleigh function, double-exponential function, Gaussian function, and logarithmic normal function, in modeling radial artery pressure waveform (RAPW).
Methods: RAPWs were recorded from 24 healthy subjects in resting supine position. To perform curve fitting, 10 consecutive stable RAPWs for each subject were randomly selected and each waveform was fitted using three instances of the same fitting function.
Results: The mean absolute percentage errors (MAPE) of the fitting results were 5.89% ± 0.46% (standard deviation), 3.31% ± 0.22%, 2.25% ± 0.31%, and 1.49% ± 0.28% for Raleigh function, double-exponential function, Gaussian function, and logarithmic normal function, respectively. Their corresponding mean maximum residual errors were 23.71%, 17.83%, 6.11%, and 5.49%.
Conclusions: The performance of using Gaussian function and logarithmic normal function to model RAPW is comparable, and is better than that of using Raleigh function and double-exponential function.
- Copyright
- © 2018 Association for Research into Arterial Structure and Physiology. Published by Elsevier B.V. All rights reserved.
- Open Access
- This is an open access article distributed under the CC BY-NC license.
Introduction
It has been widely accepted that changes of artery pressure waveform (APW) characteristics are risk indicators of cardiovascular diseases.1–3 Pulse transit time (PTT), pulse wave velocity (PWV), and reflection index (RI) have been derived from APWs as parameters of clinical interest.1,4–6 Many techniques are used to obtain information on human physiology or pathology by studying changes in APWs. Traditionally, derivative methods can acquire the morphological changes of APWs by extracting parameters and wave intensity analysis can obtain changes of wave reflections in the nature and timing according to APWs’ pressure and flow velocity.7–10 Though simple and can be used for real-time computing are the advantages of these technologies, they fail to analyze the features of the complete APWs and their performance is relatively poor when APWs are weak and noisy.
Curve fitting has been intensively studied recently to quantitatively assess the morphological changes of APWs. APW is a composite of a forward wave and a reflected wave.11 Each wave can be approximated by a fitting function. The change of APW is completely reflected by the parameter changes of the fitting function. Whether or not the reflected wave can be found in an intuitive way, this analysis method can easily represent the reflected wave and make the characteristics of APW very clear. The fitting parameters are obtained by least squares method, which is a macroscopic method, so it can effectively suppress noise and greatly improve the precision of measurement. Several different fitting functions have been applied, e.g., triangular function,12 Raleigh function,13 Gaussian function,14 and logarithmic normal function.15 Among them, triangular function showed much deviation between the fitting result and original waveform and is thus rarely used currently.12 A mean square error (MSE) of <0.5% was achieved in reconstructing finger photoplethysmographic (PPG) waveform using two Raleigh functions.13 An average maximum residue error of 4% was reported based on five logarithmic normal function to decompose finger and tip PPG waveform.15,16 Four Gaussian functions resulted in a residual error of <10% for decomposing ear and finger PPG.14 To reconstruct the digital volume pulse waveform detected on the left index finger, four or five Gaussian functions were used with both suggesting a root mean square error of <2.0%.17 A similar fitting approach using five Gaussian functions has also been applied in order for extracting feature points from finger PPG.18 For modelling carotid and radial APWs, Liu et al. have demonstrated that three positive Gaussian functions are already optimal, resulting in a mean absolute percentage error (MAPE) of as low as 1.1% and 1.0%, respectively, for carotid and radial APWs.19 Double-exponential often has been used as fitting functions for corona discharge and high voltage20 and bimodal waveform occasionally appears in sleep apnea patients’ waveforms obtained from finger PPG, which is what we will study next. In this paper double-exponential has been used as contrast fitting function.
The modelling accuracy can greatly influence the calculation of APWs parameters that serve as quantitative measures for assessing the morphological characteristics of APWs. However, it is unclear which fitting function is more appropriate, even though relatively low fitting errors have been reported for all those functions. Besides, APWs detected at different sites have been used in those studies which makes the results less comparable. In this work, we aimed to compare the performance of four fitting functions, i.e., Raleigh function, logarithmic normal function, Gaussian function, and double-exponential function to model the APWs collected at the radial site.
Methods
Data
Data used in this paper came from our previous study.21 Table 1 shows the participants’ basic clinical information. Ethical permission was received from the ethical committee of Shandong Provincial Hospital and all participants gave their informed consent. In short, the radial artery pressure waveform (RAPW) of right arm were recorded for 40 s with a sampling rate of 500 Hz by piezoelectric sensor from 24 healthy participants in a supine position and then were filtered by the band-pass filter (0.05–35 Hz). An open-source algorithm22,23 was used to detect the feet of each recording and 10 successive normal sinus cardiac cycles were intercepted based on the feet, then 10 separate beats were extracted respectively between two adjacent pulse feet. Each separate beat was normalized to eliminate pressure effects, that was, each separate beat was finally to having a fixed length of 1000 (by interpolation) and 1-unit amplitude (i.e., pulse foot has an amplitude of 0 and pulse peak of 1).
| Variables | Value | Range (min–max) |
|---|---|---|
| Number (M/F) | 24 (14/10) | – |
| Age (year) | 29 ± 8 | 21–50 |
| Height | 169 ± 8 | 151–183 |
| Weight (kg) | 63 ± 11 | 41–87 |
| BMI (kg/m2) | 22 ± 3 | 15–27 |
| SBP (mmHg) | 115 ± 12 | 93–137 |
| DBP (mmHg) | 70 ± 10 | 57–95 |
| MAP (mmHg) | 85 ± 10 | 69–107 |
Value: mean ± SD.
The 24 participants’ basic clinical information.
Reconstruction of RAPW using curve fitting
Curve fitting was performed to reconstruct each specific RAPW segment. Here, we examined four different fitting functions:
- i)
Raleigh function as defined by:
- ii)
Double-exponential function as defined by:
- iii)
Gaussian function which is defined by:
Similarly, n = 1, 2, …, 1000 and k indicates different Gaussian functions with k = 1, 2, 3 and determined by three parameters: Hk (0 < Hk < 1), Wk (0 < Wk < 1000), and Ck (1 < C1 < C2 < C3).
- iv)
Logarithmic normal function which is defined by:
Still, n = 1, 2, …, 1000 and k represents different Logarithmic normal functions with k = 1, 2, 3 and defined by three parameters: Ak (0 < Ak < 1), Wk (0 < Wk < 1), and Xck (0 < Xck < 1).
Liu et al. have reported that using three positive Gaussian functions can accurately and reliably model radial pulses.19 For each of the four fitting function types (Raleigh function, double-exponential function, Gaussian function and logarithmic normal function), three sub-functions are superimposed, i.e.,
Figure 1 illustrates separately three realizations of the four fitting functions with different combinations of parameters obtained by TSPSO for reconstructing a normalized RAPW segment.
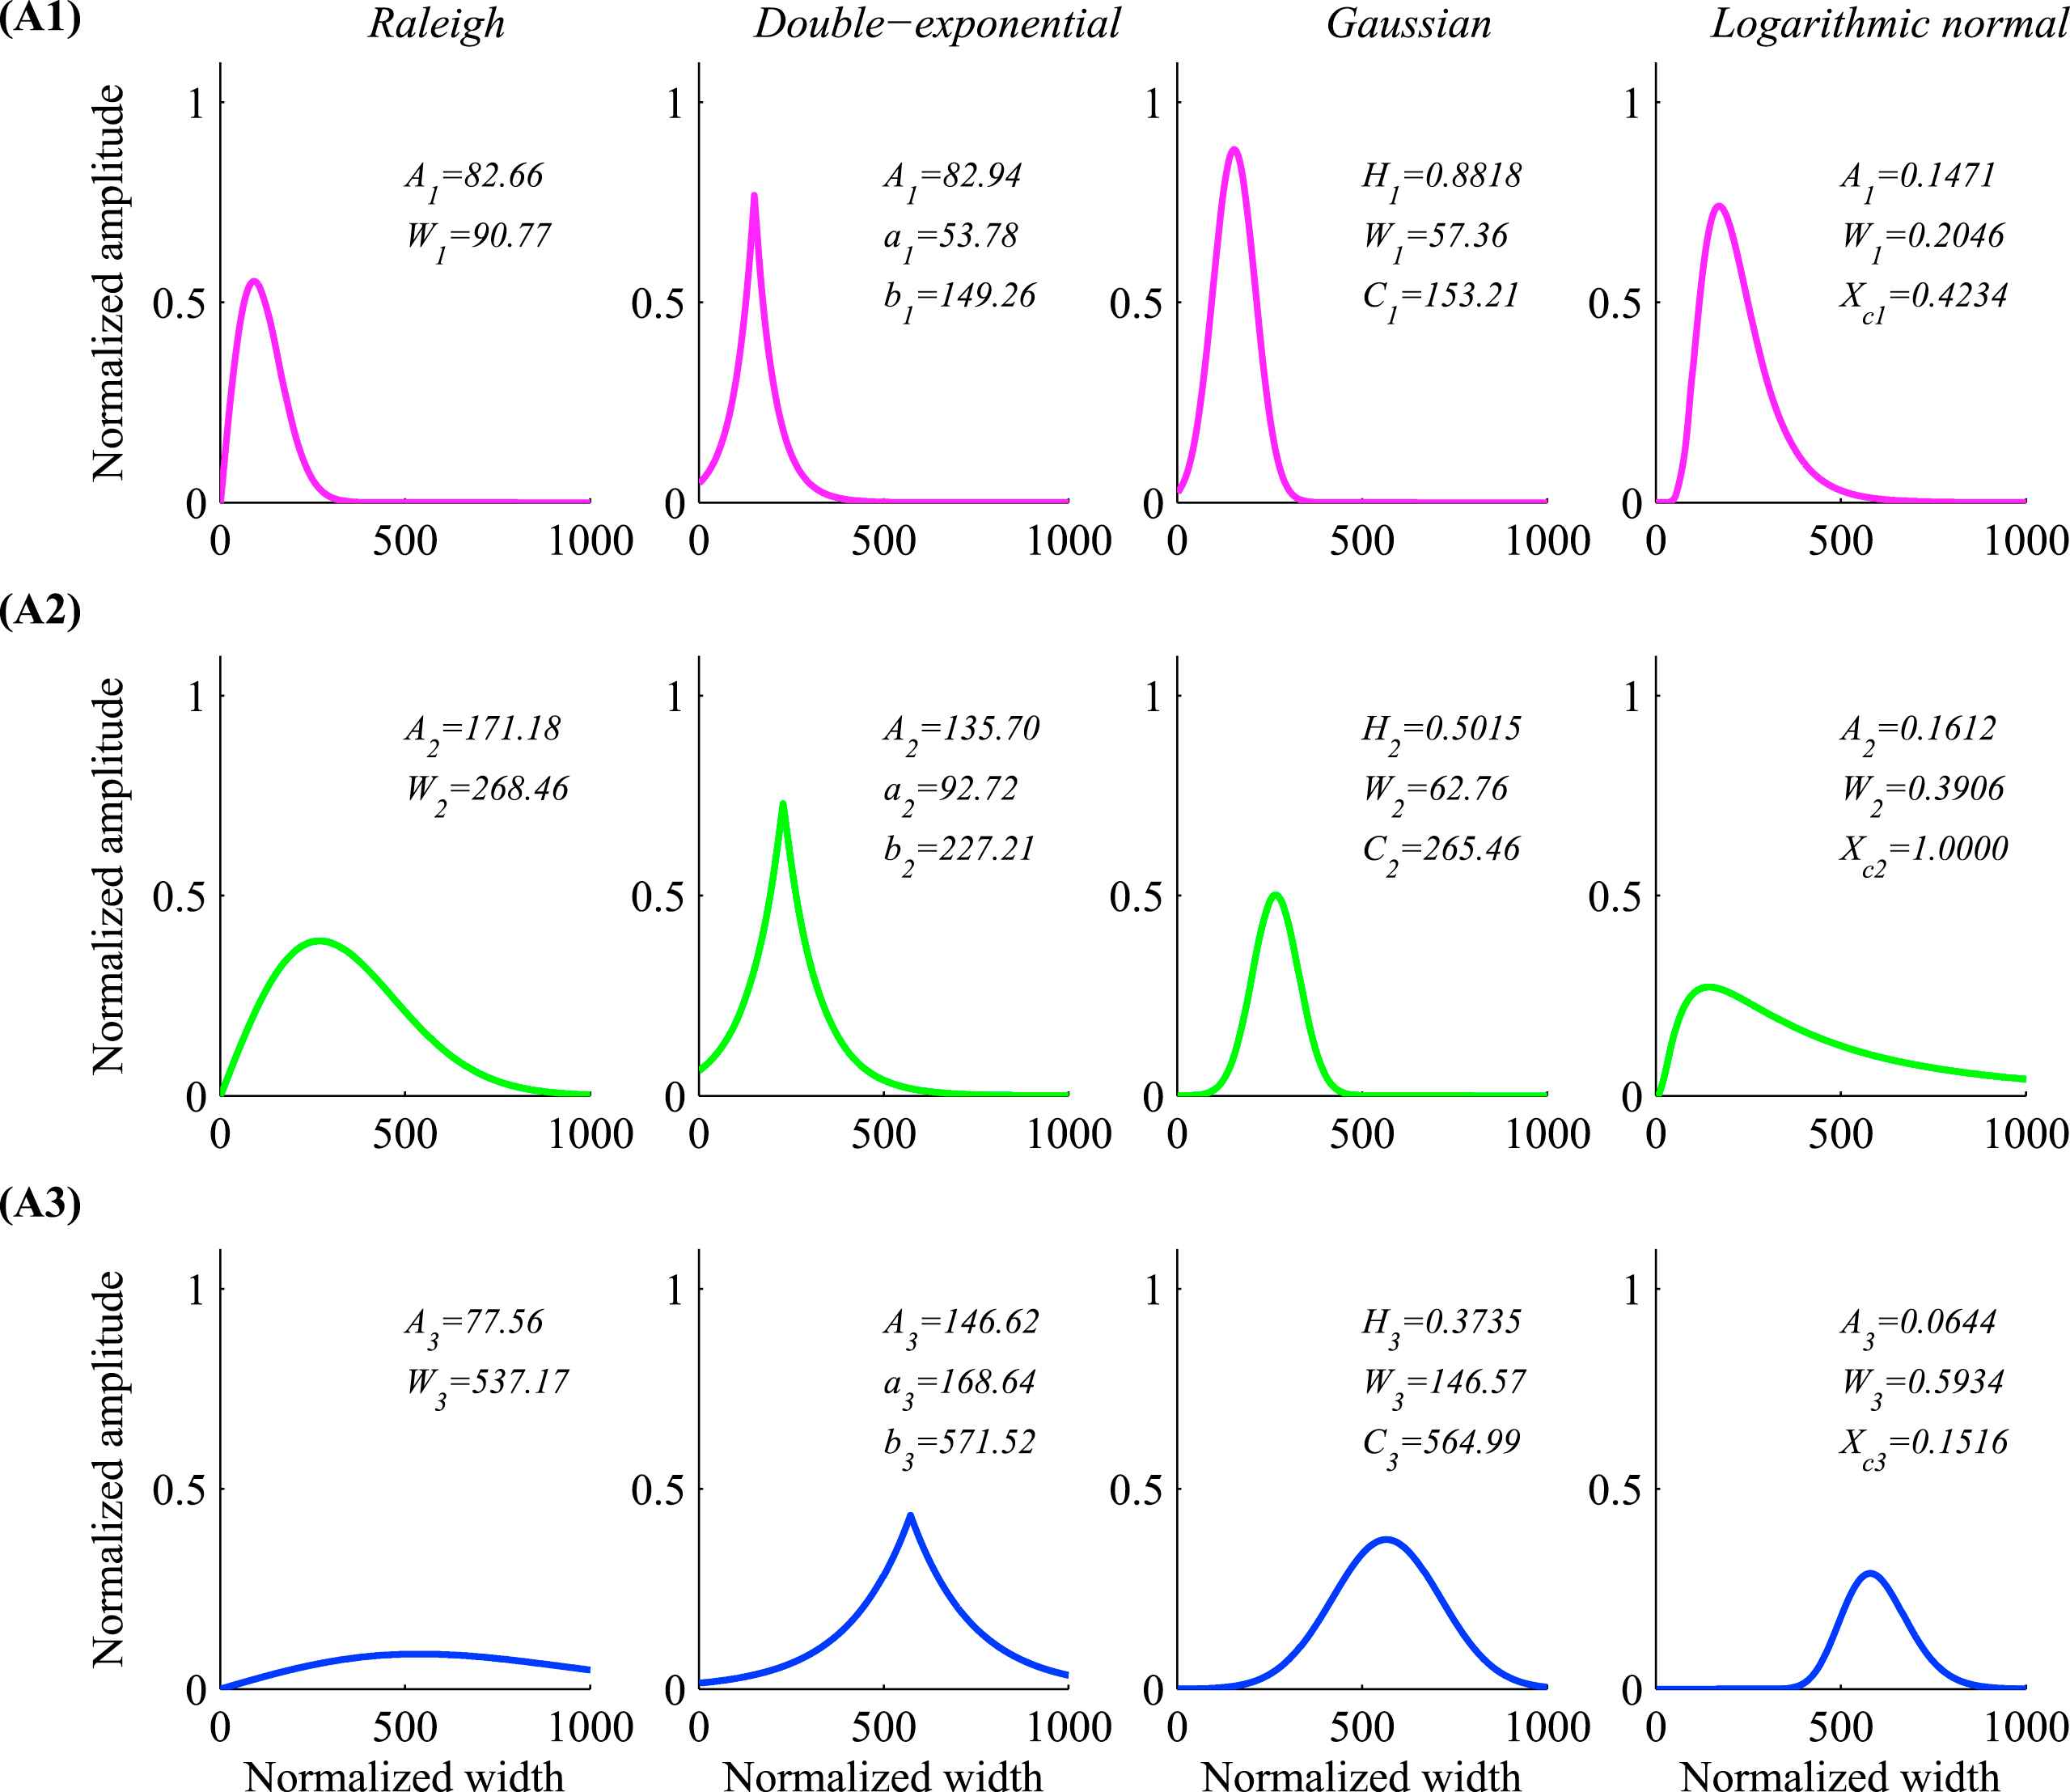
An example of three realizations (top to bottom panels) of the four fitting functions (left to right panels: Raleigh, double-exponential, Gaussian and logarithmic normal) with different combination of parameters.
Statistical analysis
For each subject, the mean MAPE and Max_R were calculated by averaging the results of 10 RAPWs segments. The overall mean and standard deviation11 of MAPE and Max_R were then obtained across the 24 subjects. Performance of the four fitting functions in term of MAPE and Max_R were compared using paired T test. Analysis of paired T test was performed to investigate the difference of MAPE/Max_R error between four functions comparing each other. Statistical significance is considered if P < 0.05.
Results
Example of fitting results for a same RAPW segment using the four fitting functions are summarized in Fig. 2. Figure 2 shows the accuracy of curve fitting using different fitting functions in term of residual error for each individual.
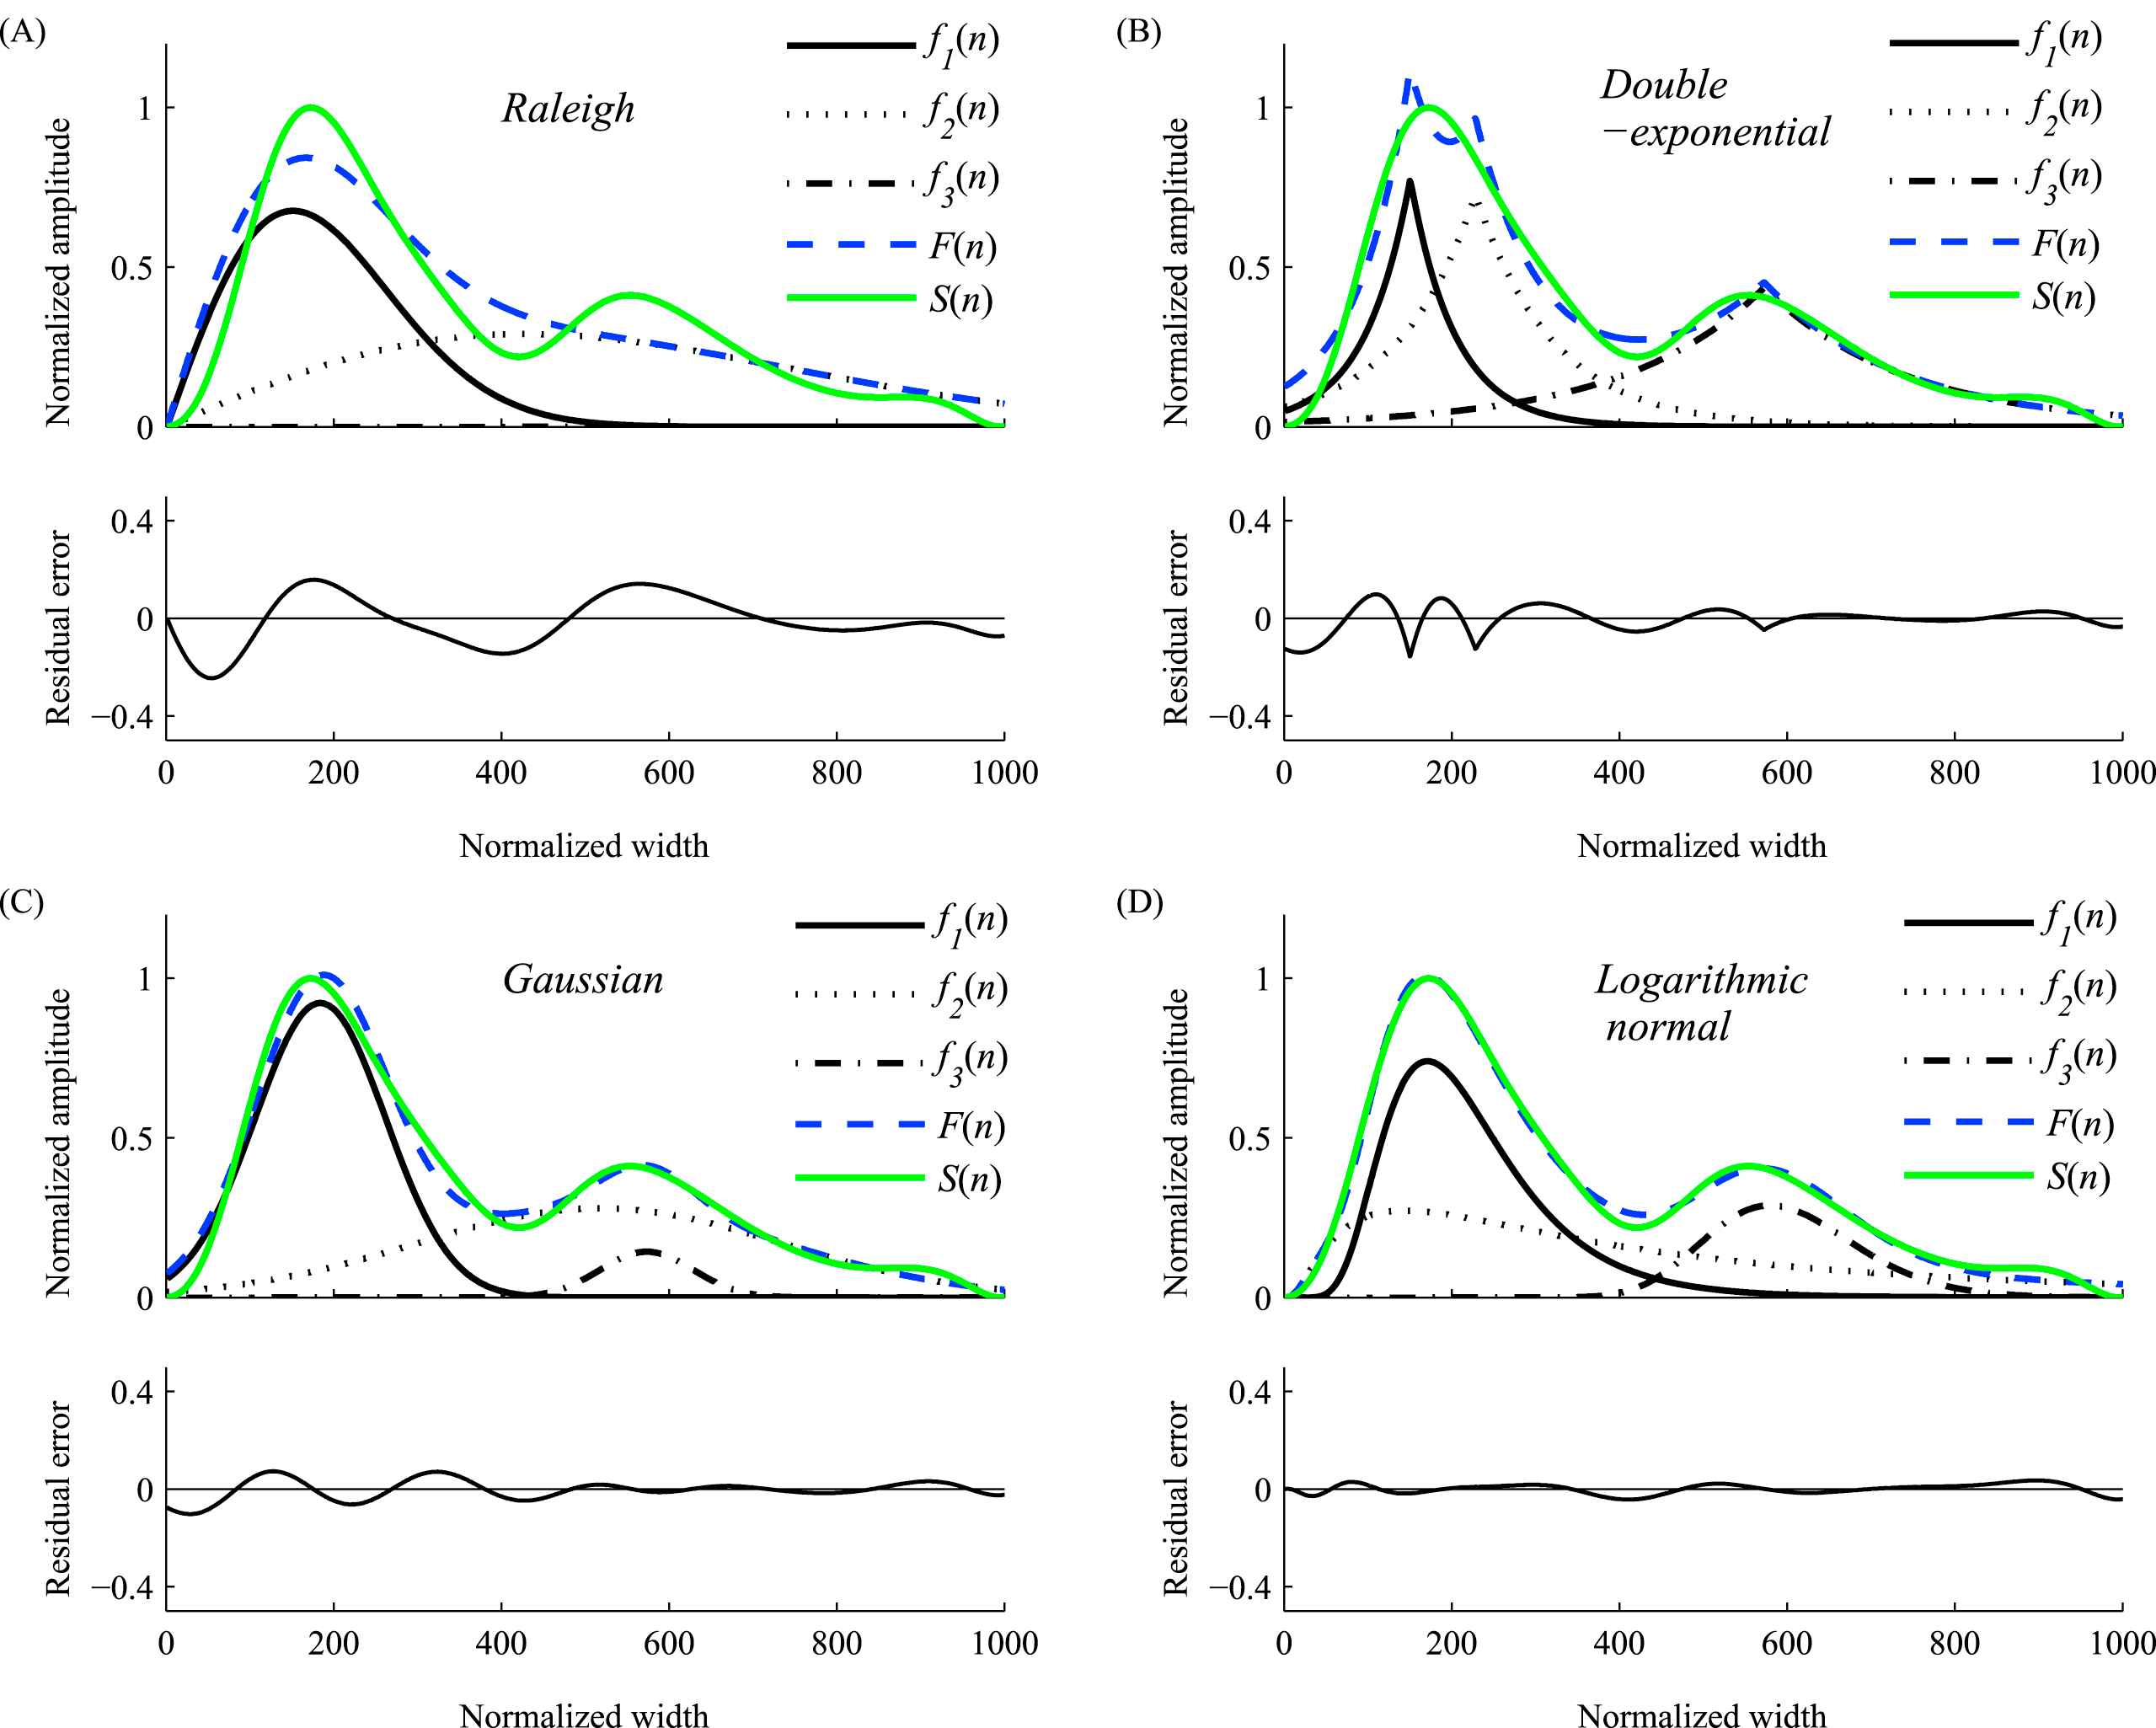
An example of waveform fitting using four fitting functions. (A) Raleigh function, (B) Double-exponential function, (C) Gaussian function, and (D) Logarithmic normal function. S(n): the original normalized pulse; F(n): the fitting result function; f1(n), f2(n) and f3(n): three sub-fitting functions. In the bottom of each subfigure, the residual error of fitting function was showed.
Table 2 show the performance of the four fitting functions for all 24 subjects. There are essentially different for MAPE between four functions comparing each other (all P < 0.01). Raleigh function has the biggest MAPE, while logarithmic normal function has the smallest MAPE. As for Max_R, Raleigh function and double-exponential function have larger compared to the other two (all P < 0.01). Logarithmic normal function and Gaussian function have comparable performance with P > 0.18.
| Function | MAPE (%) | Max_R (%) | ||
|---|---|---|---|---|
| Mean | SD | Mean | SD | |
| Raleigh | 5.89 (4.71–8.35) | 0.46 (0.22–0.90) | 23.71 (21.38–25.77) | 0.56 (0.32–1.13) |
| Double-exponential | 3.31 (2.83–3.82) | 0.22 (0.06–0.54) | 17.83 (14.62–20.72) | 1.06 (0.18–3.25) |
| Gaussian | 2.25 (1.35–3.24) | 0.31 (0.13–0.67) | 6.11 (3.59–8.82) | 0.99 (0.19–2.13) |
| Logarithmic normal | 1.49 (0.88–2.27) | 0.28 (0.07–0.78) | 5.49 (3.10–7.51) | 0.54 (0.26–2.19) |
Note: Values were expressed as mean (minimum, maximum).
Four fitting function’s overall means and SDs of MAPE and Max_R values from 24 subjects.
Discussion
In this study, we compared the fitting accuracies of four fitting functions, i.e., Raleigh function, double-exponential function, Gaussian function, and logarithmic normal function, for reconstructing RAPWs. Overall, Gaussian function and logarithmic normal function showed comparable performance in term of MAPE (2.25% and 1.49%, respectively) and Max_R (6.11% and 5.49%, respectively), whereas Raleigh function and double-exponential function displayed worse performance (MAPE: 5.89% and 3.31%; Max_R: 23.71% and 17.83%).
The accuracy of fitting function can greatly influence the calculation of APWs parameters that serve as quantitative measures for assessing the morphological characteristics of APWs. It should note that pulse curve fitting is only the first step for clinical pulse analysis. By decomposing the pulse waveforms into different types of sub-waveform components, especially into the forward and backward sub-waveform components, we can obtain the clinically relevant features, and thus to help the doctors for the further disease diagnosis. For these application, typical examples existed: such as logarithmic normal function-based analysis for the estimation and determination of arterial elasticity,15 Gaussian functions-based analysis for cardiovascular diseases diagnosis.25 We identify this point as our future work, to explore the relationship between sub-waveform features and clinical diseases.
At different collecting locations, the peripheral APWs show different contours or shapes.26 It is possible that the accuracies of fitting functions vary across different waveform contours. As a first step to explore this hypothesis, Fig. 3 and Table 3 show the accuracies of four fitting functions for modeling three APW segments that have different contours. For waveforms showed from Fig. 3 (A1) to (A3), the accuracies of Raleigh, Gaussian and logarithmic normal become worse with bigger MAPE, while the accuracy of double-exponential becomes better with smaller MAPE. For cases shown in Fig. 3 (A1) and (A2), Gaussian function shows the best performance with the smallest MAPE of 0.66% and 0.74%, respectively. For Fig. 3 (A2), logarithmic normal function shows the best performance with the smallest MAPE of 0.99%. Previously published studies may have concluded differently regarding which fitting function performs best. These preliminary results reported here demonstrate that it is possible that different sites for collecting data that have been applied in previous studied lead to the discrepancies.
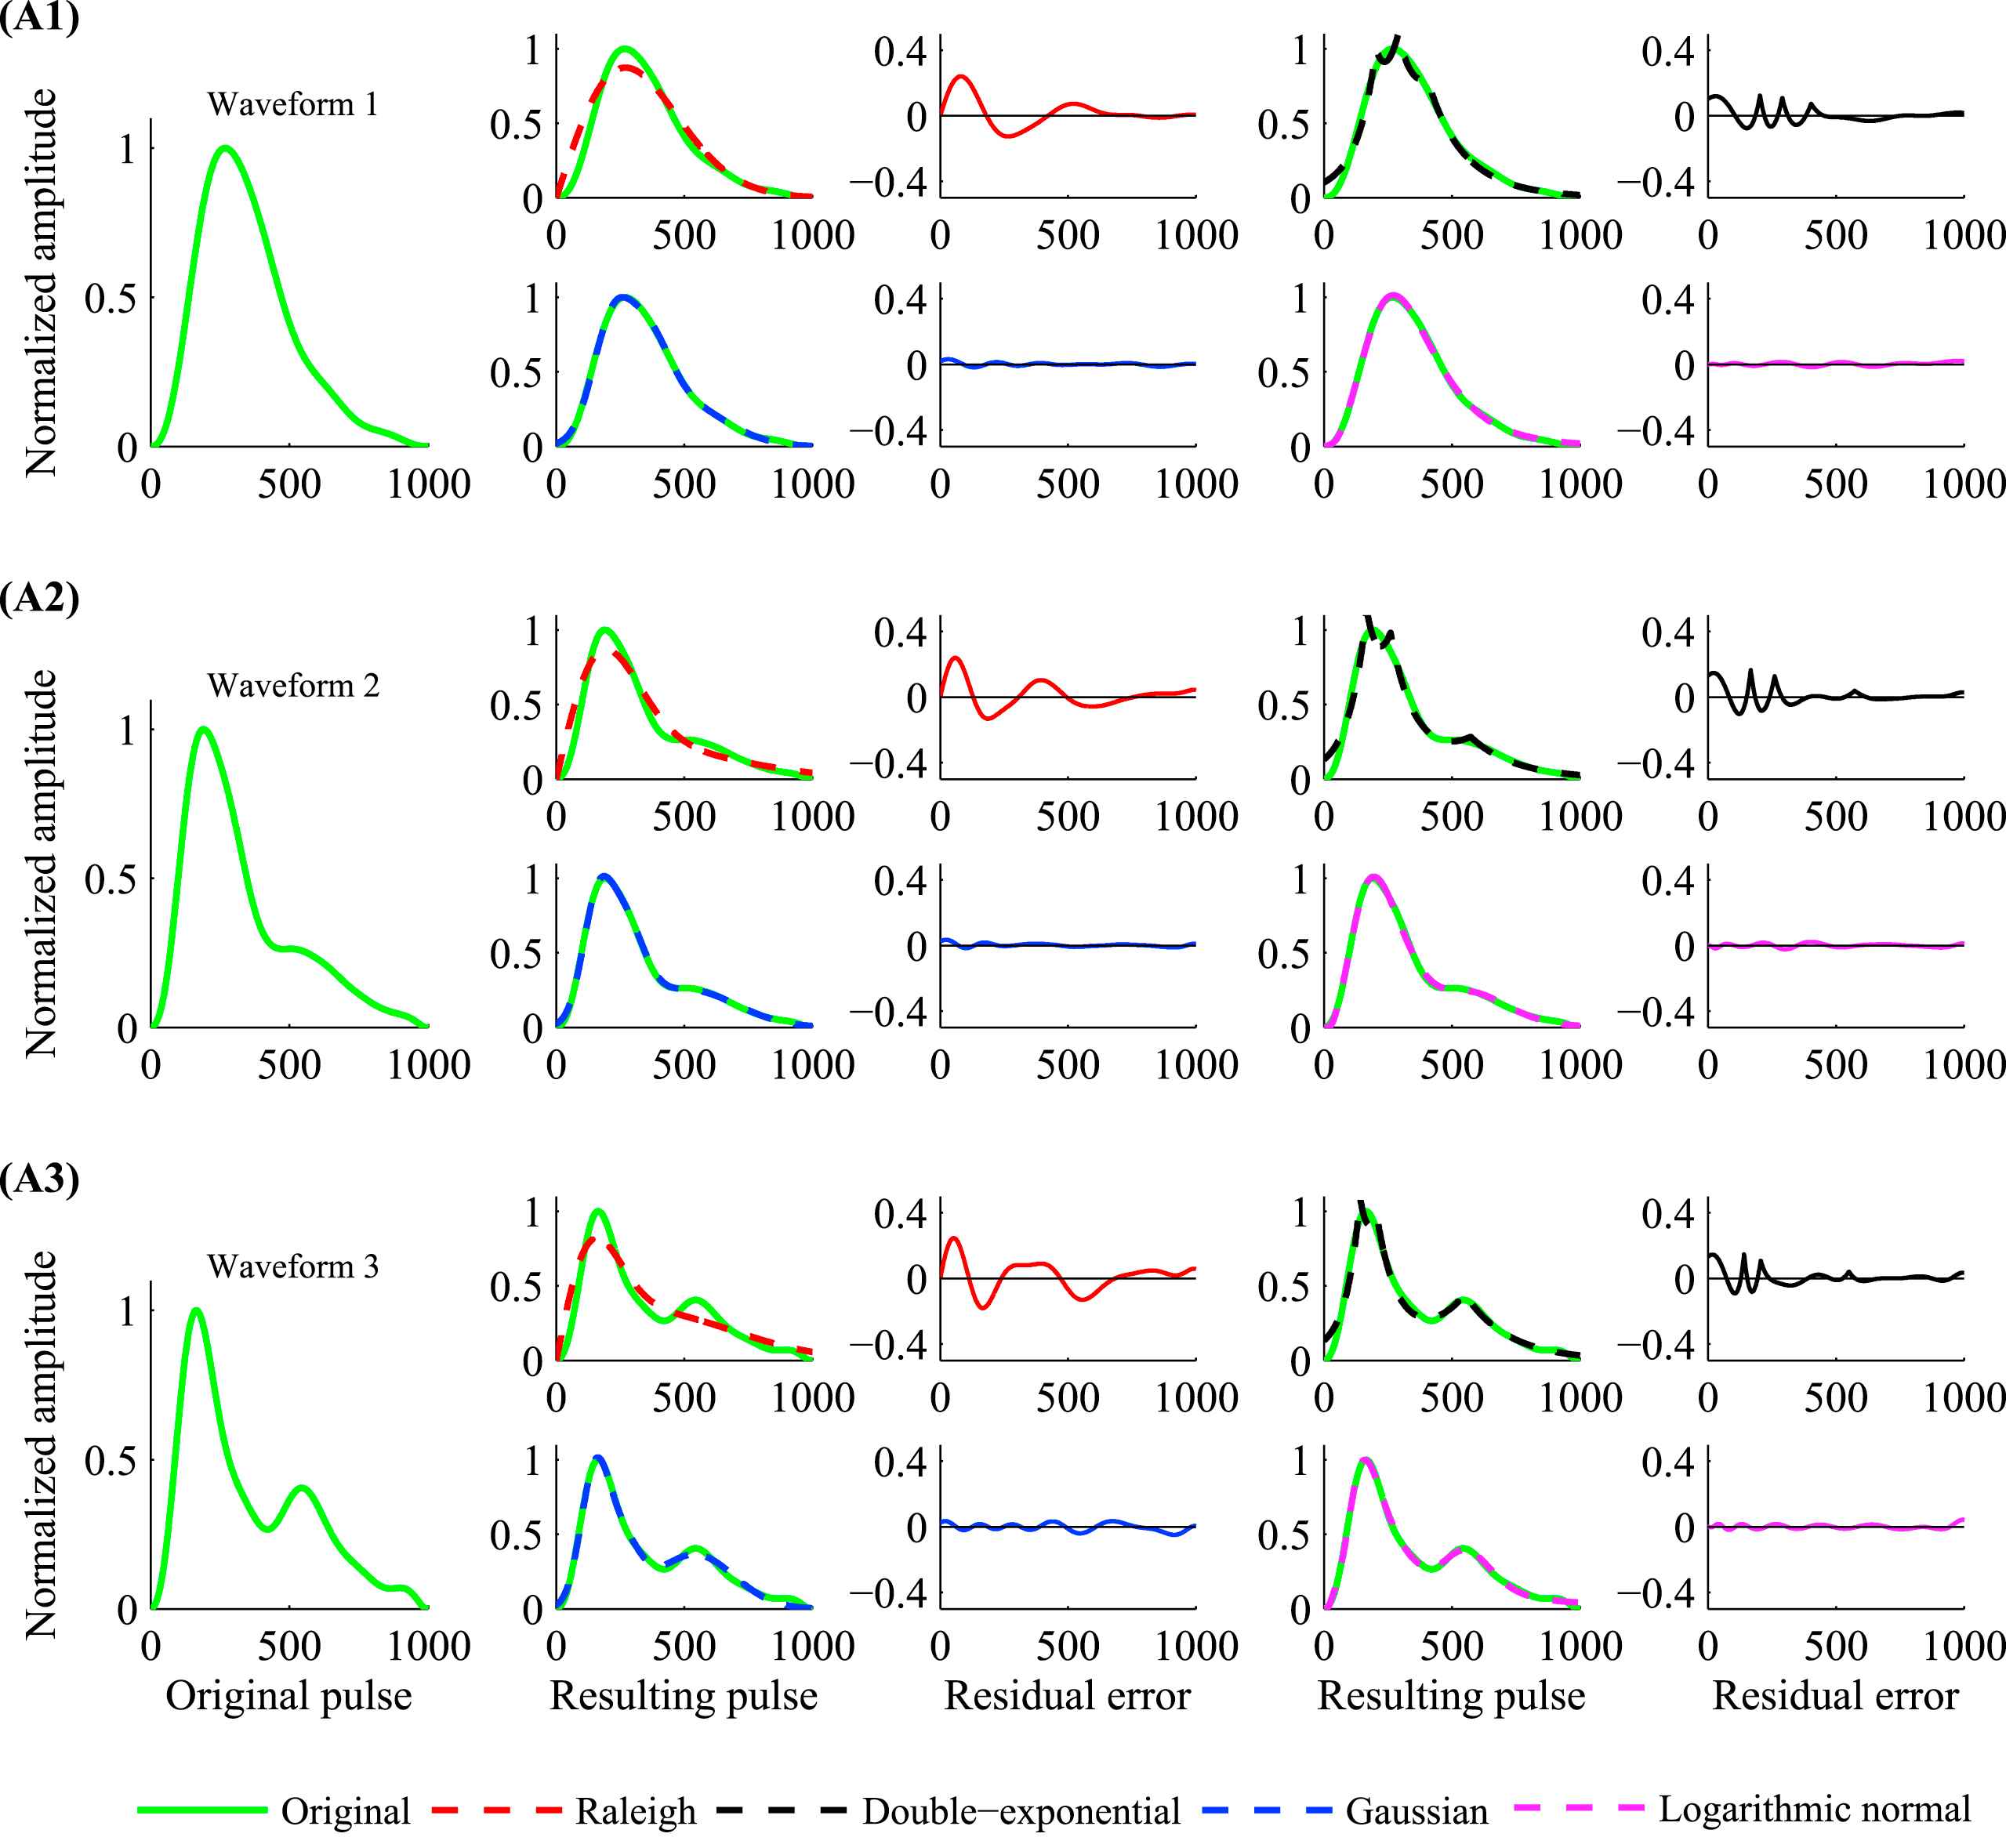
Three APWs with different contours were reconstructed by four fitting functions. On the left side of (A1), (A2) and (A3), the original waveforms are shown. The middle and right panels of (A1), (A2) and (A3) show the fitting results superimposed on the original waveform with the residual error plotted next to the fitting results.
| Original pulse | Raleigh | Double-exponential | Gaussian | Logarithmic normal | ||||
|---|---|---|---|---|---|---|---|---|
| MAPE (%) | Max_R (%) | MAPE (%) | Max_R (%) | MAPE (%) | Max_R (%) | MAPE (%) | Max_R (%) | |
| Waveform 1 | 5.88 | 24.08 | 3.10 | 12.36 | 0.66 | 3.54 | 0.85 | 2.21 |
| Waveform 2 | 6.01 | 23.86 | 3.03 | 16.47 | 0.74 | 3.38 | 0.87 | 2.47 |
| Waveform 3 | 7.39 | 24.53 | 2.72 | 14.65 | 1.87 | 4.94 | 0.99 | 4.23 |
The accuracy of four fitting functions by decomposing three APWs with different contours.
Even though a same collecting site is used, the contours may vary dramatically because of individual difference, different operators, and different sensors, etc. Figure 4 shows the individual results of the means MAPE and Max_R of 24 subjects using the four functions. The result showed there are some differences for different people’s MAPE and Max_R obtained by the same type of function. It is understandable that there are some differences of the accuracy of Gaussian function between our results and Liu’s (MAPE: 2.25% and 1.1%, respectively) for APWs acquired from radial.19,24
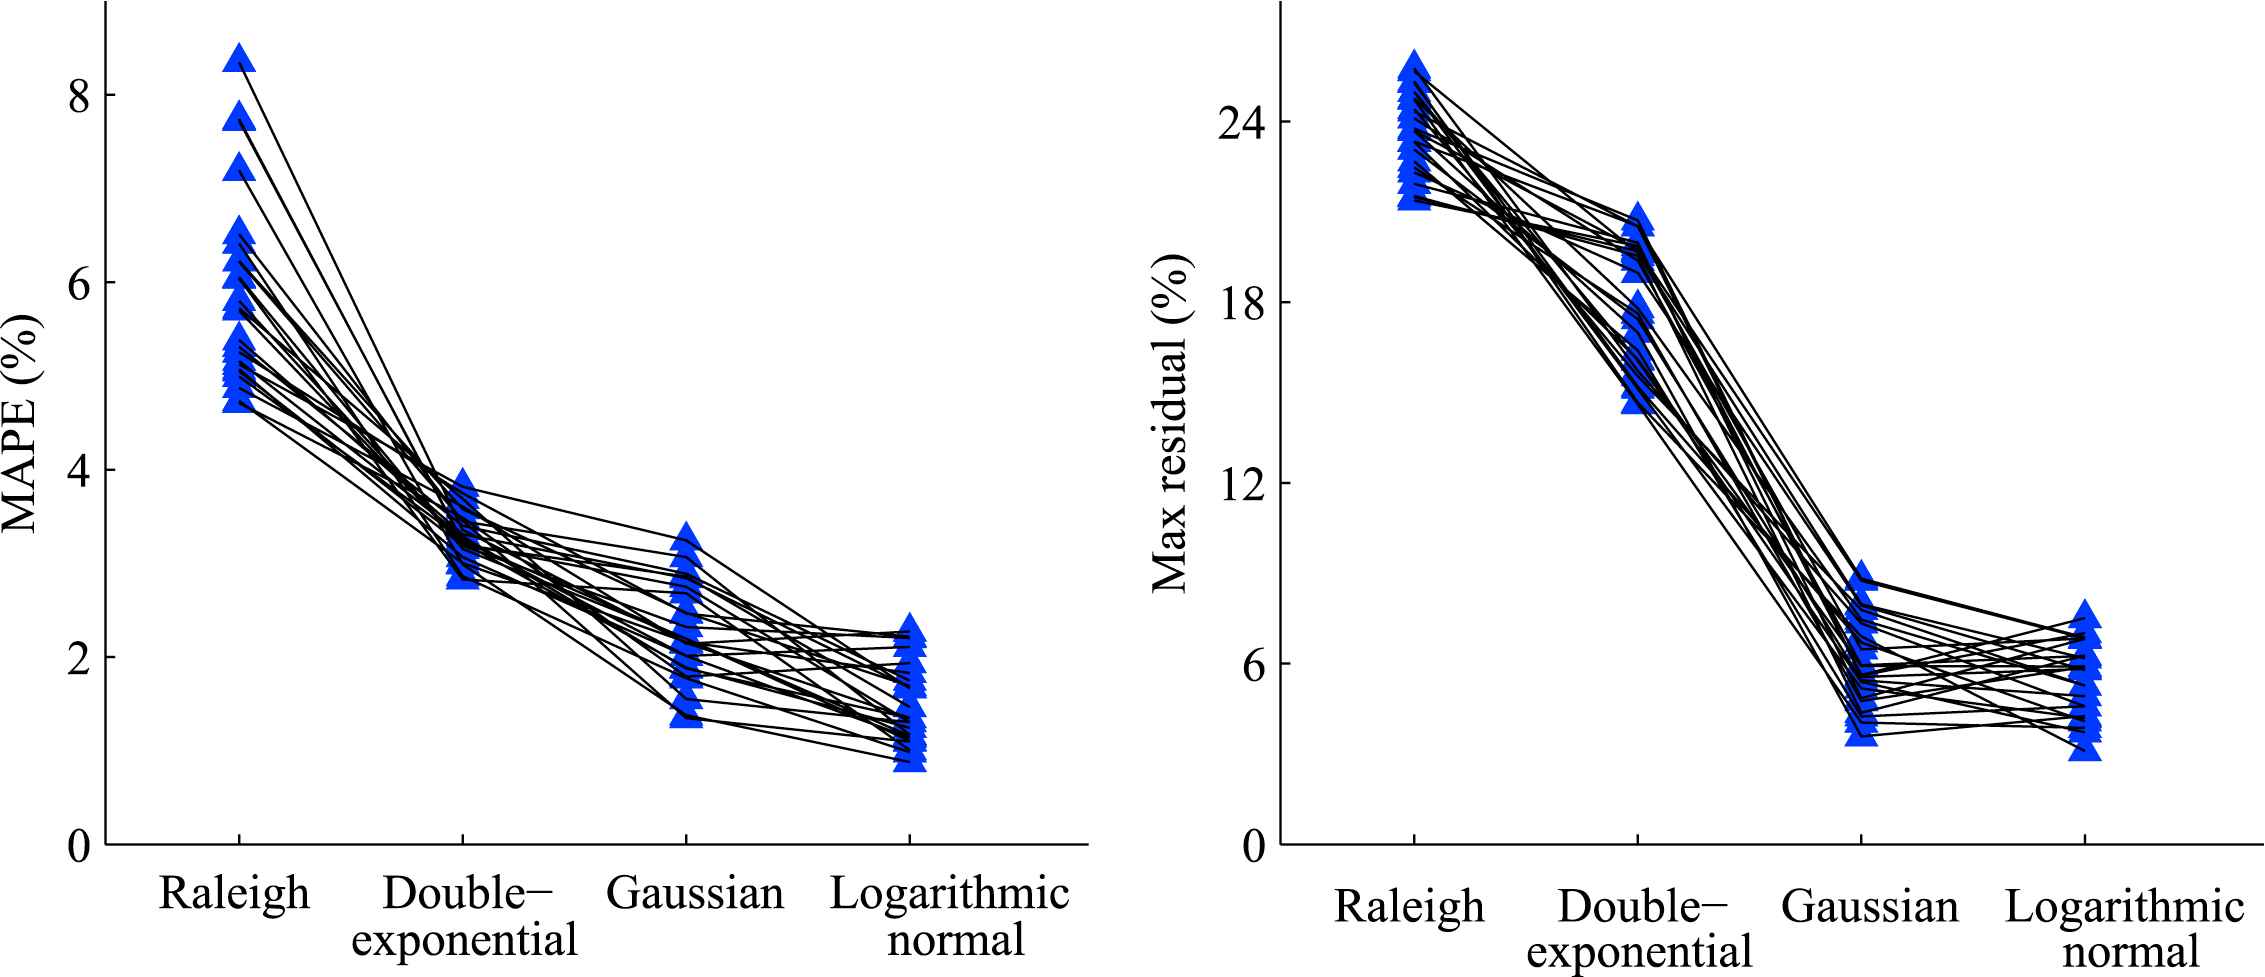
Individual results of the means MAPE and Max_R of the 24 subjects.
One of the limitations of the current study is the relatively small sample size. However, within-subject comparison has been applied to examine the performance across different fitting functions which improves our statistical power. Besides, all participants in this study are healthy without known cardiovascular concerns. Future studies are warranted to further investigate whether the fitting model still works for patients with different cardiovascular diseases. We also note that three realizations of each fitting functions have been applied. This was based on a previous study that used Gaussian functions to model the RAPW and examined the performance of different amounts of realizations.19
In conclusion, we compared the accuracy of four fitting functions, i.e., Raleigh function, double-exponential function, Gaussian function, and logarithmic normal function, to model a same RAPWs data sets. Our results suggest that for modelling RAPWs, Gaussian function and logarithmic normal function could result in better accuracies compared to Raleigh function and double-exponential function.
Conflict of interest statement
The authors declare no conflict of interest.
Acknowledgements
This work was supported by the
References
Cite this article
TY  - JOUR
AU  - Xinge Jiang
AU  - Shoushui Wei
AU  - Jingbo Ji
AU  - Feifei Liu
AU  - Peng Li
AU  - Chengyu Liu
PY  - 2018
DA  - 2018/09/03
TI  - Modeling radial artery pressure waveforms using curve fitting: Comparison of four types of fitting functions
JO  - Artery Research
SP  - 56
EP  - 62
VL  - 23
IS  - C
SN  - 1876-4401
UR  - https://doi.org/10.1016/j.artres.2018.08.003
DO  - 10.1016/j.artres.2018.08.003
ID  - Jiang2018
ER  -