
LDL fatty acids composition as a risk biomarker of cardiovascular disease
- DOI
- 10.1016/j.artres.2017.08.001How to use a DOI?
- Keywords
- Fatty acids; Saturated fatty acids; Mono unsaturated fatty acids; Poly unsaturated fatty acids; LDL; ox-LDL; Coronary artery disease
- Abstract
Objective: Fatty acid composition of Low-density lipoprotein (LDL) particle is an effective factor in LDL oxidation and atherosclerotic plaques formation. This study evaluates the relationship between LDL fatty acid composition and coronary artery disease (CAD).
Methods: 42 men with coronary artery disease (CAD-group) and 40 men without coronary artery disease (non-CAD-group) were selected. LDL fatty acid composition of blood samples was measured by gas chromatography.
Results: Ox-LDL was significantly high in CAD-group. Poly unsaturated fatty acids (PUFA) and PUFA/MUFA (Mono unsaturated fatty acids), linoleic acid and arachidonic acid were significantly higher in CAD-group than in non-CAD-group. In CAD-group, a reverse correlation was observed between oleic acid concentrations and ox-LDL levels and a direct correlation was seen between arachidonic acid concentrations and ox-LDL levels.
Conclusion: Composition of LDL is related to atherosclerosis and CAD. High levels of arachidonic and linoleic acids could increase LDL oxidation and atherosclerotic plaques formation. In addition, LDL arachidonic acid levels could be a better predictor of CAD.
- Copyright
- © 2017 Association for Research into Arterial Structure and Physiology. Published by Elsevier B.V. All rights reserved.
- Open Access
- This is an open access article distributed under the CC BY-NC license.
Introduction
Low-density lipoprotein cholesterol (LDL) oxidation is a basic factor in atherosclerosis1,2 and is affected by both endogenous and exogenous factors.3 LDL fatty acid composition and particle size, antioxidants’ level, phospholipase A2 activity and apoB100 are endogenous factors, which can play a role in LDL oxidation. Among the exogenous factors influencing LDL oxidation, we can refer to cellular peroxidation activity, oxidant, and antioxidant concentrations in extracellular fluid and plasma.4–7 In addition, antioxidants, diets with a high intake of fruit and vegetables, high phenolic compound, statin therapy, and physical activity effects LDL oxidation rate and are able to protect LDL against oxidation.8–10
LDL fatty acid composition is an important factor in the LDL oxidation and formation of atherosclerosis. A high amount of poly unsaturated fatty acids (PUFAs), such as linoleic acid and arachidonic acid in LDL particles, can increase the susceptibility of LDL to oxidation.11 Moreover, conjugated dienes formed during PUFAs oxidation can result in apoB100 modification.12,13 High amounts of saturated (SFAs) and mono unsaturated (MUFAs) fatty acids, such as oleic acid, do not increase the susceptibility of LDL to oxidation.1,2,14 Thus, it can be concluded that peroxidation of PUFAs in LDL particles may produce oxidized LDL (ox-LDL).15 During lipid peroxidation process, unsaturated fatty acids (UFAs) are converted to lipid peroxide by free radicals or enzymatic reactions.16,17 In the initiation phase, a hydrogen atom in a double bound of UFAs is diminished by initiating radicals, and then lipid peroxyl radical is formed rapidly during the addition of oxygen molecules to central carbon radicals. In propagation phase, lipid peroxide is formed during peroxyl lipid’s radical attack on other PUFAs. Then, two peroxyl radicals can react with each other and form a non-radical product in termination phase.16,18 Therefore, during LDL oxidation and hydro peroxides decomposition, aldehydes are produced and apoB100 is chemically and structurally modified.7,13,19
Ox-LDL causes atherosclerosis, coronary artery disease, and cardiovascular disease in various forms, including cytotoxic effect on endothelial cells, chemo attractant effect on monocytes–macrophages, inhibitory effect on nitric oxide releasing, stimulating effect on smooth muscles cells proliferation, inhibitory effect on endothelial cell immigration, and stimulating effect on adhesion and aggregation of platelets. All of these changes can result in the formation of atherosclerotic plaques.10,20,21 Furthermore, formation of antibodies against modified LDL (ox-LDL and modified apoB100) and immune complexes are the key stages in atherosclerosis pathogenesis.22 Ox-LDL, containing modified apoB100, is taken by scavenger receptors on the surface of monocytes–macrophages in sub endothelial spaces. Ox-LDL aggregations in monocytes–macrophages cells convert monocytes–macrophages cells to foam cells. These processes cause initiation of atherosclerotic plaques and formation of injuries in coronary arteries.7,16,23 In vitro condition, copper ions can cause oxidation of lipoproteins so this oxidation of lipoprotein mimics the in vivo conditions of lipid peroxidation.
Because of the increasing trend of cardiovascular mortality, and high prevalence of these diseases in our country, this study was performed to elucidate relationship between LDL fatty acid composition and risk of coronary artery disease (CAD).
Materials and methods
Subjects
In this research, 82 men, aged 40–60, with chest pain and without any CAD risk factors (body mass index (BMI) between 18.5 and 24.9 kg/m2, nonsmoker, normolipidemic, and non-diabetic) were selected with simple sampling method from Cat lab of Chamran hospital, and were divided into two groups of CAD and non-CAD. The exclusion criteria included renal disease, malignant disease, familial hypercholesterolemia, thyroid disease, myocardial infarction or coronary artery bypass grafting (CABG) 6 weeks prior to angiography, alcohol consumption, lipid lowering medication and any kind of drugs interfering with lipid metabolism (such as corticosteroid, tiazid, lipid decreasing drugs).17
Patients with at least 70% stenosis in one or more major epicardial arteries were selected as CAD group (n = 42), and subjects with no evidences for stenosis in their major coronary arteries were considered as members of the non-CAD group (n = 40).
Demographic information about lifestyle, medication, and family history were acquired through interviews with subjects, and they signed the informal consent form. The Ethics Committee of Isfahan Cardiovascular Research Center approved this research.
Measurement of clinical and anthropometric factors
At first, for each subject, a questionnaire was completed. Anthropometric factors such as weight and height were measured without shoes, in light clothes and by seca scale, and waist and hip circumferences were measured by a tape measure. Using a sphygmomanometer, systolic and diastolic blood pressures (clinical factors) were measured three times for each patient. BMI was calculated according to weight (kg)/height2 (m2) formula and waist–hip ratio (WHR) was also calculated.20
Blood sampling and biochemical measurement
12–14 h fasting blood samples were taken to measure serum levels of fasting blood sugar (FBS/FBG), total cholesterol (T.C), triglyceride (TG), high density lipoprotein cholesterol (HDL), LDL, and etc. Automated enzymatic assay by Pars Azmoon kits (Tehran, Iran) and auto-analyzer Hitachi 902 (Hitachi, Tokyo, Japan) and special kits (Diagnosis Inc., Holzheim, Germany) was utilized to assess the mentioned factors.
Serum ox-LDL concentration was measured using a competitive ELISA kit (Mercodia, Uppsala, Sweden). The intra- and inter-assay coefficients of variation (CV) were 6.7% and 7.0%, respectively. Data were expressed as unite per liters (U/L).
Isolation of LDL
A very fast ultracentrifugation method was used to isolate the plasma LDL. Plasma solutions (2.8 ml) and 6.6 ml A Solution (containing 11.4 g NaCl, 0.1 g Na2-EDTA, 1 cc NaOH total volume = 1003 cc, d = 1.006 g/ml) were added to centrifugation tubes (at an 1 to 2 ratio) and a discontinuous density gradient was acquired. The ultracentrifugation of plasma was done in Beckman Coulter Optima L-100XP (Fullerton, California) equipped with a 90 Ti fixed angle rotor, at 307,897 g for 6 h at 16 °C. After this stage, VLDL (a white band at the supernatant) and the upper layer of solution were isolated and residual content was mixed with B solution (containing 24.8 g NaBr + 100 cc A solution). This mixed solution was ultra-centrifuged at 307,897 g for 12 h at 16 °C. After centrifugation, LDL (a yellow-orange band at the supernatant) was collected and dialyzed in a glass suction apparatus filled with phosphate buffer (21.1 mM Na2HPO4 + 17.7 NaH2PO4 + 160 mM NaCl, pH = 7.4) in darkness at 4 °C.20 Protein concentrations of the LDL samples were determined by the Lowry et al. method.19
Electrophoresis
To assess the LDL purity acquired from isolating LDL by ultracentrifugation of plasma, agarose electrophoresis method was used. LDL electrophoresis was carried out in barbital buffer (0.05 M) at 90 V for 150 min. Upon finishing electrophoresis and cutting the electric current, LDL was fixed in the solution of methanol: water: glacial acid (6:3:1), and it was stained by the solution of 0.1% FatRed-7B in methanol (mixed with 0.1 N NaOH before usage).23 The single band of separated LDL (by ultra-centrifuging) showed the purity of isolated LDL (Fig. 2).

The agarose electrophoresis of native LDL. The single band of LDL indicates purity of LDL.
Lipid extraction
Lipids of LDL were extracted by Folch method.24,25 100 μg Heptadecanoic acid per 100 μl Methanol solution and 500 μg butylated hydroxyl toluene (dissolved in 50 μl hexane) – as antioxidant – were added to 1 ml of LDL samples. Lipids of LDLs were extracted by chloroform/methanol (2:1 v/v) in three phases and then extracted solution was dehydrated using sodium sulphate (Na2SO4) and dried by nitrogen in room temperature.25–27
Fatty acids were esterified with 1 ml of bromotrifluride–-methanol regent (BF3/methanol, 14% BoronTrifluride) and 0.5 ml Toluene in glass tube with Teflon-lined caps at 90 °C for 120 min. Upon the addition of 2 ml H2O, fatty acid methyl esters (FAMEs) were isolated in three phases by adding hexane, and they were concentrated and dried under nitrogen.
Gas chromatography
FAMEs were dissolved in 500 μl methylene/chloride and then analyses of GC were carried out on Younglin 6000 series GC system, equipped with a flame ionization detector (FID). Separation of FAMEs was performed on a capillary column (TR-CN, 60 m × 0.25 mm i.d). The injector and detector temperatures were kept at 240 °C and 250 °C, respectively. In the temperature program, initial temperature was set at 125 °C (7 min), and then the temperature was increased to 245 °C.
Samples’ methyl esters peak identities were determined by comparison of their relative retention times with those of the well-known FAME standards (Supelco™, Figs. 3 and 4). The FAME mixture in LDL structure included meristic acid methyl ester, Palmitoleic acid methyl ester, Heptadecanoic acid, stearic methyl ester, Linoleic acid methyl ester isomer mix, Linoleic acid conjugated methyl ester, Linoleic acid methyl ester isomer mix, Arachidonic acid methyl ester, and Oleic acid methyl ester.
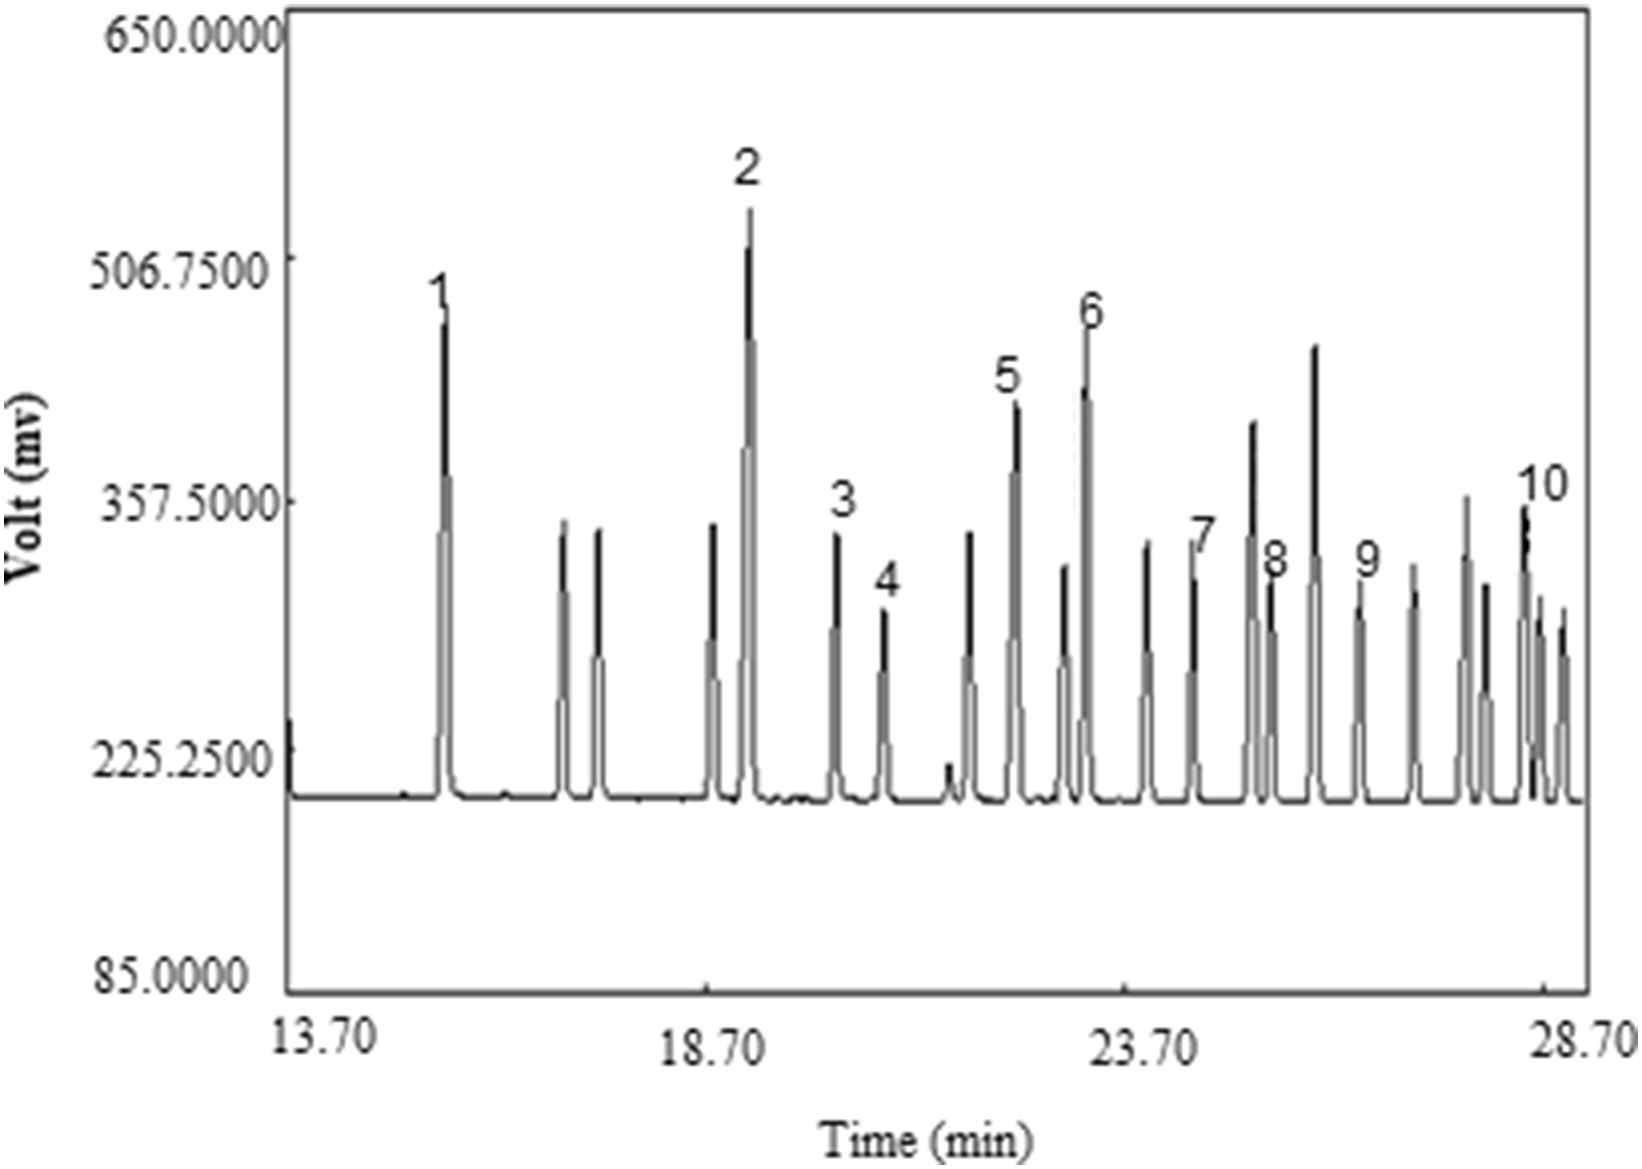
GC chromatogram of FAEMs standard (Supelco™). Peak identification: (1) Meristic acid methyl ester, (2) Palmitic acid methyl ester, (3) Palmitoleic acid methyl ester, (4) Heptadecanoic acid methyl ester, (5) stearic acid methyl ester, (6) Elaidic acid methyl ester, (7) Oleic acid methyl ester, (8) Linoleic acid methyl ester, (9) Arachidic acid methyl ester, (10) Linolenic acid methyl ester.
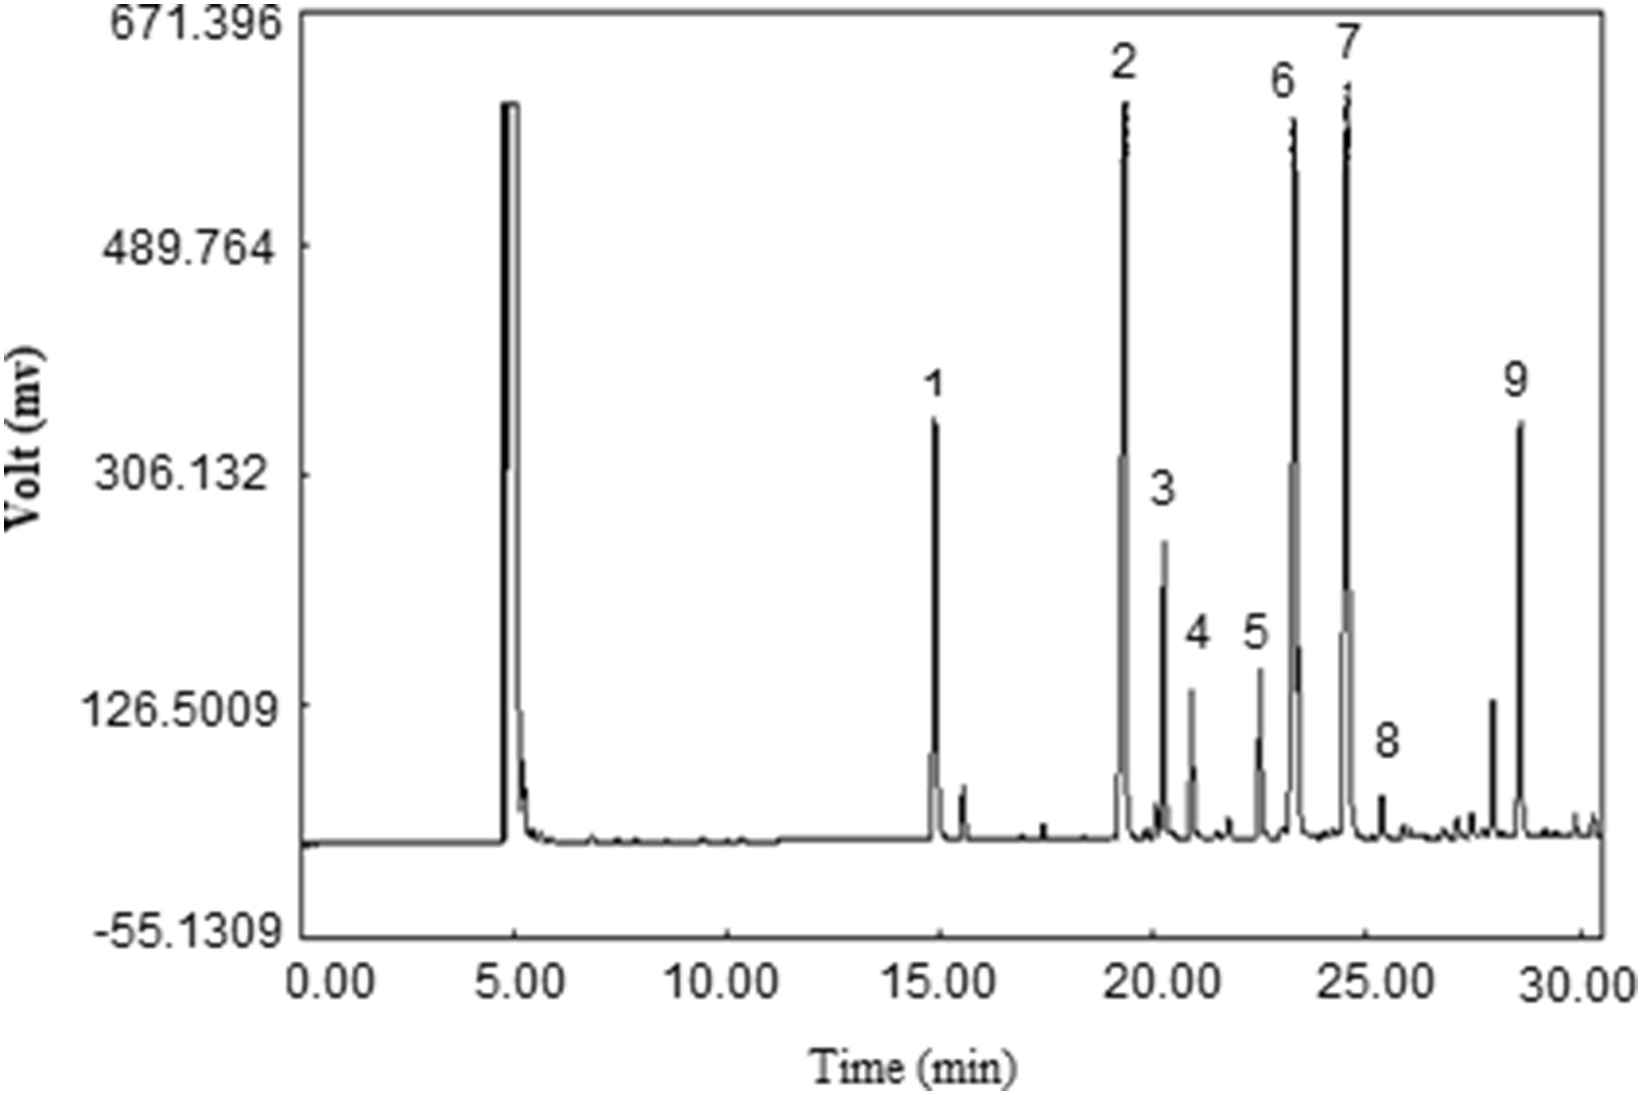
GC chromatogram of methyl esters of fatty acids of LDL samples of non-CAD group. Peak identification: (1) Meristic acid methyl ester, (2) Palmitic acid methyl ester, (3) Palmitoleic acid methyl ester, (4) Heptadecanoic acid methyl ester, (5) stearic acid methyl ester, (6) Oleic acid methyl ester, (7) Linoleic acid methyl ester, (8) Arachidic acid methyl ester, (9) Arachidonic acid methyl ester.
LDL oxidation
Susceptibility of LDL to oxidation can be measured through the application of copper oxidized ions (Cu2+), in vitro. Plasma acquired LDL (which was affected by the various factors in vivo) was put near CuSO4 and its susceptibility to oxidation was measured. LDL (150 μg protein/L) was incubated with 250 μl of CuSO4 (5 μmol) and 835 μl of PBS in the spectrophotometer cuvette, for 5 h at room temperature. The kinetic of conjugated dienes formation was monitored continuously for the changes in the 234-nm absorbance by Shimadzu UV-3100 (Tokyo, Japan). The LDL oxidation absorbance was recorded every 10 min. The sigmoid cure of LDL oxidation was plotted against time and divided into three phases: lag phase, propagation phase, and decomposition phase. The lag time was calculated by the oxidation curve.20,21
Statistical analyses
We analyzed the data driven from biochemical factors and LDL fatty acids using SPSS 15.5 (IBM Statistical Package). Data have been shown as mean ± standard deviation. Independent sample T tests were used for the comparison of biochemical factors and LDL fatty acid concentrations between CAD and non-CAD groups. Pearson’s rank correlation coefficient test was used to compare the correlation between biochemical factors and LDL fatty acids in CAD and non-CAD groups.
Results
CAD and non-CAD groups were not significantly different in BMI, waist circumference, waist–hip ratio, and systolic and diastolic blood pressure (Table 1).
| Characteristics | CAD group (n=42) | Non-CAD group (n=40) | p-Value |
|---|---|---|---|
| Age (years) | 50.6 ± 7.2 | 49 ± 6.6 | 0.3 |
| Body mass index (kg/m2) | 24.34 ± 3.2 | 24.3 ± 4 | 0.9 |
| Waist (cm) | 94.3 ± 9.7 | 93.3 ± 11.5 | 0.65 |
| Waist/hip | 0.93 ± 0.06 | 0.91 ± 0.06 | 0.15 |
| Systolic blood pressure | 113.6 ± 13.5 | 119.7 ± 15.9 | 0.66 |
| Diastolic blood pressure | 70.34 ± 7.8 | 71.6 ± 6.06 | 0.14 |
The anthropometric characteristics (mean ± SD) of CAD and Non-CAD group.
Mean values (±SD) of serum biochemical factors have been shown in Fig. 1. Mean values (±SD) of LDL fatty acids have been shown in Table 2. Among biochemical factors, only ox-LDL was significantly higher in CAD than non-CAD group (p < 0.05). Results of independent sample T test showed more Linoleic (p < 0.05) and Arachidonic (p < 0.001) acids and PUFA concentrations (p < 0.001) in CAD subjects in comparison to non-CAD group; Moreover, PUFA to MUFA ratio was higher (p < 0.05) in CAD subjects than non-CAD ones.
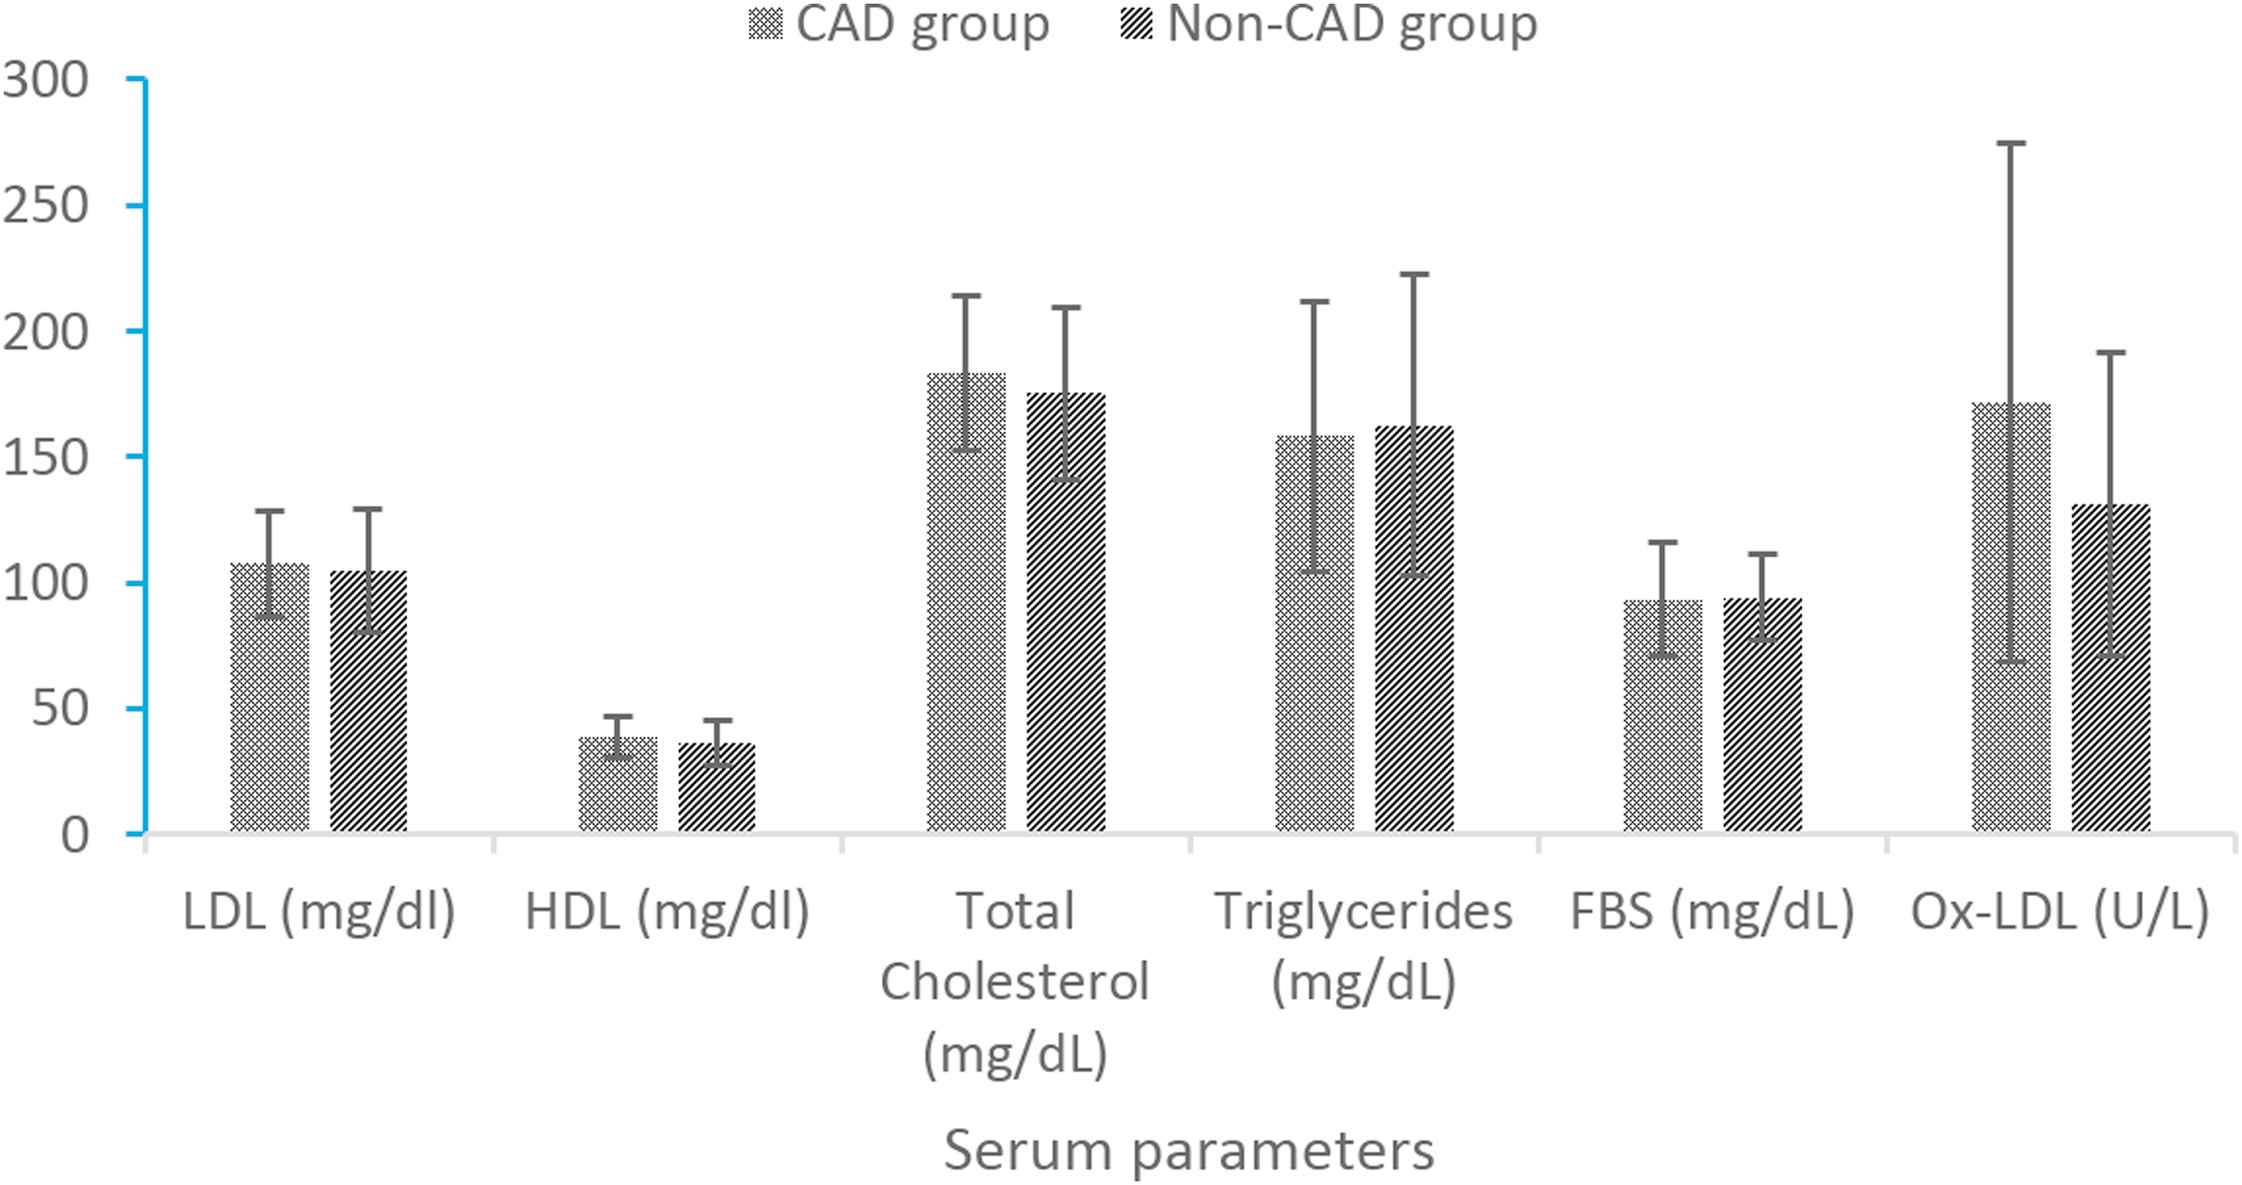
Comparison of serum biochemical factors values between CAD and non-CAD groups. *p value of independent t test. **p value less than 0.05 is significant. †p value less than 0.001 is significant.
| Parameter | CAD group (n=42) | Non-CAD group (n=40) | p* | |
|---|---|---|---|---|
| Myristic acid (μg/mL) | C14:0 | 20 ± 3.8 | 20.5 ± 5.3 | 0.63 |
| Palmitic acid (μg/mL) | C16:0 | 201.7 ± 37.2 | 203.9 ± 26 | 0.72 |
| Palmitoleic acid (μg/mL) | C16:1 | 20 ± 6.9 | 21.3 ± 8.1 | 0.45 |
| Stearic acid (μg/mL) | C18:0 | 47.9 ± 13.8 | 49.3 ± 12.3 | 0.63 |
| Oleic acid (μg/mL) | C18:1 | 181.6 ± 33.9 | 177.9 ± 31 | 0.61 |
| Linoleic acid (μg/mL) | C18:2 | 286.4 ± 101.4 | 235.1 ± 44.6 | 0.005** |
| Arachidonic acid (μg/mL) | C20:4 | 99.5 ± 18.9 | 80.4 ± 18.8 | 0.001† |
| PUFA | 385.9 ± 109.4 | 315.6 ± 47.5 | 0.001† | |
| SFA | 269.8 ± 41.4 | 273.8 ± 28 | 0.61 | |
| MUFA | 201.6 ± 33.6 | 199.2 ± 33.3 | 0.74 | |
| PUFA/MUFA | 1.96 ± 0.76 | 1.6 ± 0.33 | 0.005** |
p value of independent t test.
p value less than 0.05 is significant.
p value less than 0.001 is significant.
Comparison of LDL fatty acids composition mean values between CAD and non-CAD groups.
Based on the data presented in Table 3, in CAD group, ox-LDL level had indirect correlation with oleic acid concentration (r = −0.36, p < 0.05) and direct correlation with arachidonic acid level (r = 0.41, p < 0.05). For non-CAD group, the total amount of dienes showed direct correlations with Linoleic acid (r = 0.8), PUFA (r = 0.78) and PUFA/MUFA (r = 0.56). Furthermore, Linoleic acid (r = 0.68), PUFA (r = 0.67) and PUFA/MUFA ratio (r = 0.46) were significantly correlated with propagation rate (p < 0.05). In CAD group, reverse correlation was found between Arachidonic acid and lag time (r = −0.41, p < 0.001).
| Fatty acids | LDL | HDL | T.C | TG | FBS | Ox-LDL | Lag time | Maximal dienes | Propagation rate |
|---|---|---|---|---|---|---|---|---|---|
| Non-CAD group | |||||||||
| Myristic acid | −0.02 | 0.11 | −0.03 | 0.005 | −0.12 | −0.09 | 0.25 | −0.05 | −0.15 |
| Palmitic acid | −0.16 | 0.2 | −0.13 | 0.35 | −0.19 | 0.16 | 0.24 | 0.27 | 0.17 |
| Palmitoleic acid | −0.18 | 0.15 | −0.13 | 0.06 | 0.09 | −0.12 | 0.01 | −0.004 | 0.16 |
| Stearic acid | −0.17 | −0.12 | −0.18 | −0.04 | −0.17 | −0.1 | −0.1 | −0.05 | 0.13 |
| Oleic acid | 0.29 | 0.07 | 0.24 | 0.27 | −0.02 | −0.36* | 0.01 | 0.13 | −0.05 |
| Linoleic acid | 0.15 | −0.18 | 0.09 | 0.04 | −0.13 | −0.16 | 0.18 | 0.21 | −0.23 |
| Arachidonic acid | −0.03 | 0.11 | 0.02 | −0.01 | 0.04 | 0.11 | −0.26 | −0.06 | −0.05 |
| PUFA | 0.13 | −0.12 | 0.09 | 0.04 | −0.11 | −0.1 | −0.002 | −0.22 | −0.21 |
| SFA | −0.23 | −0.23 | −0.21 | −0.34 | −0.28 | 0.08 | 0.22 | 0.22 | 0.21 |
| PUFA/MUFA | −0.14 | −0.23 | −0.19 | −0.21 | −0.04 | 0.05 | −0.02 | −0.25 | −0.33 |
| CAD group | |||||||||
| Myristic acid | 0.02 | 0.16 | 0.09 | −0.12 | −0.07 | −0.2 | −0.02 | 0.06 | 0.15 |
| Palmitic acid | −0.01 | −0.08 | −0.03 | 0.03 | −0.16 | 0.05 | −0.04 | 0.18 | 0.08 |
| Palmitoleic acid | −0.03 | −0.21 | 0.11 | 0.18 | −0.03 | 0.29 | 0.1 | −0.09 | 0.02 |
| Stearic acid | 0.24 | 0.12 | 0.26 | 0.36 | 0.24 | −0.1 | −−0.12 | 0.13 | 0.12 |
| Oleic acid | 0.24 | 0.01 | −0.001 | −0.04 | −0.02 | −0.07 | −0.27 | 0.22 | 0.19 |
| Linoleic acid | −0.08 | −0.05 | −0.04 | 0.03 | −0.15 | −0.15 | −0.06 | 0.8* | 0.68* |
| Arachidonic acid | 0.12 | 0.13 | 0.15 | −0.07 | −0.08 | 0.41* | −0.41** | 0.28 | 0.21 |
| PUFA | −0.05 | −0..02 | −0.01 | 0.01 | −0.15 | −0.19 | −0.1 | 0.78* | 0.67* |
| SFA | 0.1 | −0.02 | 0.11 | 0.14 | −0.07 | −0.002 | −0.08 | 0.22 | 0.13 |
| PUFA/MUFA | −0.04 | 0.04 | −0.01 | −0.03 | −0.13 | −0.13 | 0.09 | 0.56* | 0.46* |
p value less than 0.05 is significant.
p value less than 0.001 is significant.
Correlation between serum LDL fatty acids composition concentrations and biochemical factors and LDL oxidation.
Results of binary Logistic regression analysis showed that Arachidonic acid (Odd Ratio = 1.06, p < 0.0025) and ox-LDL (Odd Ratio = 1.008, p < 0.03) had the biggest relationships with CAD, but Linoleic acid (Odd Ratio = 0.99, p < 0.2) did not have any correlation with CAD (Table 4).
Discussion
The aim of this study was to determine the relationship between fatty acids composition of LDL and the risk of coronary artery disease. Result showed that in CAD group, total cholesterol and LDL concentrations were higher than non-CAD group, but these levels were not statistically significant. Jun-Jun et al. results were similar to our findings.28 However, Walldius and Junger showed that LDL concentration in patients with CAD and without CAD was significantly different.29 In fact, LDL concentration increasing caused ox-LDL level heightening. Consequently, risk of atherosclerosis will rise. Nevertheless, LDL as a pre-atherosclerotic factor strongly cannot predict atherosclerosis risk.
In patients with coronary artery disease, serum level of ox-LDL was significantly more than healthy controls. In the other studies such as Nordin, Shimada, Halvoet and Meising studies, results were similar. Meising et al., in 2005 reported that ox-LDL concentration is a predictor factor for CAD. As contrast, Tsimikas et al.’ study showed no significant difference between CAD ox-LDL concentrations and non-CAD groups.30–34 Based on literature data high levels of ox-LDL in serum can take modified LDL by monocytes–macrophages and cause fatty streaks and atherosclerotic plaques formation.2 One of the effective factors, which cause LDL oxidation, is LDL fatty acids composition. Based on the results of current study saturated and unsaturated fatty acids levels were different between CAD and non-CAD groups. Therefore, investigation and measurement of PUFAs could be one of the good predictor factor for CAD causation.
In this study, in-patient with coronary artery disease, high level of arachidonic acid was correlated with high ox-LDL concentration. On the other hand, in non-CAD group level of oleic acid correlated with low ox-LDL concentration. Additional studies reported that amounts of 18:2 (PUFAs) and 18:1 (MUFAs) were the essential factors in LDL oxidation and amounts of 18:2 (PUFAs) was directly correlated with LDL oxidation. High levels of arachidonic acid increased ox-LDL formation and high levels of oleic acid reduced ox-LDL formation. However, the 18:1/18:2 (MUFAs/PUFAs) ratio was reversely correlated with ox-LDL level.2,35,36
In CAD group, arachidonic acid had a reverse correlation with lag time. This means that high levels of this fatty acid increase risk of LDL oxidation and increase ox-LDL formation. In Hargrove et al. study the reverse correlation was observed between serum level of arachidonic acid and lag time. They reported that LDL rich in linoleic acid was more susceptible to oxidation than oleic acid-rich LDL.2 In Mirnova et al. study LDL with high amount of PUFAs in diabetic patients was more susceptible to oxidation than LDL in healthy group.22
Indeed Phospholipid molecules containing arachidonic acid are on the surface of LDL particle whilst esterified cholesterol molecules contained linoleic acid are in the centre of LDL particle. Consequently, oxidant factors are more effective on arachidonic acid than linoleic acid, and oxidation of this fatty acid occur faster than oxidation of linoleic acid.37,38 Results of this study were confirmed with other studies.39–41 Similarly, in Hargrove et al. study, linoleic acid amount and 18:2/18:1 ratio (PUFAs/MUFAs) were correlated with propagation rate. Results of these studies showed that high levels of PUFAs especially linoleic acid caused oxidation of LDL and formation of high levels of conjugated dienes.2
In this study, we found that Arachidonic acid had the most efficiency on CAD. Subsequently, enhancement of 1 μg/ml arachidonic acid in serum LDL, increased the risk of CAD by 6% (Odd Ratio = 1.06, p < 0.0025). Furthermore, enhancement of 1 U/L ox-LDL increased the risk of CAD by 0.8% (Odd Ratio = 1.008, p < 0.03). On the whole, In this study in CAD group, direct correlation was observed between linoleic amount, PUFAs, PUFAs/MUFAs and conjugated dienes (compounds with two double bonds separated by a single bound, more stable than non-conjugated dienes) formed during LDL oxidation and propagation rate.
Among the mentioned weakness, the following can be presented as an instance:
- 1)
Lack of information about nutrition lifestyle of participants.
- 2)
Lack of large sample size.
- 3)
Lack of triple measurement duo to low sample volume.
In conclusion, we found that LDL different content of fatty acid was related to oxLDL formation. In fact poly unsaturated fatty acids such as linolenic and arachidonic acid increased risk of LDL oxidation. Therefore, PUFAs, PUFAs/MUFAs, and arachidonic acid played an important role in causation of atherosclerosis and CAD and we can use it as a stronger predictor for CAD. Moreover, we suggest that, balance of fatty acids intake (SFAs and UFAs) in the accurate proportions could be a preventive factor in LDL oxidation and oxLDL formation.
Conflict of interests
The authors declared no competing interests.
Funding/Support
None.
References
Cite this article
TY  - JOUR
AU  - Hashem Nayeri
AU  - Gholam Ali Naderi
AU  - Sedigheh Asgari
AU  - Masoumeh Sadeghi
AU  - Maryam Boshtam
AU  - Samaneh Mohamadzadeh
AU  - Nasim Babaknejad
PY  - 2017
DA  - 2017/09/01
TI  - LDL fatty acids composition as a risk biomarker of cardiovascular disease
JO  - Artery Research
SP  - 1
EP  - 7
VL  - 20
IS  - C
SN  - 1876-4401
UR  - https://doi.org/10.1016/j.artres.2017.08.001
DO  - 10.1016/j.artres.2017.08.001
ID  - Nayeri2017
ER  -