
Effects of dietary modification with weight loss on central blood pressure during oral glucose tolerance test in overweight/obese men
- DOI
- 10.1016/j.artres.2017.10.199How to use a DOI?
- Keywords
- Excess weight; Energy restriction; Weight reduction; Glucose challenge; Insulin sensitivity; Aortic pressure
- Abstract
Background: Postprandial regulation of central systolic blood pressure (cSBP) is impaired by obesity-related disorders. The present study aimed to examine the effect of hypocaloric diet intervention on cSBP when performing oral glucose tolerance test (OGTT) in overweight/obese men and explore its mechanism.
Methods: Fifteen overweight/obese men (mean ± SD; age, 52 ± 10 years; BMI, 29.1 ± 2.3 kg/m2) completed a 12-week dietary modification program (group lectures and individual counseling conducted 8 times in 12 weeks, 1680 kcal/day). Before and after the program, body mass, daily intakes of total energy and major macronutrients, serum lipid profiles, and homeostasis model assessment for insulin resistance (HOMA-IR) were measured, and plasma glucose, serum insulin, and cSBP (i.e., radial second systolic pressure) were assessed when fasting and at 60 min and 120 min after 75 g oral glucose loading.
Results: The 12-week program led to successful weight loss (−10.1 kg or −12.1%) with significant reductions in the daily intakes of total energy and major macronutrients. Consequently, low-density lipoprotein cholesterol, triglycerides, HOMA-IR (2.1 ± 1.3 to 0.8 ± 0.3, p < 0.01), and glucose and insulin during OGTT were substantially decreased after 12 weeks. The diet program had also resulted in significantly reduced 2-h averaged cSBP during OGTT (111 ± 11 to 103 ± 10 mmHg, p < 0.01). There was a significant correlation between the changes from baseline in both HOMA-IR and 2-h averaged cSBP (rs = 0.69, p < 0.01).
Conclusions: The current results suggest that the dietary modification–induced improvement in insulin resistance has contributed to a significant reduction in cSBP during OGTT in overweight/obese men.
- Copyright
- © 2017 Association for Research into Arterial Structure and Physiology. Published by Elsevier B.V. All rights reserved.
- Open Access
- This is an open access article distributed under the CC BY-NC license.
Introduction
Central (aortic) systolic blood pressure (cSBP) predicts the possibility of developing cardiovascular disease and reflects current pathological conditions more strongly than peripheral (brachial) systolic blood pressure.1,2 An increase in the cSBP causes elevations in left ventricular afterload and myocardial oxygen consumption.3 High blood pressure is associated with excess body mass, and thus, weight control is recommended to reduce cardiovascular risk in the overweight/obese population.4 Our group has previously reported that cSBP (at fasting state) in overweight/obese men decreased after weight loss (approximately −12 kg or −14%), induced by a 12-week intervention that includes dietary modification and exercise training.5,6 In addition, we have suggested that an exercise training–induced increase in male sex hormone (i.e., testosterone) may contribute to a decrease in cSBP in overweight/obese men.6,7 However, it is still unclear whether a dietary modification program without exercise training decreases cSBP (at fasting or postprandial state) in overweight/obese men, and its mechanism if it does so.
The cSBP has a circadian rhythm,8 and the significance of 24-h cSBP monitoring has been recognized in recent years.9–11 In addition, several studies12–15 have suggested that postprandial cSBP was higher in patients with obesity-related comorbidities such as insulin resistance, metabolic syndrome, and type 2 diabetes mellitus than in control subjects, raising the clinical importance of postprandial cSBP management. However, currently, no effective intervention to improve postprandial cSBP regulation has been reported. Therefore, the present study investigates the effects of a 12-week dietary modification program (nutritionally well-balanced hypocaloric diet) on cSBP when fasting and performing oral glucose tolerance test (OGTT) in overweight/obese men and explores a potential mechanism for the reduction of cSBP during OGTT, which is hypothesized to occur after the diet program.
Methods
Participants
Participants were recruited through local newspaper advertisements. The inclusion criteria were as follows: (a) men; (b) 30–64 years old; (c) body mass index (BMI) ≥25 kg/m2. The exclusion criteria were as follows: (a) presence or history of cardio/cerebrovascular disease (assessed via a medical history questionnaire). Initially, 19 men were enrolled in this study, but four were subsequently excluded due to a lack of data (n = 2, dropped out; n = 1, failure of schedule adjustment; and n = 1, difficulty in blood sampling). Overall, 15 overweight/obese men were analyzed. All procedures were reviewed and approved by the ethics committee of the University of Tsukuba (No. 26-118) and conformed to the principles of the Declaration of Helsinki. All participants gave written informed consent prior to participation.
In accordance with the World Health Organization’s international classification, participants with a BMI of ≥25.0 kg/m2 were classified as overweight/obese. Metabolic syndrome was identified based on the presence of at least three of the following five criteria16: (i) waist circumference ≥90 cm; (ii) triglycerides ≥150 mg/dL and/or drug treatment for elevated triglycerides; (iii) high-density lipoprotein (HDL) cholesterol <40 mg/dL and/or drug treatment for reduced HDL cholesterol; (iv) blood pressure ≥130/85 mmHg and/or antihypertensive drug treatment in a patient with a history of hypertension; and (v) fasting glucose level ≥100 mg/dL and/or drug treatment of elevated glucose.
Dietary modification program
The participants took part in a 12-week dietary modification program (90 min per session, 8 times in 12 weeks) consisting of both group lectures and individual counseling sessions by trained staff. Similar to our previous studies,5–7,17–19 the participants were instructed on switching to a nutritionally well-balanced hypocaloric diet. The diet program was based on the four-food-group point method20 and aimed to limit the total energy intake of participants up to 1680 kcal (21 points; 1 point = 80 kcal) per day allowing a self-selection of diet: 240 kcal (3 points) per day from food group I (e.g., dairy products and eggs); 480 kcal (6 points) per day from food group II (e.g., meat, fish, and beans); 240 kcal (3 points) per day from food group III (e.g., vegetables, fruits, and seaweeds); and 720 kcal (9 points) per day from food group IV (e.g., grains, nuts, snacks, oil, sugar, beverages, and alcohol). During the program, the participants were asked to record their body weight and details of all food consumed in their daily diary and calculate the food points step by step. The trained staff added compliments and advice in each participant’s diary during the lecture and provided short counseling and encouragement after the lecture.
Experimental protocol
Participants were instructed to avoid exercise for at least 72 h before the measurements to eliminate the acute effect of exercise on glycemic control.21,22 The participants fasted overnight for 10–12 h, which includes abstaining from the consumption of caffeine, alcohol, medication, and smoking (only water was allowed). Standard 75 g OGTTs were performed both before and after the diet program. Anthropometric parameters were measured when fasting. The participants’ hemodynamic parameters were assessed when fasting and at 50–60 min and 110–120 min after glucose loading. Blood samples were collected when fasting and at 60 min and 120 min after glucose loading (after each assessment of hemodynamics). All measurements, except for the collection of nutritional data, were conducted in a laboratory that was maintained at 24–26 °C.
Measurements
Anthropometric measurements were taken when the participants were barefoot and wearing only light clothing. Height was measured to the nearest 0.1 cm using a wall-mounted stadiometer (YG-200; Yagami, Nagoya, Japan). Body mass was measured to the nearest 0.1 kg on a calibrated digital scale (InBody 770; InBody Japan, Tokyo, Japan), and adjusted for the estimated clothing mass by subtracting 0.5 kg. BMI was calculated as body mass divided by height squared (kg/m2). Body fat percentage was examined using multifrequency (1, 5, 50, 250, 500 and 1000 kHz) bioimpedance analysis with a tetrapolar eight-point tactile electrode system (InBody 770; InBody Japan, Tokyo, Japan). Waist circumference at the level of the umbilicus in a standing position was measured directly on the skin to the nearest 0.1 cm with flexible tape (in duplicate, then averaged).
The cSBP was estimated noninvasively using the pulse wave analysis technique. After at least 20 min of resting, pressure pulse waveforms in the left radial artery were recorded noninvasively at a sampling rate of 500 Hz for 30 s via an automated hands-free applanation tonometer (HEM-9000AI; Omron Healthcare, Kyoto, Japan) with participants in the sitting position. The wristwatch-shaped sensor unit has a pressure sensor with an array of multiple 40-microtransducer elements, one of which was automatically selected to obtain optimal radial waveforms with an appropriate hold-down pressure. Immediately after recording the waveforms, the systolic blood pressure (SBP) and diastolic blood pressure (DBP) of the left brachial artery were measured using the oscillometric method (HEM-9000AI; Omron Healthcare, Kyoto, Japan) and these were used to calibrate the radial pressure waveforms. The entire set of procedures including waveform recording and blood pressure assessment was repeated three times, and the mean values of the three measurements were used in the analysis. The first and second peaks of the radial pulse waveform were automatically identified using the fourth derivative wave as the second and third zero crossing points, respectively. The radial second systolic peak pressure was used as an estimate for the cSBP; the close correlation between radial second systolic peak pressure and cSBP has previously been validated by an invasive method.23 The day-to-day (at least seven-day interval) coefficient of variance for estimated cSBP was 2.8 ± 2.1% (mean ± standard deviation; n = 10) in our laboratory. The 2-h averaged cSBP during OGTT was calculated by dividing the area under the curve (mmHg·120 min), calculated using the linear trapezoidal method, by 120 (min).
Blood samples were taken from the antecubital vein when fasting to measure the plasma levels of glucose and the serum levels of insulin, high-density lipoprotein (HDL) cholesterol, low-density lipoprotein (LDL) cholesterol, and triglycerides, which were determined using standard enzymatic techniques. Plasma glucose levels and serum insulin levels were measured also at 60 min and 120 min after glucose loading. The homeostasis model assessment for insulin resistance (HOMA-IR) was calculated from the fasting insulin and glucose levels using the following equation: HOMA-IR = Fasting glucose (mg/dL) × Fasting insulin (mU/L)/405.
Daily total energy intake in kilocalories and the daily amounts of protein, fat, carbohydrates, and salt in grams were evaluated at week 0 and week 10 of the 12-week diet program using a nutrition-analysis software (Excel Eiyo-kun 4.0; Kenpakusha, Tokyo, Japan). The evaluations were based on three-day weighed dietary records and dietary recall interviews performed by a skilled dietician. The participants were asked to complete food records on two weekdays and one weekend/holiday.
Statistical analyses
Statistical analyses were performed using SPSS Statistics 24.0 for Windows (IBM, Tokyo, Japan). The Shapiro–Wilk test was used to evaluate the normality of distributions, and the differences between before and after the diet program were assessed by paired t-tests, Wilcoxon signed-rank tests, or McNemar’s tests, as appropriate. A linear mixed model with a compound symmetry covariance structure was used to determine the responses following glucose loading (with 0 min as the reference category), and Bonferroni correction for multiple testing was applied to adjust the p values. An expectation-maximization (EM) algorithm was used to estimate the mean and standard error of the serum insulin levels during OGTT including missing data (<5%) due to hemolysis. The relationships between variables were assessed by Spearman’s rank correlation coefficient (rs) analysis. In all tests, a two-tailed p < 0.05 was accepted as statistically significant. Data are expressed as mean ± standard deviation (SD), mean ± standard error (SE), mean change from baseline and 95% confidence interval (CI), or frequency counts and percentages (%).
Results
Participants’ characteristics both before and after the 12-week dietary modification program are presented in Table 1. After the diet program, daily intakes of total energy and major nutrients were significantly decreased; consequently, all indices of obesity were significantly reduced (e.g., mean change from baseline in body mass was −10.1 kg or −12.1%). In addition, the metabolic syndrome score and the prevalence of metabolic syndrome significantly decreased after the diet program. No participant changed their medication or smoking habits during the 12-week program.
| Before | After | |
|---|---|---|
| Age, years | 52 ± 10 | |
| Height, cm | 169 ± 7 | |
| Body mass, kg | 83.3 ± 10.2 | 73.2 ± 9.4* |
| Body mass index, kg/m2 | 29.1 ± 2.3 | 25.6 ± 2.1* |
| Total body fat, % | 29.6 ± 4.9 | 22.0 ± 5.9* |
| Waist circumference, cm | 100.1 ± 7.9 | 89.8 ± 7.5* |
| Serum HDL cholesterol, mg/dL | 53 ± 13 | 53 ± 12 |
| Serum LDL cholesterol, mg/dL | 135 ± 42 | 112 ± 39* |
| Serum triglycerides, mg/dL | 167 ± 77 | 99 ± 67* |
| HOMA-IR, U | 2.1 ± 1.3 | 0.8 ± 0.3* |
| Total energy intake, kcal/day | 2240 ± 570 | 1584 ± 157* |
| Protein intake, g/day | 82 ± 17 | 72 ± 13* |
| Fat intake, g/day | 71 ± 20 | 50 ± 7* |
| Carbohydrate intake, g/day | 294 ± 107 | 200 ± 24* |
| Salt intake, g/day | 12 ± 2 | 10 ± 2* |
| Metabolic syndrome score | 2.9 ± 1.1 | 1.3 ± 1.0* |
| Metabolic syndrome, n | 9 (60) | 2 (13)* |
| Currently smoking, n | 4 (27) | 4 (27) |
| Medications for hypertension, n | 5 (38) | 5 (38) |
| RAAS inhibitors, n | 4 (31) | 4 (31) |
| Calcium channel blockers, n | 4 (31) | 4 (31) |
| Alpha-blockers, n | 1 (8) | 1 (8) |
| Medications for hyperglycemia, n | 0 (0) | 0 (0) |
| Medications for dyslipidemia, n | 4 (31) | 4 (31) |
| Statins, n | 3 (23) | 3 (23) |
| Fibrates, n | 1 (8) | 1 (8) |
| Ethyl icosapentate, n | 1 (8) | 1 (8) |
Data are expressed as mean ± SD or frequency counts (%) as appropriate. Abbreviations: HDL, high-density lipoprotein; LDL, low-density lipoprotein; HOMA-IR, homeostasis model assessment for insulin resistance; RAAS, renin–angiotensin–aldosterone system.
p < 0.05 vs. before the diet program.
Participants’ characteristics before and after the 12-week diet program.
Figure 1 shows the plasma glucose and serum insulin levels during 75-g OGTT before and after the diet program. Glucose loading significantly increased the plasma glucose and serum insulin levels for 120 min both before and after the diet program. After the program, plasma glucose levels at 0 min (mean ± SE; before to after the program; 99 ± 2 to 91 ± 2 mg/dL, p = 0.001) and 120 min (160 ± 8 to 136 ± 8 mg/dL, p = 0.010) had decreased significantly. The plasma glucose levels at 60 min (187 ± 9 to 162 ± 10 mg/dL, p = 0.071) exhibited a borderline significant difference between before and after the program. The serum insulin levels at 0 min (8.6 ± 1.3 to 3.4 ± 0.3 μU/mL, p = 0.001), 60 min (84.5 ± 15.0 to 35.4 ± 9.6 μU/mL, p = 0.001), and 120 min (89.9 ± 14.0 to 40.0 ± 9.6 μU/mL, p = 0.002) had significantly decreased after the diet program. As a result, HOMA-IR decreased significantly after the diet program (Table 1).
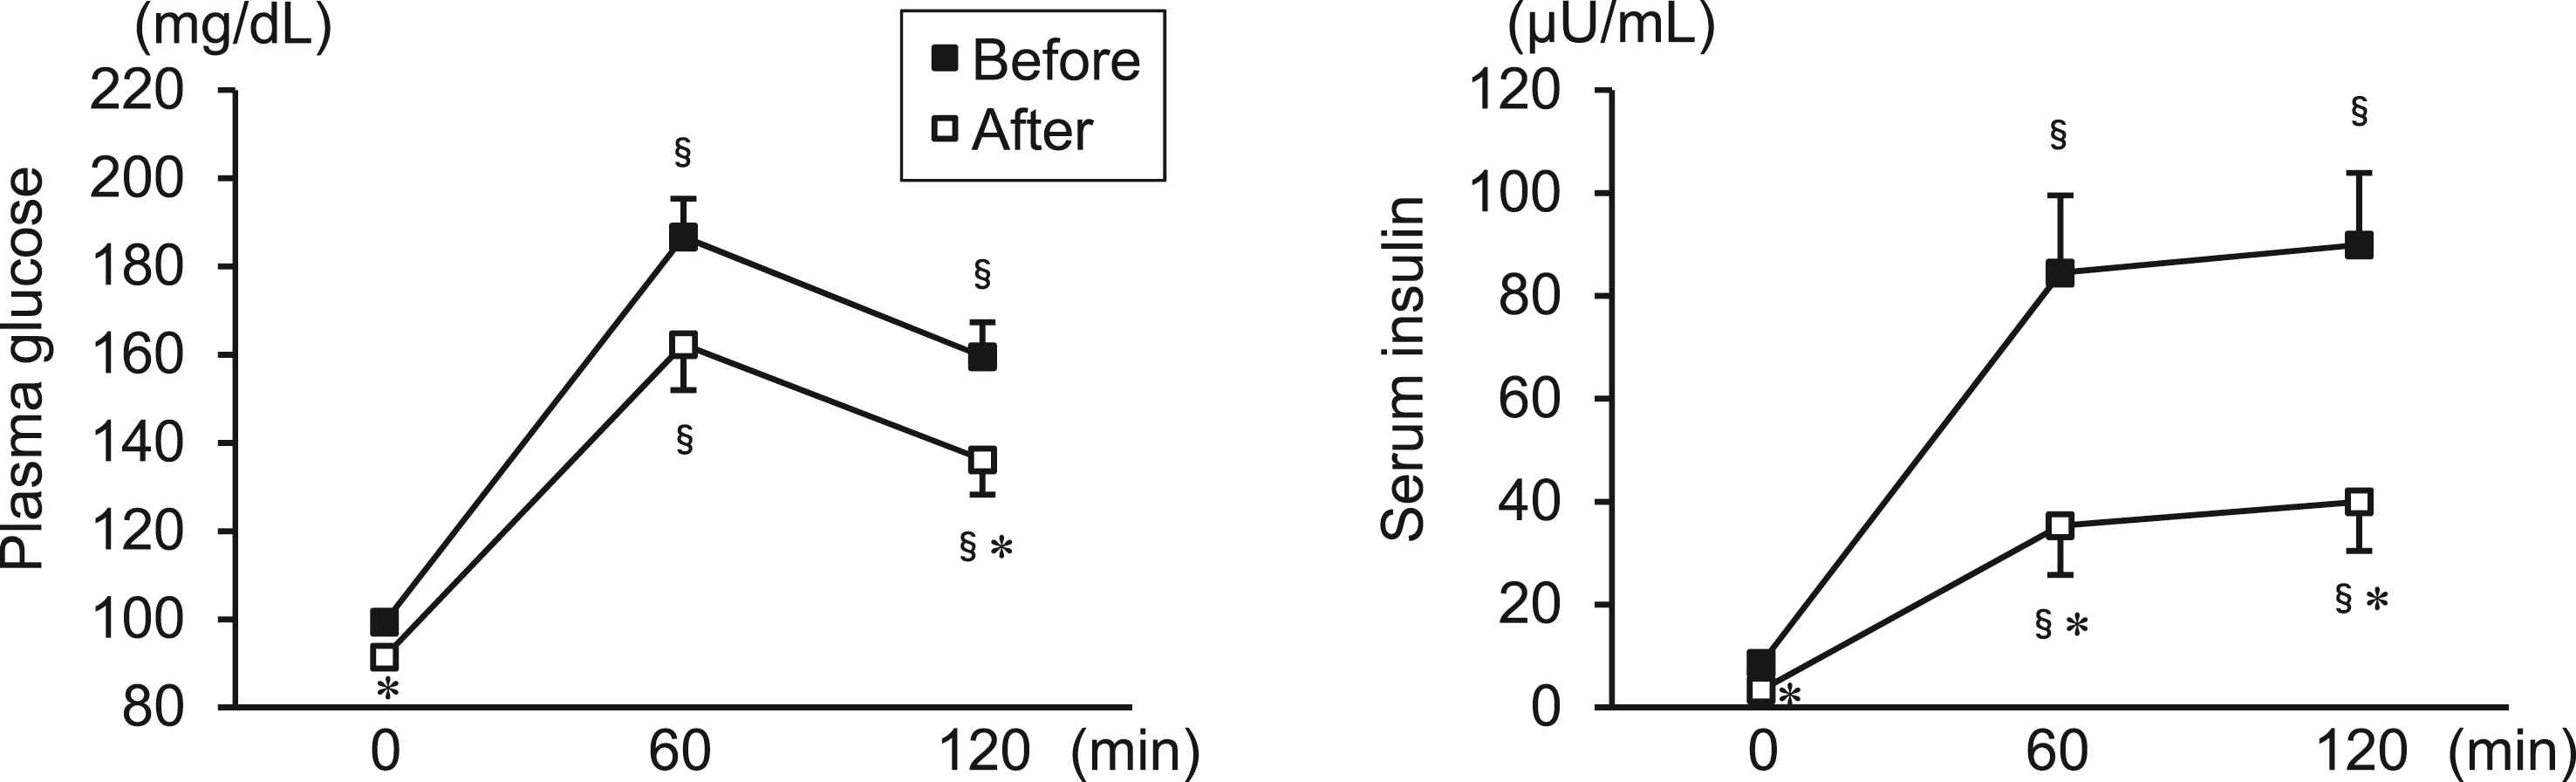
Plasma glucose and serum insulin levels during 75-g OGTT before and after the 12-week diet program in overweight/obese men. Data are expressed as mean ± SE. §p < 0.05 vs. 0 min (same time point for intervention); *p < 0.05 vs. before the diet program (same time point for OGTT).
Figure 2 shows the blood pressure and heart rate during 75-g OGTT before and after the diet program. The brachial SBP, brachial DBP, and heart rate at all time points were significantly decreased after the diet program. The 12-week program resulted in significant reductions of cSBP at 0 min (mean ± SE; before to after the program; 116 ± 3 to 106 ± 3 mmHg, p = 0.005) (mean change from baseline [95% CI]; −9.7 [−16.1 to −3.4] mmHg) and 60 min (109 ± 3 to 101 ± 3 mmHg, p = 0.005) (−8.6 [−14.2 to −3.0] mmHg) and a borderline significant decrease in cSBP at 120 min (111 ± 3 to 105 ± 3 mmHg, p = 0.083) (−5.6 [−12.1 to 0.8] mmHg). Consequently, the 2-h averaged cSBP during OGTT significantly decreased after the diet program (111 ± 3 to 103 ± 3 mmHg) (−8.1 [−13.2 to −3.1] mmHg) (Fig. 3).
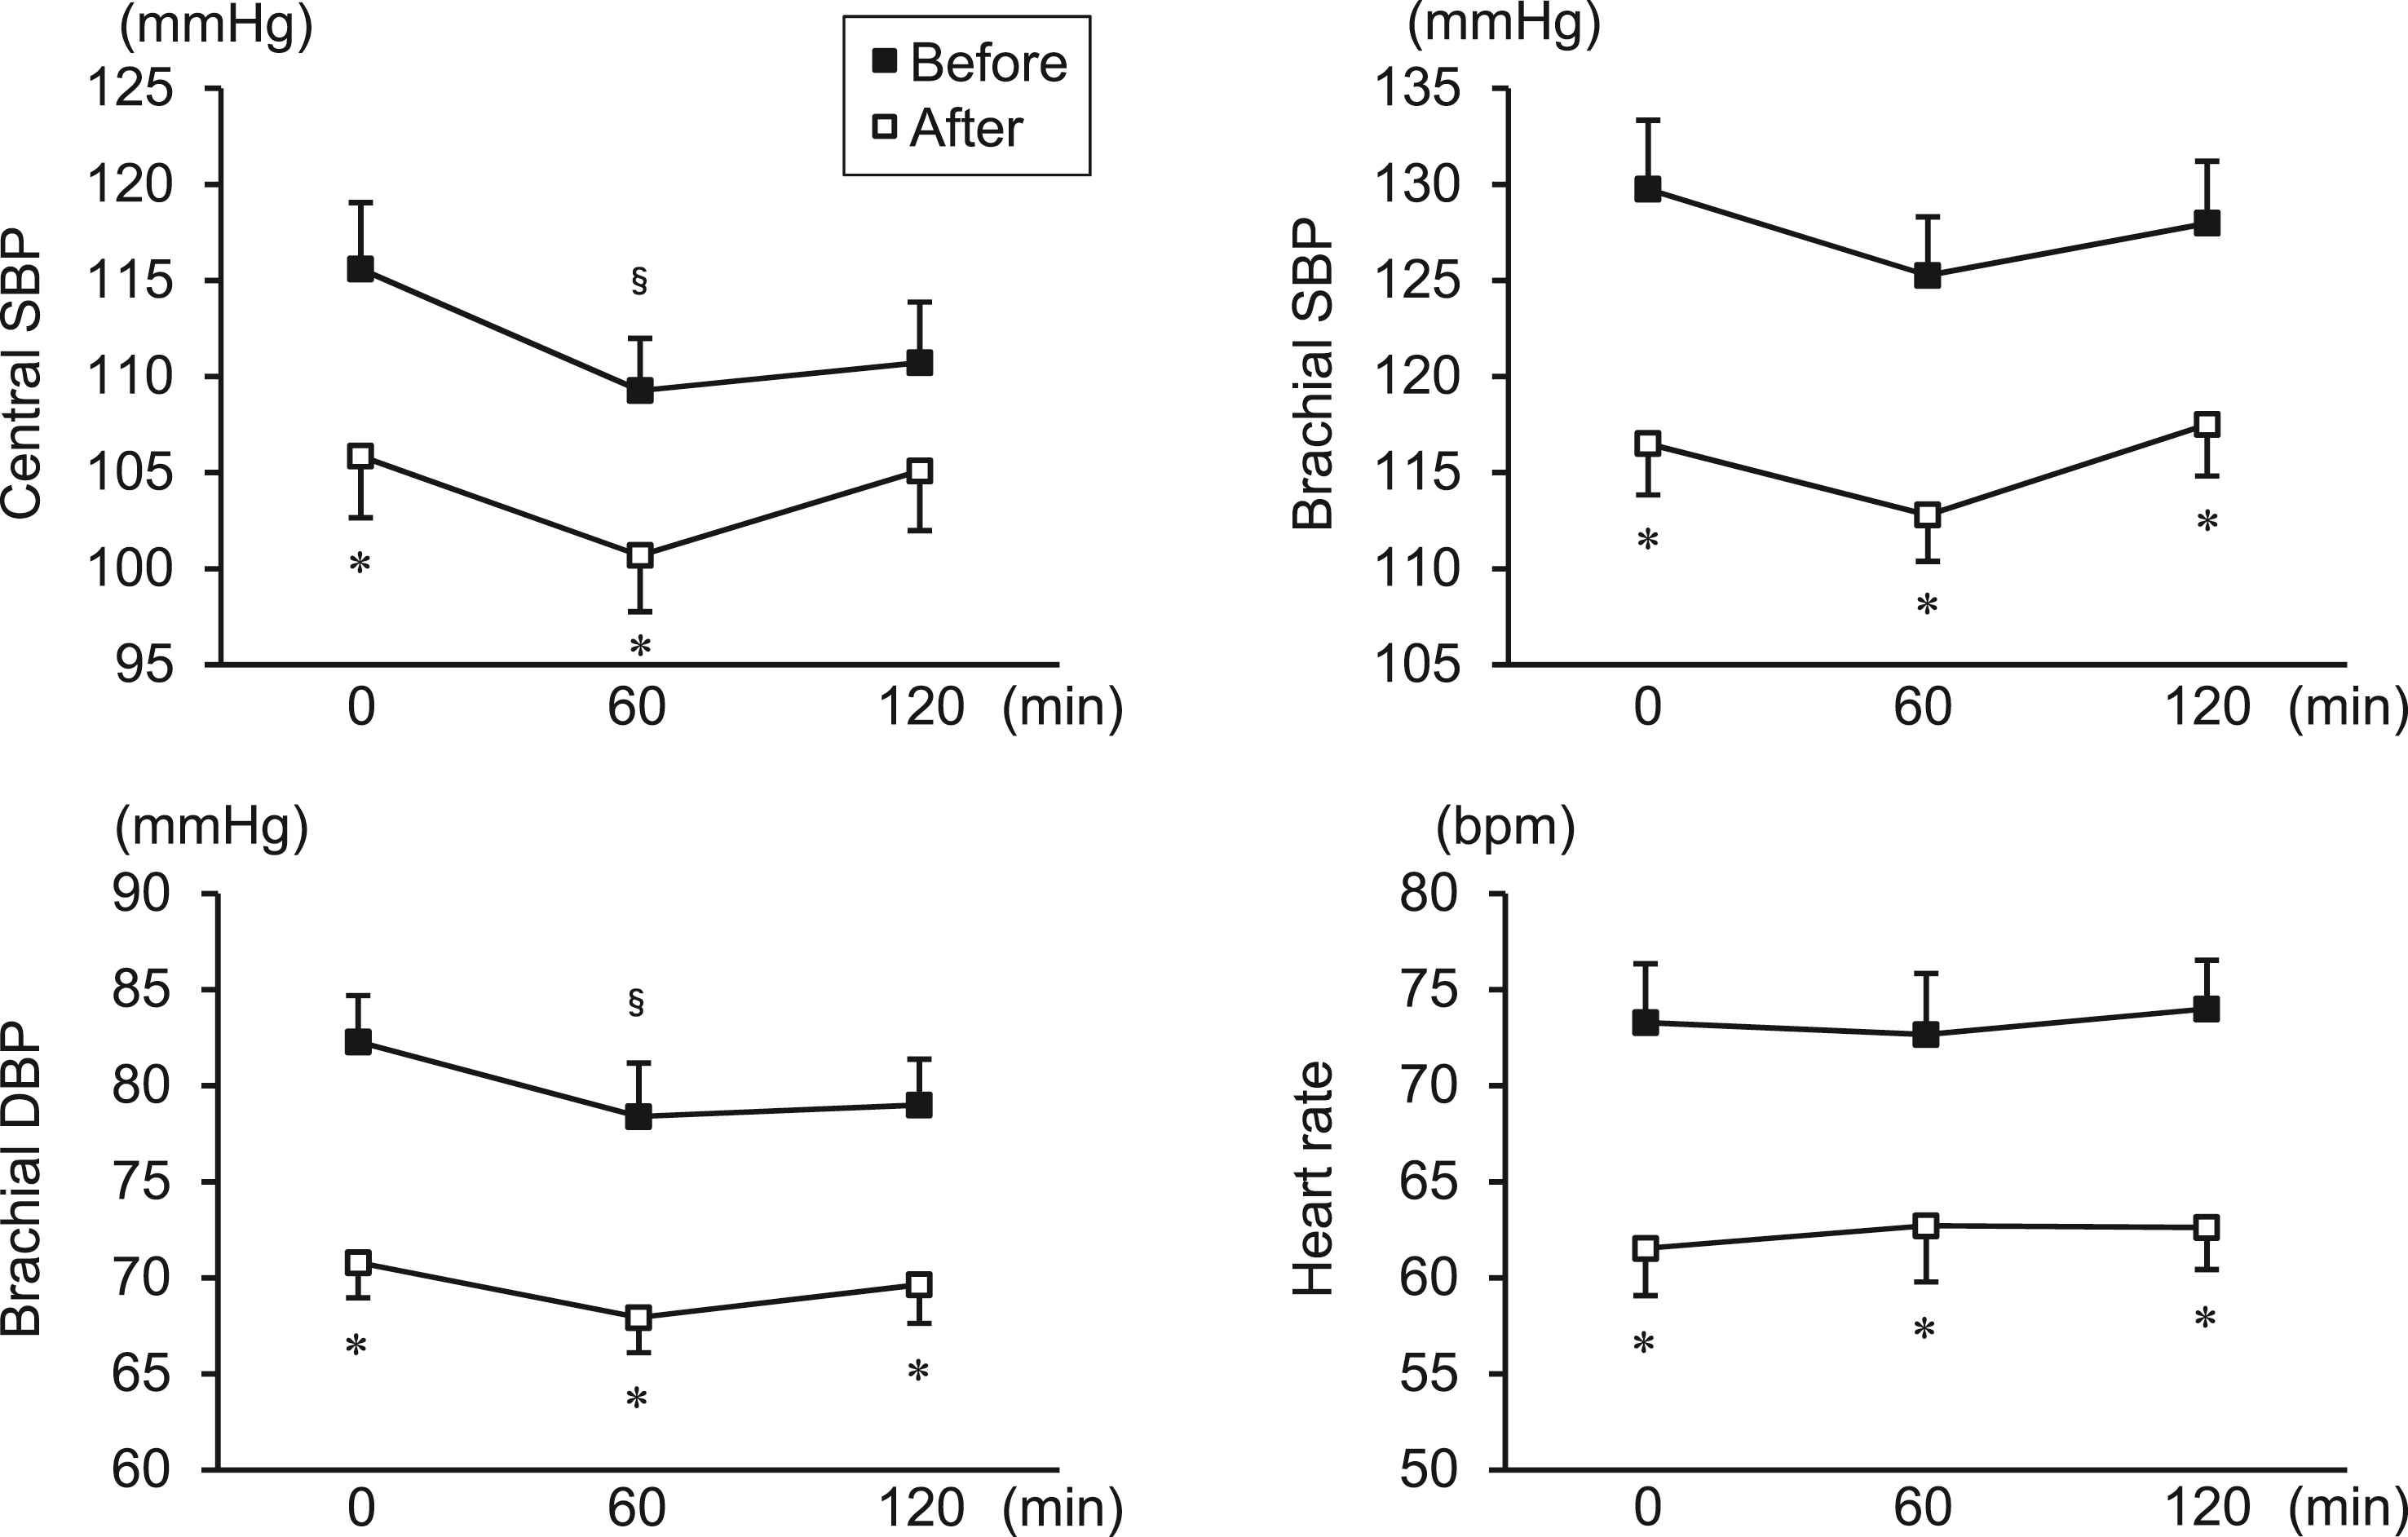
Blood pressure and heart rate during 75-g OGTT before and after the 12-week diet program in overweight/obese men. Data are expressed as mean ± SE. §p < 0.05 vs. 0 min (same time point for intervention); *p < 0.05 vs. before the diet program (same time point for OGTT).
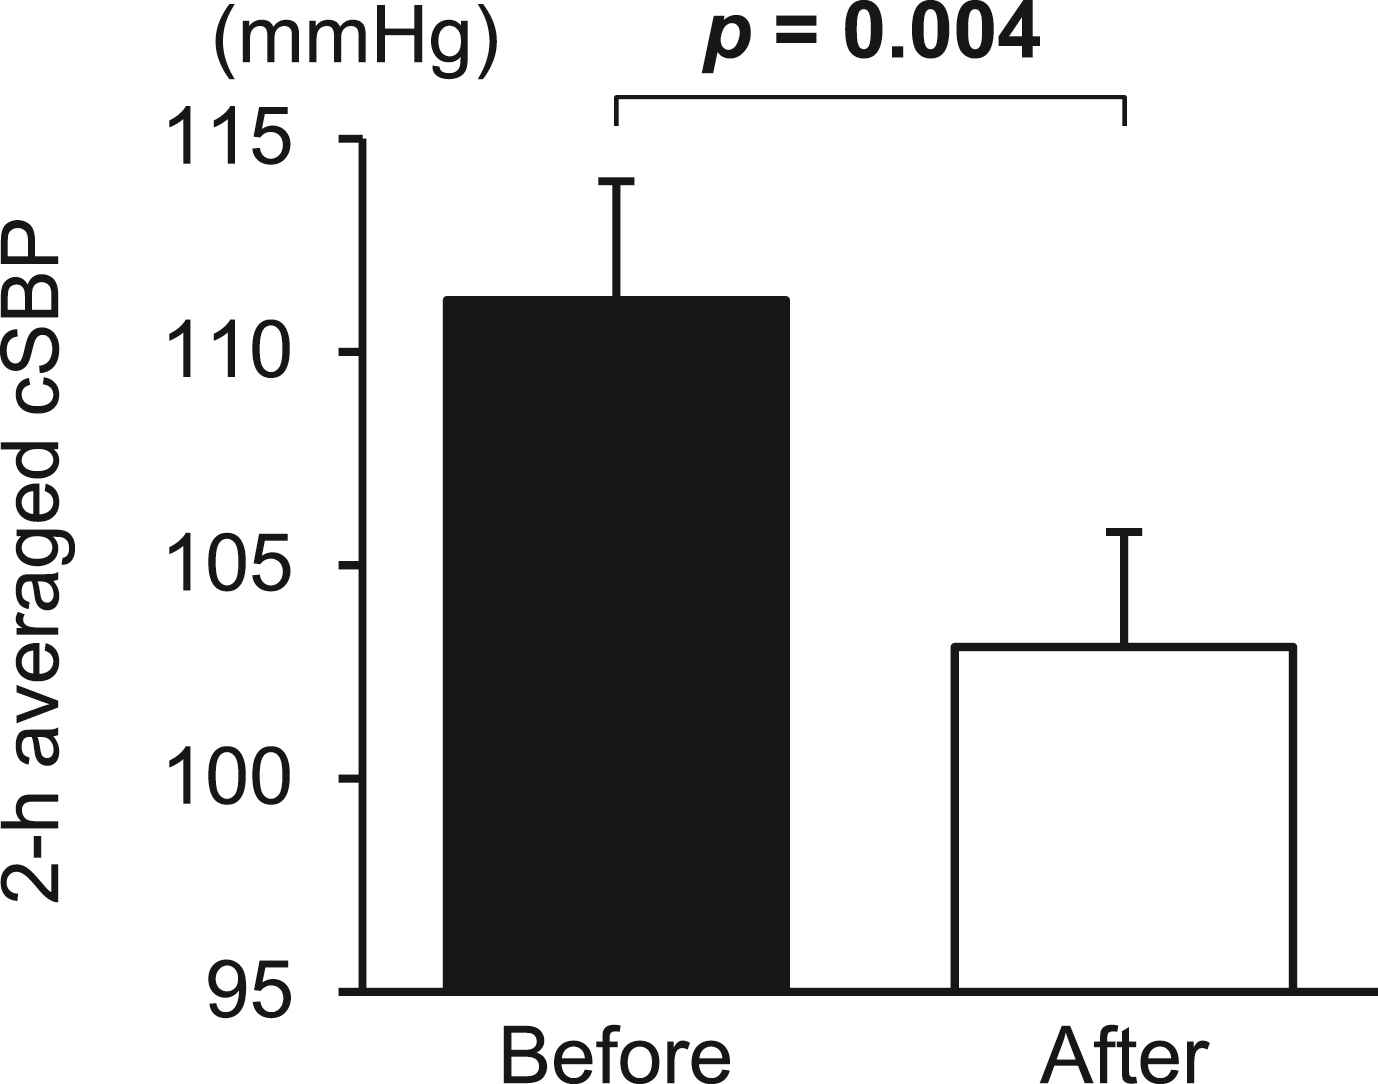
The 2-h averaged cSBP during OGTT before and after the 12-week diet program. Data are expressed as mean ± SE. Numbers in bold indicate statistical significance.
The relationships between HOMA-IR and 2-h averaged cSBP are depicted in Fig. 4. Both baseline 2-h averaged cSBP and the change in 2-h averaged cSBP were significantly associated with the baseline HOMA-IR. In addition, the change in HOMA-IR significantly correlated to the change in 2-h averaged cSBP. Similarly, the change in fasting cSBP was significantly associated with the change in HOMA-IR (rs = 0.786, p = 0.001). However, the change in 2-h averaged cSBP was not significantly associated with the change in body mass (rs = 0.175, p = 0.532), the change in total body fat percentage (rs = 0.403, p = 0.136), or the change in waist circumference (rs = 0.295, p = 0.286). Similarly, there were no significant correlations between the change in 2-h averaged cSBP and changes in the other parameters listed in Table 1 (i.e., serum lipid profiles, nutrient intakes, or metabolic syndrome score).
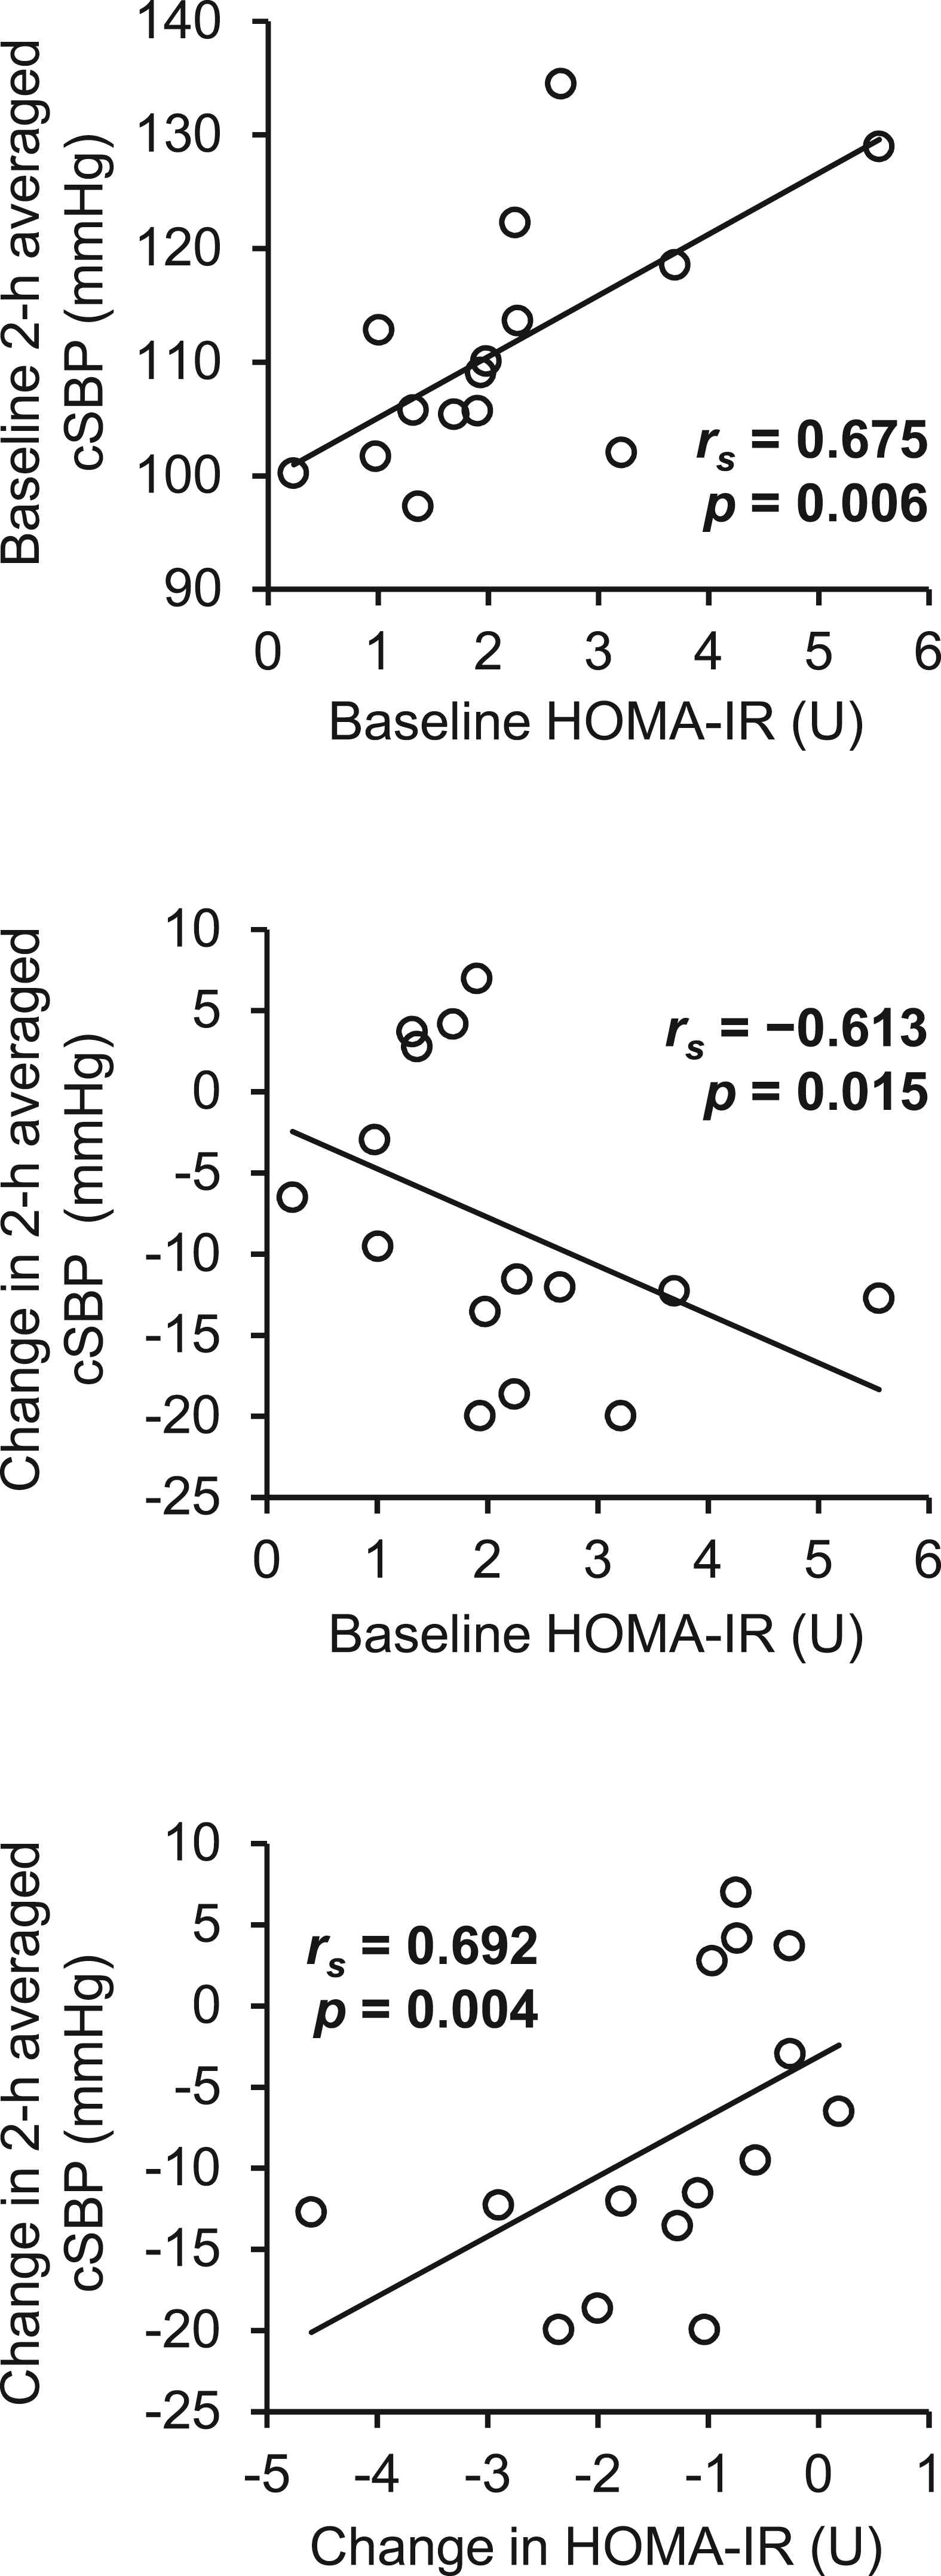
The relationships between baseline or change from baseline in 2-h averaged cSBP and baseline or change in HOMA-IR. Data are expressed as individual values. Numbers in bold indicate statistical significance.
Discussion
In the present study, we investigated the effects of a 12-week dietary modification program, which elicited substantial weight loss (−10.1 kg or −12.1%), on cSBP (estimated from radial second systolic peak pressure) during 2-h OGTT in overweight/obese men. The 2-h averaged cSBP during OGTT was significantly decreased after the diet program and this significantly correlated to a decrease in HOMA-IR, indicating that the diet-induced improvement in insulin resistance may have contributed to the reduction in postprandial cSBP.
We previously reported that fasting cSBP significantly decreased from 114 ± 3 to 101 ± 4 mmHg (mean ± SE) after successful weight reduction (−11.5 kg or −13.5%), which was induced by a 12-week combination program that involved both dietary modification (similar protocol to that followed in the present study) and exercise training (walking/jogging, Borg scale 11–15, 40–60 min/session, 3 sessions/week) in overweight/obese men (BMI, 29 ± 1 kg/m2).6 In the present study, we demonstrated that fasting cSBP significantly reduced from 116 ± 3 to 106 ± 3 mmHg after the diet program, and this change was comparable to the cSBP change after the combination program. Similarly, Figueroa et al.24 reported that a 12-week diet-induced weight loss (−5.7 kg or −6.2%) regimen significantly decreased fasting cSBP from 121 ± 3 to 114 ± 3 mmHg in postmenopausal obese women (age, 55 ± 1 years; BMI, 35 ± 1 kg/m2). Here we first describe the effects of a dietary modification program on cSBP during fasting and in postprandial state (simulated by OGTT) in overweight/obese men. The 12-week diet program led to a substantial reduction in cSBP at any time point during 2-h OGTT; consequently, the 2-h averaged cSBP was significantly decreased after the program. Taken together, the results from previous and present studies indicate that dietary modification is an essential part of non-pharmacological cSBP management in overweight/obese adults.
Insulin resistance measured by HOMA-IR was reportedly associated with higher cSBP in fasting state.25 The present results at baseline intervention showed that HOMA-IR also significantly correlated with the 2-h averaged cSBP during OGTT (i.e., postprandial state in which the role of insulin resistance is emphasized). In addition, both baseline and change in HOMA-IR were significantly associated with changes in 2-h averaged cSBP. These findings indicate that insulin resistance is an important predictor and mechanism for the diet-induced improvement in cSBP regulation during OGTT. Insulin exhibits both vasodilator and vasoconstrictor effects primarily via nitric oxide (NO) and endothelin-1 (ET-1), respectively. Interestingly, insulin resistance characterizes suppressed insulin-induced NO production, whereas compensatory hyperinsulinemia enhances insulin-stimulated ET-1 secretion.26 This “selective insulin resistance” deteriorates endothelial function, and accordingly, causes higher blood pressure. In the current study, insulin resistance was dramatically improved after the diet program, and thus, it can be hypothesized that the balance between NO and ET-1 was a major mediator linking HOMA-IR and cSBP during OGTT. In support of this hypothesis, our group previously reported that the 12-week diet program significantly increased plasma nitrite/nitrate (NOx) concentrations and significantly decreased plasma ET-1 concentrations in overweight/obese men.17 However, plasma levels of NOx and ET-1 were not measured in this study; therefore, further studies are needed to confirm the detailed mechanism.
The mean change in fasting cSBP after the diet program was −10 mmHg, which corresponds to 30% reduction in cardiovascular mortality risk.1 In addition, the mean change in fasting (resting) heart rate was −12 bpm, which corresponds to at least 12% reduction in risks of coronary artery disease and sudden death.27 Heart rate is a strong negative determinant of cSBP; indeed, a 1-bpm reduction in the heart rate increases cSBP by 0.3 mmHg.28 In this regard, the 12-bpm decrease in heart rate may have offset a 3.6 mmHg reduction in cSBP after the diet program, implying that the heart rate–independent effect of the diet program on fasting cSBP was −13.6 mmHg. It could be speculated that the cardiovascular mortality risk of our population would therefore have decreased by nearly 50% on average via reductions in both cSBP and heart rate after the 12-week diet program.
On the other hand, the mean change in fasting brachial SBP after the diet program was −13 mmHg (mean ± SE; before to after the program; 130 ± 4 to 117 ± 3 mmHg, p = 0.002). A meta-analysis29 that included approximately 5000 participants reported that a change in brachial SBP was −1.1 mmHg (95% CI; −1.4 to −0.7 mmHg) per kg of weight loss. In agreement with this estimate, the current results showed a brachial SBP change of −1.3 mmHg per kg of weight loss, confirming the importance of weight management for blood pressure control. The magnitude of SBP reduction after the diet program was significantly greater in brachial artery than in central aorta at any time point during 2-h OGTT (all p < 0.01). As discussed above, this was probably due to the considerable decrease in heart rate. Therefore, it should be noted that a diet-induced reduction in brachial SBP with substantially decreased heart rate will overestimate an effect of dietary intervention on cSBP.
There are some limitations in this study. We recognize that the small sample size may have led to a Type II error (but not Type I error) when the effect size of a difference or correlation was small or medium (e.g., Cohen’s d < 0.8, Spearman’s rs < 0.5), which however indicates the large effect size of statistically significant results in this study. Furthermore, to reduce the influences of age and sex on cSBP regulation during OGTT, the study population was limited to men aged 30–64 years; therefore, further examinations are needed to generalize these findings to other populations. Finally, because of ethical concerns about health promotion in overweight/obese individuals who are potentially at a risk for lifestyle-related diseases, we did not assign such individuals to the control group, the participants of which were expected to maintain their unhealthy eating behavior. Thus, it cannot be assured that the differences between before and after the intervention period were entirely attributed to the dietary modification program. However, in this study, the difference between before and after the program in fasting cSBP was 10 mmHg; this can be hardly explained by 12-week changes in environmental factors (e.g., outdoor temperature and humidity).30 We believe that a large portion of the improvements in hemodynamics and blood chemistry profiles, as well as obesity indices, were elicited intrinsically by the diet program.
In conclusion, fasting cSBP and 2-h averaged cSBP during OGTT in overweight/obese men were significantly reduced after 12 weeks of adhering to a nutritionally well-balanced hypocaloric diet program. Furthermore, insulin resistance evaluated by HOMA-IR also significantly improved after the diet program, and there was a positive correlation between the changes from baseline in both 2-h averaged cSBP and HOMA-IR. The results suggest that insulin resistance plays a key role in the management of cSBP during the postprandial period.
Declaration of interest
The authors declare no conflict of interest.
Acknowledgments
This study was supported by a Grant-in-Aid for JSPS Research Fellow (15J00840), Tokyo, Japan. We are grateful to Dr. Nobuhiko Akazawa, Mr. Koichiro Tanahashi, Mr. Satoshi Oikawa, Mr. Kaname Tagawa, Mr. Keisei Kosaki, and Ms. Yuriko Sawano for their technical assistance and helpful discussions. We would also like to thank the research members of K.T.’s laboratory for their assistance in conducting the diet program.
References
Cite this article
TY  - JOUR
AU  - Toru Yoshikawa
AU  - Hiroshi Kumagai
AU  - Kanae Myoenzono
AU  - Asako Zempo-Miyaki
AU  - Takehiko Tsujimoto
AU  - Kiyoji Tanaka
AU  - Seiji Maeda
PY  - 2017
DA  - 2017/11/02
TI  - Effects of dietary modification with weight loss on central blood pressure during oral glucose tolerance test in overweight/obese men
JO  - Artery Research
SP  - 27
EP  - 34
VL  - 20
IS  - C
SN  - 1876-4401
UR  - https://doi.org/10.1016/j.artres.2017.10.199
DO  - 10.1016/j.artres.2017.10.199
ID  - Yoshikawa2017
ER  -