
Waves and Windkessels reviewed
- DOI
- 10.1016/j.artres.2017.03.001How to use a DOI?
- Keywords
- Haemodynamics; Wave reflection; Wave intensity; Wave separation; iFR
- Abstract
Pressure and flow are travelling waves and are reflected at many locations. The forward and reflected waves, obtained by wave separation, are compound waves. This compounded character of the reflected wave explains why its magnitude decreases with increased peripheral resistance, why it appears to run forward rather than backward, and why its return time relates poorly with aortic wave speed. A single tube (aorta) with distal reflection is therefore an incorrect arterial model. Wave Intensity Analysis (WIA) uses time derivatives of pressure and flow, augmenting rapid changes and incorrectly suggesting a ‘wave free period’ in diastole. Assuming a ‘wave free period’, the Reservoir-Wave Approach (RWA) separates pressure into a ‘waveless’ reservoir pressure, predicted by Frank’s Windkessel, and excess pressure, accounting for wave phenomena. However, the reservoir pressure, being twice the backward pressure, and location dependent, is a wave. The Instantaneous wave Free pressure Ratio distal and proximal of a stenosis, iFR, also assumes a ‘wave free period’, and is based on an instantaneous pressure-flow ratio, an incorrect resistance measure since Ohm’s law pertains to averaged pressure and flow only. Moreover, this ratio, while assumed minimal, was shown to decrease with vasodilation.
Windkessel models are descriptions of an arterial system at a single location using a limited number of parameters. Windkessels can be used as model but the actual arterial system is not a Windkessel. Total Peripheral Resistance and Total Arterial Compliance, (the 2-element, Frank Windkessel), supplemented with aortic characteristic impedance (3-element Windkessel) mimics the arterial system well.
- Copyright
- © 2017 Association for Research into Arterial Structure and Physiology. Published by Elsevier B.V. All rights reserved.
- Open Access
- This is an open access article distributed under the CC BY-NC license.
Introduction
The pulsatile cardiac pump sets up time and location dependent waves of pressure and flow in the arterial system. These waves travel over the system, and are (partially) reflected at many locations. Both pressure and flow waves consist of forward and reflected (backward) components. The forward and backward waves are the sum of many individually reflected waves and thus compounded waves.
We here review the different methods of (pressure) wave analysis. We will start with Wave Separation Analysis (WSA), i.e. the separation of pressure and flow into their forward and backward components1 and explain how analysis of the measured pressure wave alone, so-called pressure Wave Form Analysis (WFA) relates to arterial properties.2 Subsequently we will discuss Wave Intensity Analysis (WIA) and show the similarities and differences with Wave Separation Analysis.3 Then two methods based on Wave Intensity Analysis will be discussed, the Reservoir-Wave Approach (RWA)4 and the instantaneous wave Free Ratio (iFR) of pressures distal and proximal of a stenosis.5 Finally, we will discuss Windkessel models as description of pressure-flow relations, and show that with three parameters the arterial system can be described. Most calculations and examples will be discussed using proximal aortic pressure and flow waves.
Wave Separation Analysis
If no reflections of waves would be present in the arterial system the pressure and flow waves would have similar shape and their ratio is given by the characteristic impedance, Zc, of the vessel at the measurement location (Fig. 1A). The Zc depends on vessel size, wall stiffness (compliance) and blood properties, and can be seen as the combined effect of the accelerating blood mass taking place during the ejection phase into the compliant artery. The Zc relates to Pulse Wave Velocity, PWV, as Zc·A = ρ·PWV with A cross-sectional area of the artery. For large arteries (aorta and conduit arteries) the characteristic impedance is a (mathematically) real quantity, and without reflections pressure and flow have similar shape (Fig. 1A). At bifurcations and other discontinuities both pressure and flow waves are (partly) reflected. The reflection coefficient of pressure and flow are quantitatively the same but their signs are opposite. This can be understood as follows. When a vessel is closed at the end, the flow wave reflects completely but inversely and the net (measured) flow is zero. Pressure however also reflects completely and measured pressure is twice as large as the incoming pressure.
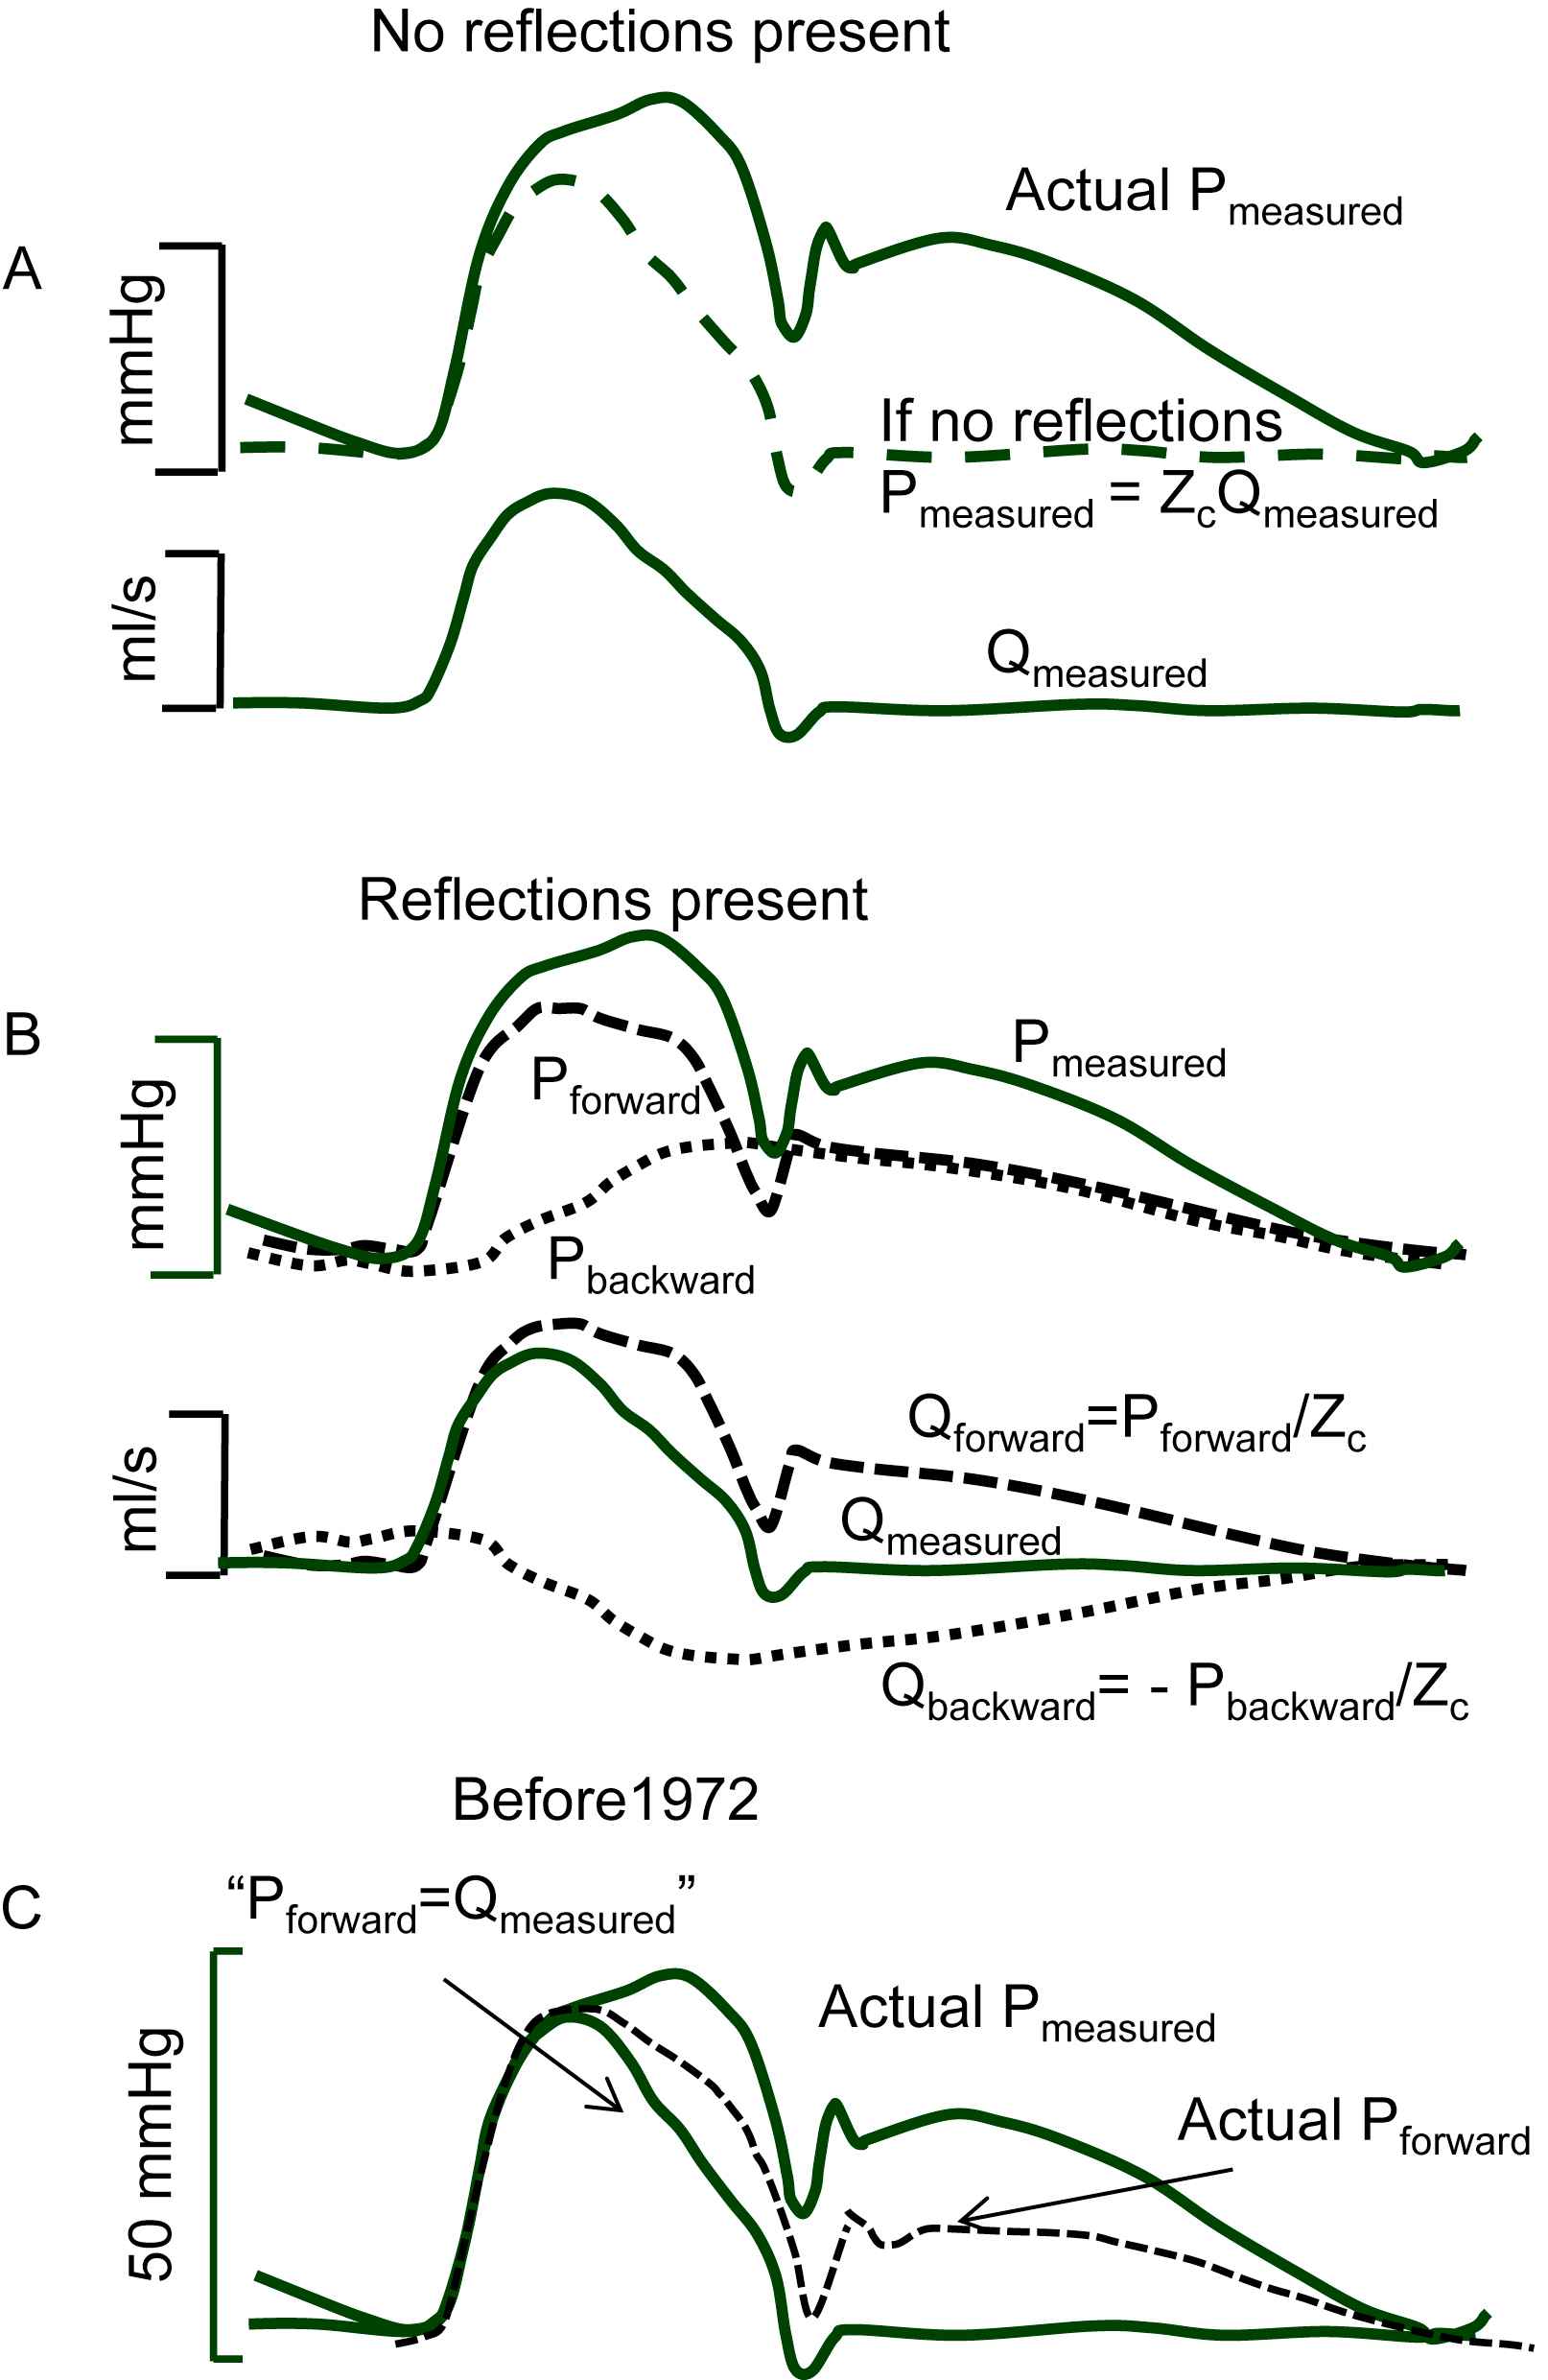
Separation of pressure and flow waves. Panel A: Without reflections the pressure and flow wave have the same shape, their ratio is the characteristic impedance, Zc; The measured (actual) pressure is also given. Panel B: Pressure and flow waves consist of forward and backward (reflected) waves. The forward pressure and flow waves are related by Zc (dashed lines); the backward pressure and flow waves relate by −Zc (dotted lines), meaning that backward pressure and flow waves have the same shape but are inversed with respect to each other. Panel C: Before 1970 pressure waves were assumed to reflect while flow waves were assumed not to consist of forward and backward components; it was generally assumed that the forward pressure wave was equal to the measured flow wave and that the reflected pressure wave was therefore the difference between measured pressure and flow wave scaled with Zc (Redrawn from Kouchoukos and McDonald).6
Therefore, the forward pressure and forward flow wave are related by characteristic impedance, Pforward/Qforward = Zc. The backward waves being inverse with respect to each other relate as Pbackward/Qbackward = −Zc. Reflections are therefore the reason that measured pressure and flow waves, i.e., the sum of forward and backward waves, are different in shape (see Fig. 1B). Since reflections take place at all discontinuities, many reflection sites exist and the forward and backward waves are actually a summation of many individual waves, compound forward and compound backward wave.
Up to the early 1970’s pressure waves were almost exclusively studied and considered, while flow waves were not. An example is given in Fig. 1C.6 The ‘incident’ (i.e. forward) pressure wave was set equal to the measured flow wave, and the backward wave was thus supposed to be the difference between measured pressure wave and measured (scaled with Zc) flow wave. This implies that the heart was assumed to be a flow source (complete negative reflection of the backward flow wave at the heart). However, as also shown in Fig. 1C, and derived below, the forward waves of pressure and flow have the same shape (dashed line) and the reflected wave adds to the forward pressure wave to result in the measured pressure wave while the reflected flow wave is inversed and thus is subtracted from the forward flow wave resulting in the measured flow wave.
The measured pressure and flow wave can be separated into their forward and backward components1,7: Pmeasured = Pforward + Pbackward and Q measured = Q forward + Q backward, and since the relation between forward and backward pressure and flow are Pforward/Q forward = +Zc and Pbackward/Q backward = −Zc, with Zc is characteristic impedance it follows that
The calculation can be performed in the time domain when characteristic impedance is a real and constant number, which is the case in large conduit arteries. For smaller arteries, when characteristic impedance is a complex (frequency-dependent number) the calculation should be carried out after Fourier Analysis.1 For each harmonic equation (1) should be applied with the appropriate Zc and the inverse Fourier then gives the time signals.
It should be noted that in diastole the forward and backward flow waves are similar but inversed adding to zero measured flow in diastole. This cancelling of forward and backward flow waves in diastole results when the aortic valves are closed and competent, with insufficient valves they would not cancel. It is also important to realise that the mean pressure and flow wave are not included in the analysis, since they are not waves. Recently some attempts have been made to incorporate mean values in the analysis.8
The estimation of Zc in the aorta can be obtained by the slope ratio of aortic pressure and flow in early ejection9 and by derivation of input impedance and averaging impedance modulus of the 3rd to 7th harmonic.10
An example of wave separation during the Valsalva manoeuvre is shown in Fig. 2.7 During the manoeuvre the measured pressure wave and flow wave start to resemble each other, implying that the backward wave is small, and thus reflections are small as well. Systemic vascular resistance (SVR) calculated as mean aortic pressure minus intra-thoracic pressure (as measure of venous pressure) increases by 25% (from 1075 ± 48 to 1342 ± 141 dyn s cm−5) while reflections decrease.7 This result therefore shows that reflections are not mainly arising from distal sites in the periphery. It is concluded that a single reflection site, by modelling the arterial system by a uniform tube with SVR as distal load, cannot explain this relation. The changes in reflection result from changes in the major vessels due to the lowered transmural pressure.
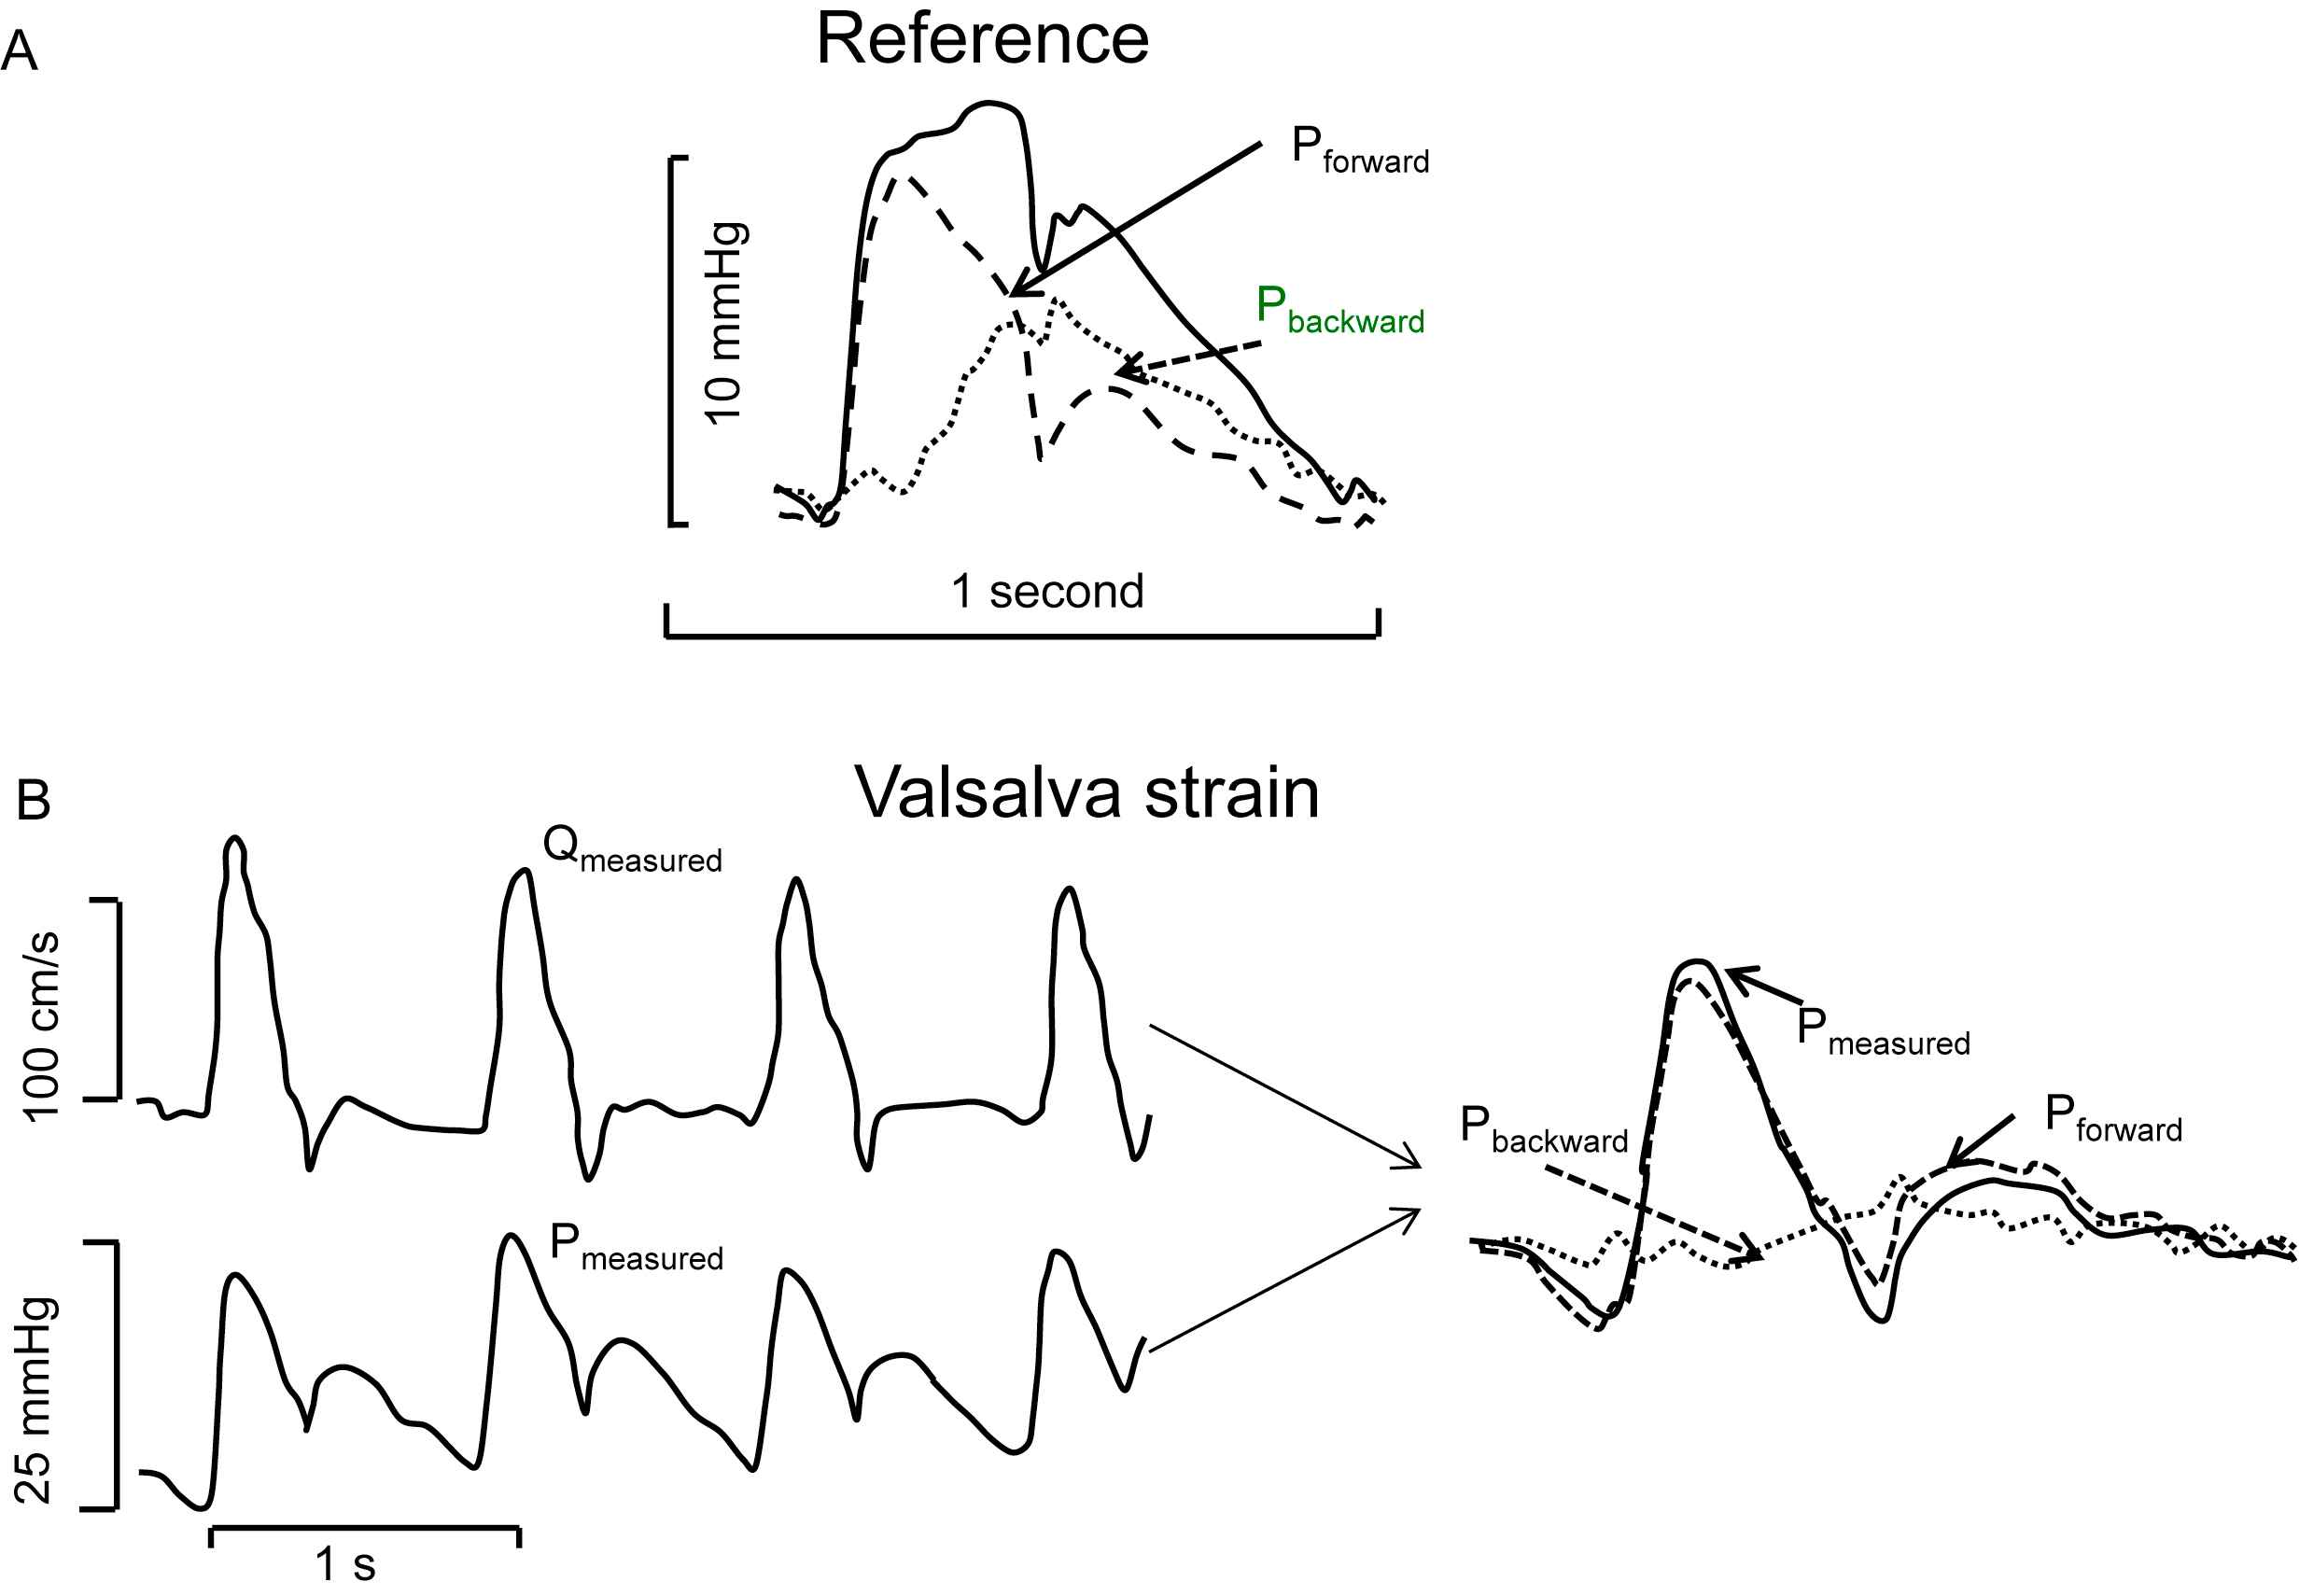
Example of separation of the aortic pressure wave into its forward and backward components. Panel A: In the reference condition the backward wave (stippled) has considerable magnitude. Panel B: During the Valsalva manoeuver reflections are minimal (stippled). Measured flow and measured pressure are similar in shape in systole (left). The measured and forward pressure resemble each other. Adapted from Murgo et al.7
The uniform tube as model of the systemic arterial system played an important role in the older literature11 and was also suggested in the original paper by Murgo and Westerhof10 as explanation of reflections. The uniform tube model is still used in modelling the arterial system,12 often with a distal Windkessel load to improve input impedance. Doubt on the single uniform tube exists since Taylor13 showed that many reflection sites are present and O’Rourke14 showed that a two-tube model behaves more realistically than a single tube.
Recent data on forward and backward waves determined at different locations in the aorta show that Pbackward remains delayed with respect to Pforward and seems to run backward (Fig. 3A).15 A uniform tube with a single reflection site at its distal end predicts a Pbackward running from the periphery to the heart and thus that the time difference between backward and forward wave increases towards the proximal aorta.
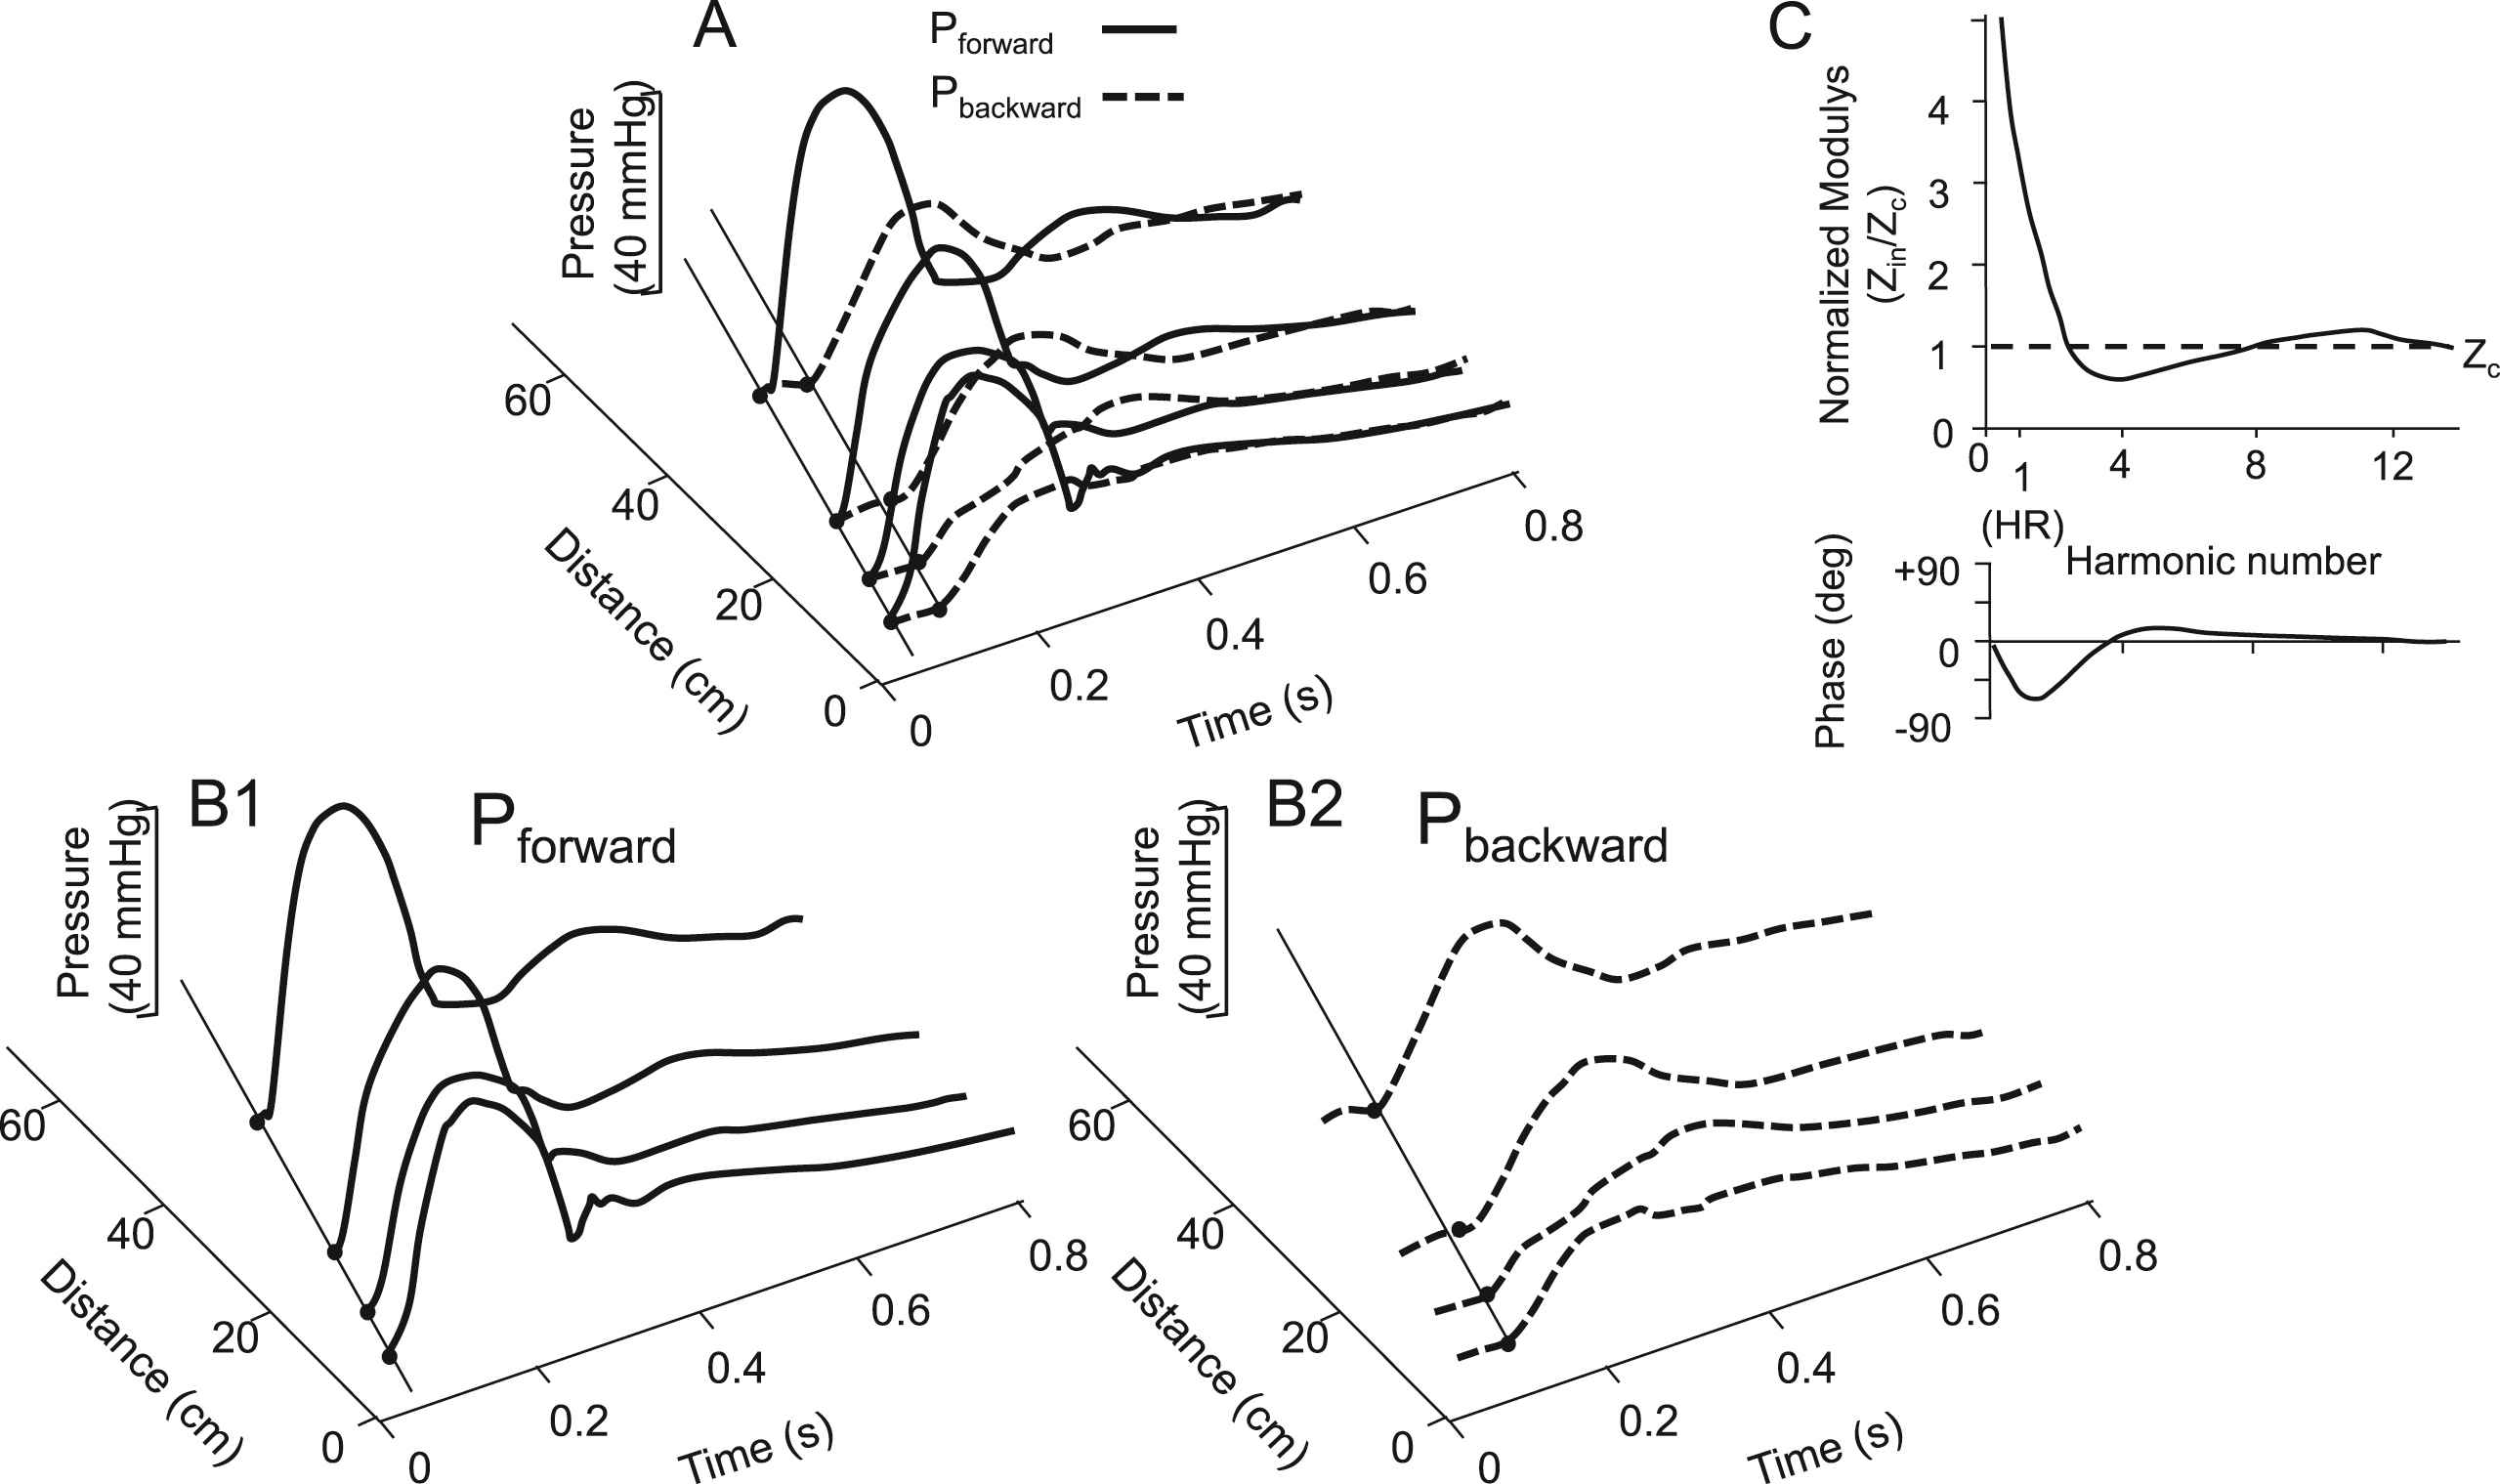
Forward and backward pressures in the aorta at different locations. Panel A: The backward wave lags the forward wave by similar times independent of the location. Panels B1 and B2: Both forward and backward waves travel in time and their wave shapes depend on location. Modified from Tyberg et al.15 Panel C: Input impedance normalized to characteristic impedance (Zc) and frequency (harmonics number) shows a similar behaviour at different locations in the arterial system implying comparable reflection coefficients.
Thus wave separation shows that many reflection sites occur and they are present in the arterial system, not the periphery. Figure 3B shows a schematic presentation of input impedance normalized to characteristic impedance and representative for different locations. The local reflection coefficient equals (Zin − Zc)/(Zin + Zc), with Zin distal input (load) impedance, and Zc the characteristic impedance of the mother vessel. Therefore, the normalized modulus and phase of the reflection coefficient are similar at different locations resulting in similar time delay between forward and backward wave.
The backward wave in the ascending aorta is not a wave that returns from the periphery but is a compound wave, the many reflected waves return from multiple local reflections in the large arteries. This implies that the return time of the reflected wave time is not simply related to aortic PWV.
Waves result from the pump (the heart) and its load (arterial system). Pressure and flow waves and their forward and backward components thus result from heart-arterial interaction. The individual contribution of heart and load cannot be determined.
In summary wave separation has shown that both pressure and flow waves consist of compound forward and reflected (backward) waves. The backward wave can decrease while peripheral resistance is increased and thus does not simply result from reflections in the periphery. A single reflection site at the distal end of a uniform tube is thus not a realistic model of the systemic arterial system. Wave separation alone gives little information of arterial function in terms of resistance and compliance.
Pressure and Wave Form Analysis
Wave Form Analysis describes (pressure) wave shapes and has been shown to have relations with cardiovascular events. The (pressure) wave is often assumed to be determined by arterial system, while in principle the heart contributes as well. Total Peripheral Resistance (TPR) can be calculated from mean pressure (assuming negligible venous) pressure and mean flow. The decay time of diastolic pressure (time constant, τ) is determined in diastole when flow is negligible. The time constant equals Total Peripheral Resistance times Total Arterial Compliance (τ = TPR·TAC) and is determined by arterial properties only. Using the ratio of mean aortic pressure and Cardiac Output to calculate TPR the TAC = τ/TPR. More methods have been proposed to derive TAC, for an overview see Ref. 16 The ratio of Stroke Volume and Pulse Pressure (Systolic minus Diastole pressure) has been suggested as straightforward measure of total arterial compliance but several studies have shown its overestimation and limitations.16,17 While τ only requires pressure information, all methods to derive TAC or TPR require the measured pressure wave and (mean) flow. Up till now there is no universally accepted way to derive TAC from pressure alone.
Using pressures at different locations, wave speed (PWV or c) can be derived and wave amplification (increase in systolic and Pulse Pressure towards the periphery) can be studied. Aortic wave speed is an accepted and non-invasive method, pressure signals do not require calibration, to estimate aortic compliance,18 a possible therapeutic target.19 It should be remembered that the equations of PWV are based on the assumption of a uniform tube without reflections. By using the foot of the pressure waves as time points, the effect of wave reflections is assumed minimal. One can estimate area compliance as CA = dA/dP = A/ρc2 (Newton-Young, Frank, Bramwell-Hill) or Young modulus (E, a material constant) as E = ρ(D/h)c2, (Moens-Korteweg) with c = PWV, A = area, P = pressure, ρ = blood density, D = (internal) diameter and h = wall thickness. The so-derived arterial compliance (or stiffness) is an arterial parameter.
Wave amplification, i.e., most often expressed as the ratio of distal over proximal Pulse Pressure20,21 predicts cardiovascular events. Wave amplification depends on heart and load. The amplification depends on many reflections and a simple basic theory explaining the amplification quantitatively is still lacking.
Aortic Pressure augmentation index (AIx, Fig. 4) is defined as the ratio of the Augmented Pressure over Pulse Pressure,22 the ratio implies that calibration is not necessary, but it depends on heart and arterial load. The infection point and shoulder point are the moments of the measured pressure wave used to calculate the AIx.23 The AIx has been shown a predictor of cardiovascular events.24 In a model study the change in timing of the shoulder point, the inflection point and return time of the reflected wave with aging (represented as increase in PWV and Stiffness) was worked out, as shown in Fig. 4.2 Assuming a uniform tube of 50 cm length, the theoretical return time equals 2·0.5 m/PWV and is also shown in Fig. 4. It may be seen that all three times differ and behave differently with increasing PWV (stiffness). Assuming the shoulder point as return time of the reflected wave it was reported in a large meta-analysis that this reflection time (on average 136 ms) changed only 0.71 ms/year over the age range of 10–90 years.25 With an increase by a factor 2 in PWV over this age range26 one would predict a factor 2 decrease, which is much more than the decrease by about 30% reported by Baksi et al. (their Fig. 4).25 Or, inversely PWV cannot be derived from the shoulder or inflection point of aortic pressure as was suggested27 earlier since this calculation is based on the assumption of a uniform tube with a single reflection site at its end. However, Weber et al. showed that through sophisticated modelling PWW can obtained from a peripheral wave shape.18 The interpretations of return time, inflection point and shoulder point are based on two assumptions, namely that the arterial system is a uniform tube with a single reflection site at its distal end, and that the heart does not affect wave shape. Both assumptions are incorrect.
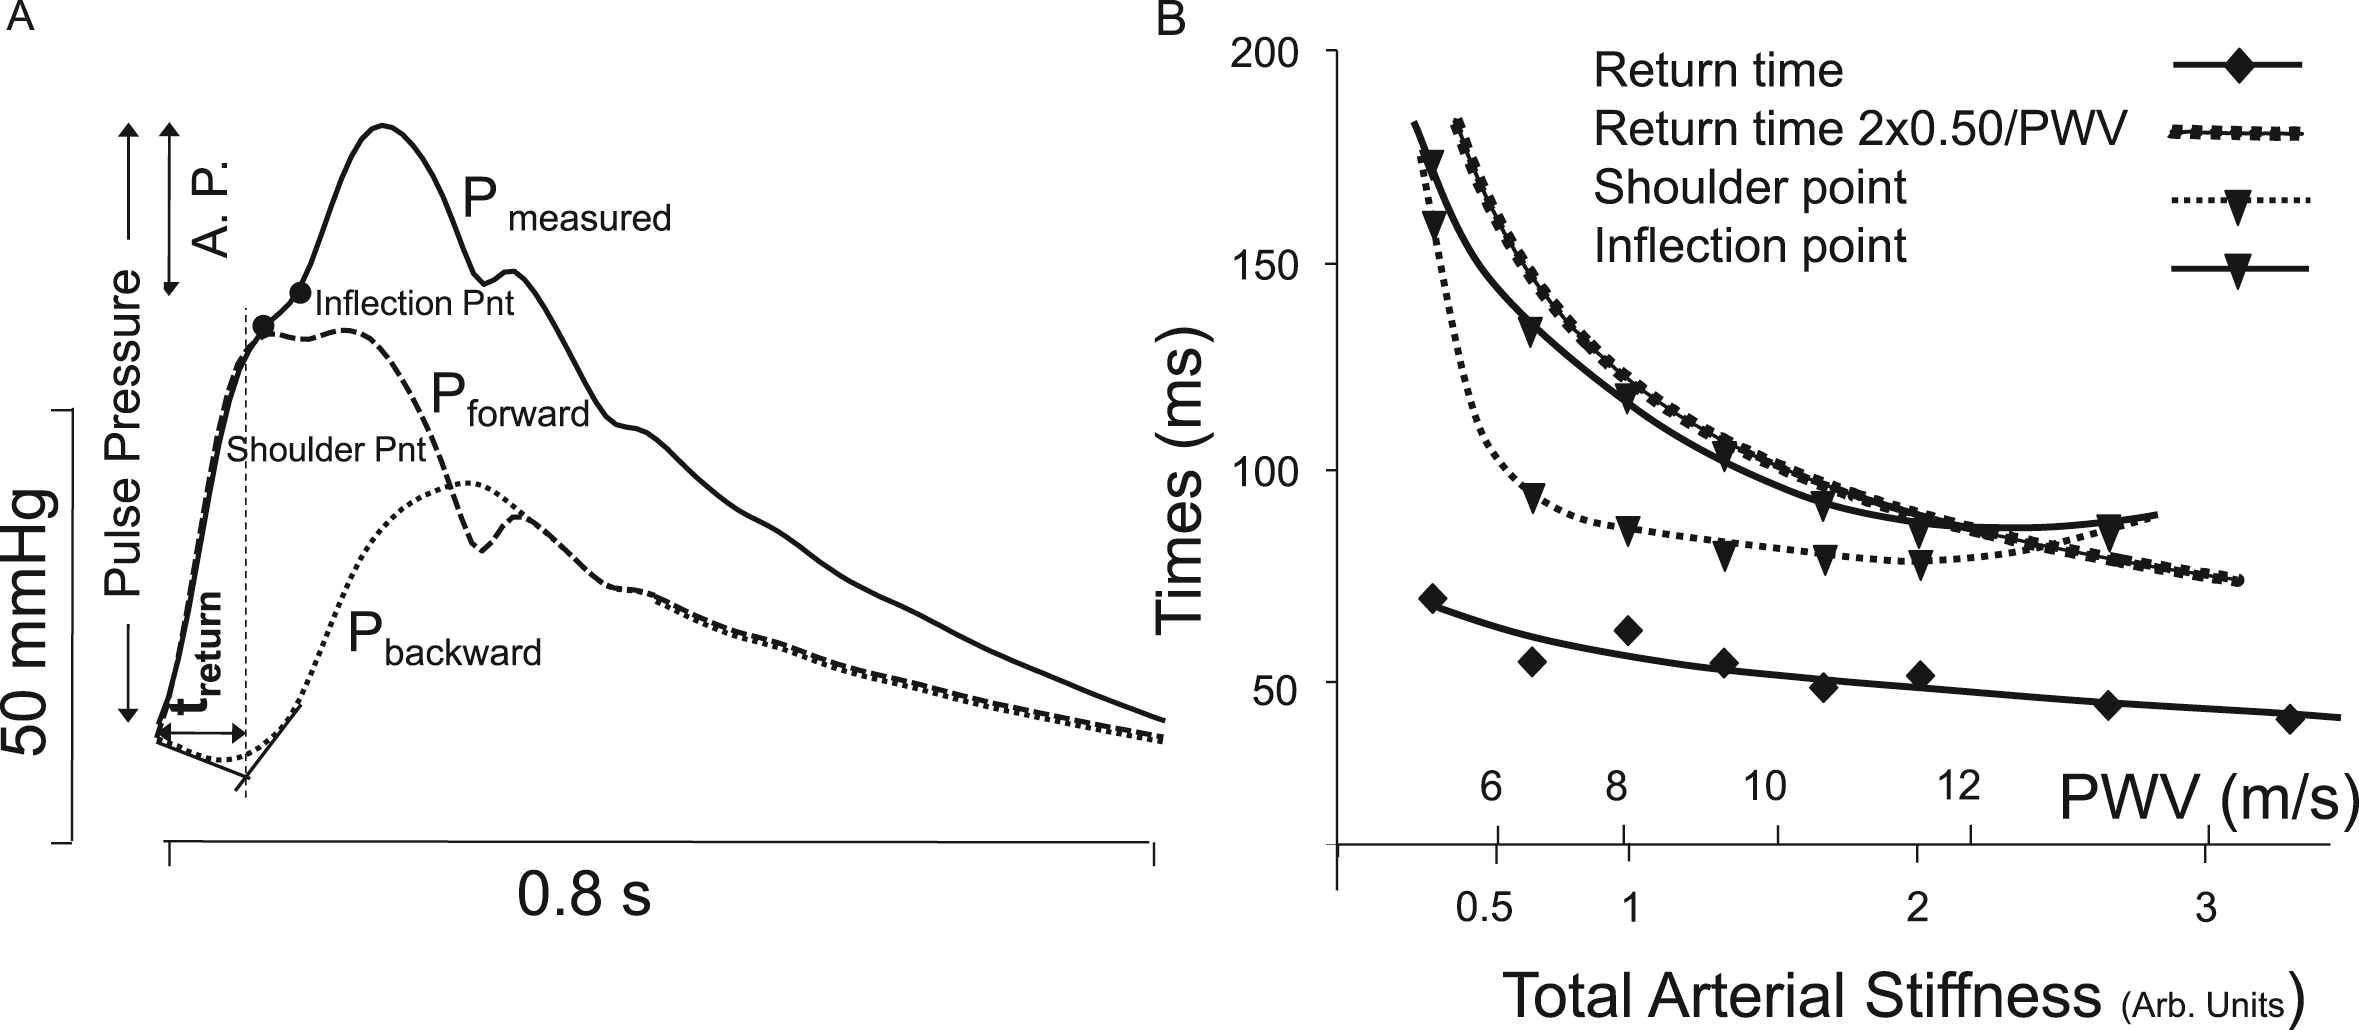
Examples of Wave Form Analysis. Panel A: Parameters derived from the (ascending aortic) pressure wave are studied. The ratio of augmented pressure relative (A.P.) to Pulse Pressure is the Augmentation Index. The return time of the reflected wave, treturn and the shoulder and infection points are shown. Panel B: The return time, timing of inflection and shoulder points all depend on aortic Pulse Wave Velocity, a measure of arterial stiffness. When a single reflection site at l = 50 cm is assumed the theoretical return time equals 2l/PWV = 100/PWV. Adapted from Westerhof & Westerhof.2
In summary: from pressure wave shape alone changes in arterial properties are not quantifiable. Pressure together with flow (CO or SV) is needed to estimate TPR and TAC, and they give information on the arterial system as a whole (see below, The Windkessel model). Diastolic pressure decay time, with the assumption of negligible flow in diastole allows estimation of arterial RC-time, and PWV allows estimation of aortic compliance. Both are arterial properties. However, analysis of the pressure wave shape gives little information on the arterial tree, since a uniform tube with single reflections site is not a good model of the system.28
Wave Intensity Analysis
Wave Separation Analysis (WSA) uses pressure and flow; Wave Intensity Analysis (WIA) uses pressure and flow velocity. However, we here use flow rather than velocity for easier comparison. Both WSA and WIA allow separation of pressure and flow waves in their forward and backward (reflected) waves. While WSA uses measured pressure and flow, WIA originally were expressed as differences, dP = P(t + Δt) − P(t) and dQ = Q(t + Δt) − Q(t), WI is then in mmHg·ml/s or Watt.29,30 In practice the Δt is often not specified making comparison between papers quantitatively impossible. If presented by derivatives dP/dt and dQ/dt, calibration is included and WI units are mmHg·ml/s3 or W/s2. Figure 5 shows that differentiation of pressure and flow, as used in WIA, emphasizes the rapid changes in the waves with their product showing even extra-large WI in early and late ejection, and with very small WI in diastole. Thus it is the differentiation with respect to tine that causes the low WI in diastole but the actual waves are present, this does not mean that diastole is wave free.
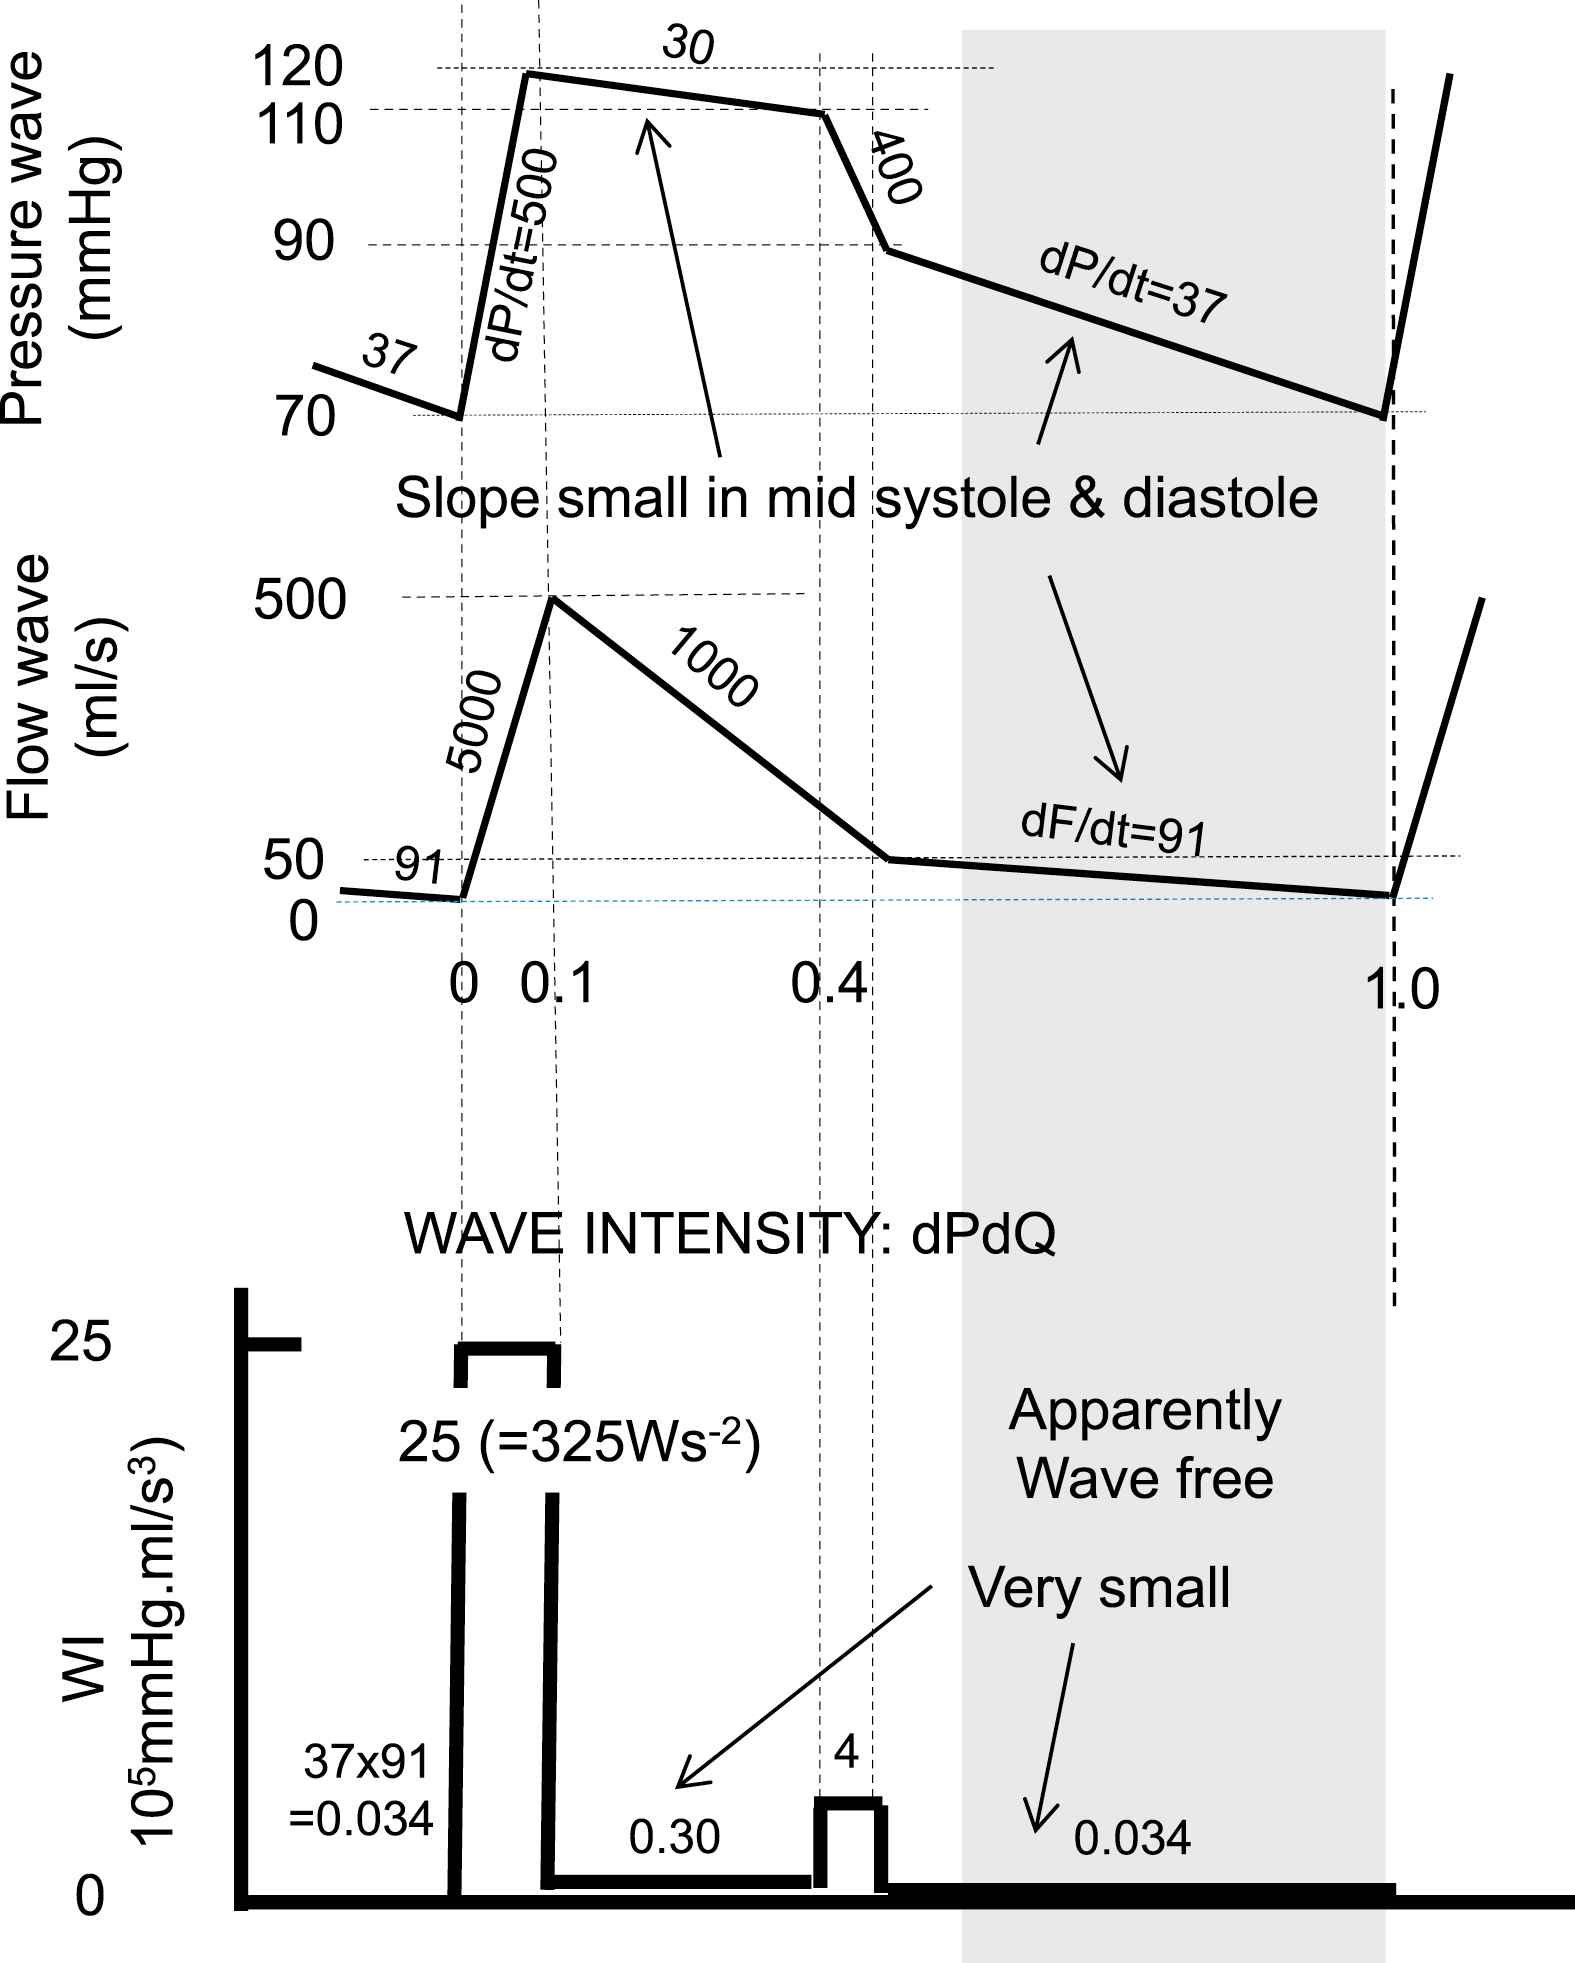
Simplified pressure and flow waves to illustrate the effect of taking derivatives, as performed in wave intensity analysis. During early and late ejection changes in pressure and flow are strongest and their derivatives are large. Multiplication of dP/dt and dQ/dt emphasizes this effect even more. In diastole (shaded area) Wave Intensity is small but waves are present. With dP/dt in Pa/s or mmHg/s and dQ/dt in m3/s2 or ml/s2, WI is in Ws−2 or in mmHg·ml/s3.
Separation is as in Wave Separation Analysis, with dP+ being dPforward/dt etc.
With these derived of dP+ and dP− and subsequent integration the Pforward and Pbackward are obtained.
In summary Wave Intensity is a power-like quantity with units Ws−2 when based on volume flow. It allows for separation of waves and in this respect WSA and WIA are simply related by differentiation – integration. WSA shows that pressure and flow waves are present during the entire cardiac cycle, while WIA, by differentiation, suggests that diastole (diastasis) is a ‘wave free period’. Both dP and dQ depend on heart and load, and so is dPdQ.
The assumption of the ‘wave free period’ resulted in 2 new approaches in wave analysis, The assumption of the ‘wave free period’ resulted in 2 new approaches in wave analysis: the Reservoir-Wave Approach, RWA,4,31 and the instantaneous wave-Free (pressure) Ratio.5,32
The Reservoir-Wave Approach
Starting point of the Reservoir-Wave Approach (RWA) is the assumed ‘wave free period’ in diastole, where ‘wave free’ is thought to imply that pressure and flow do not travel and are not waves. When diastolic pressure is exponentially decaying the two and three element Windkessel mimic diastole well (see below). However, in systole Frank’s Windkessel does not describe pressure correctly. This was solved by Westerhof with the introduction of aortic characteristic impedance as a third Windkessel element.33 Lighthill on the other hand introduced an excess pressure, Pexc, being the difference between measured aortic pressure and the pressure predicted by Frank’s Windkessel31 Wang et al.4 showed that the excess pressure is predicted by the product of aortic flow and aortic Zc, Pexc(t) = Zc·Q(t), in agreement with the three-element Windkessel.33
The Reservoir-Wave Approach is now described as follows (Fig. 6): it is assumed that measured aortic pressure is “the instantaneous sum of a constant (Pinf), a Windkessel or reservoir pressure (Pres), and a wave-related pressure (excess pressure), Pexc”.34 The Pinf is the central arterial pressure reached after a long (several heart periods) asystole. The excess pressure has also been called Wave Pressure.35 The Pres was also mentioned as “The pressure due to the increase in arterial volume is not, fundamentally, due to waves. This component is the pressure generated by filling and emptying Otto Frank’s Windkessel”.36 The reservoir pressure is thus assumed to be related to (aortic) volume.4,37 Taken together: the reservoir (Windkessel) pressure is assumed not to be a wave, and proportional to aortic volume, while the excess pressure results from waves. However, Segers et al.38 have shown that when aortic coarctation was modelled the assumed relation between intra-aortic volume and reservoir pressure was not found.
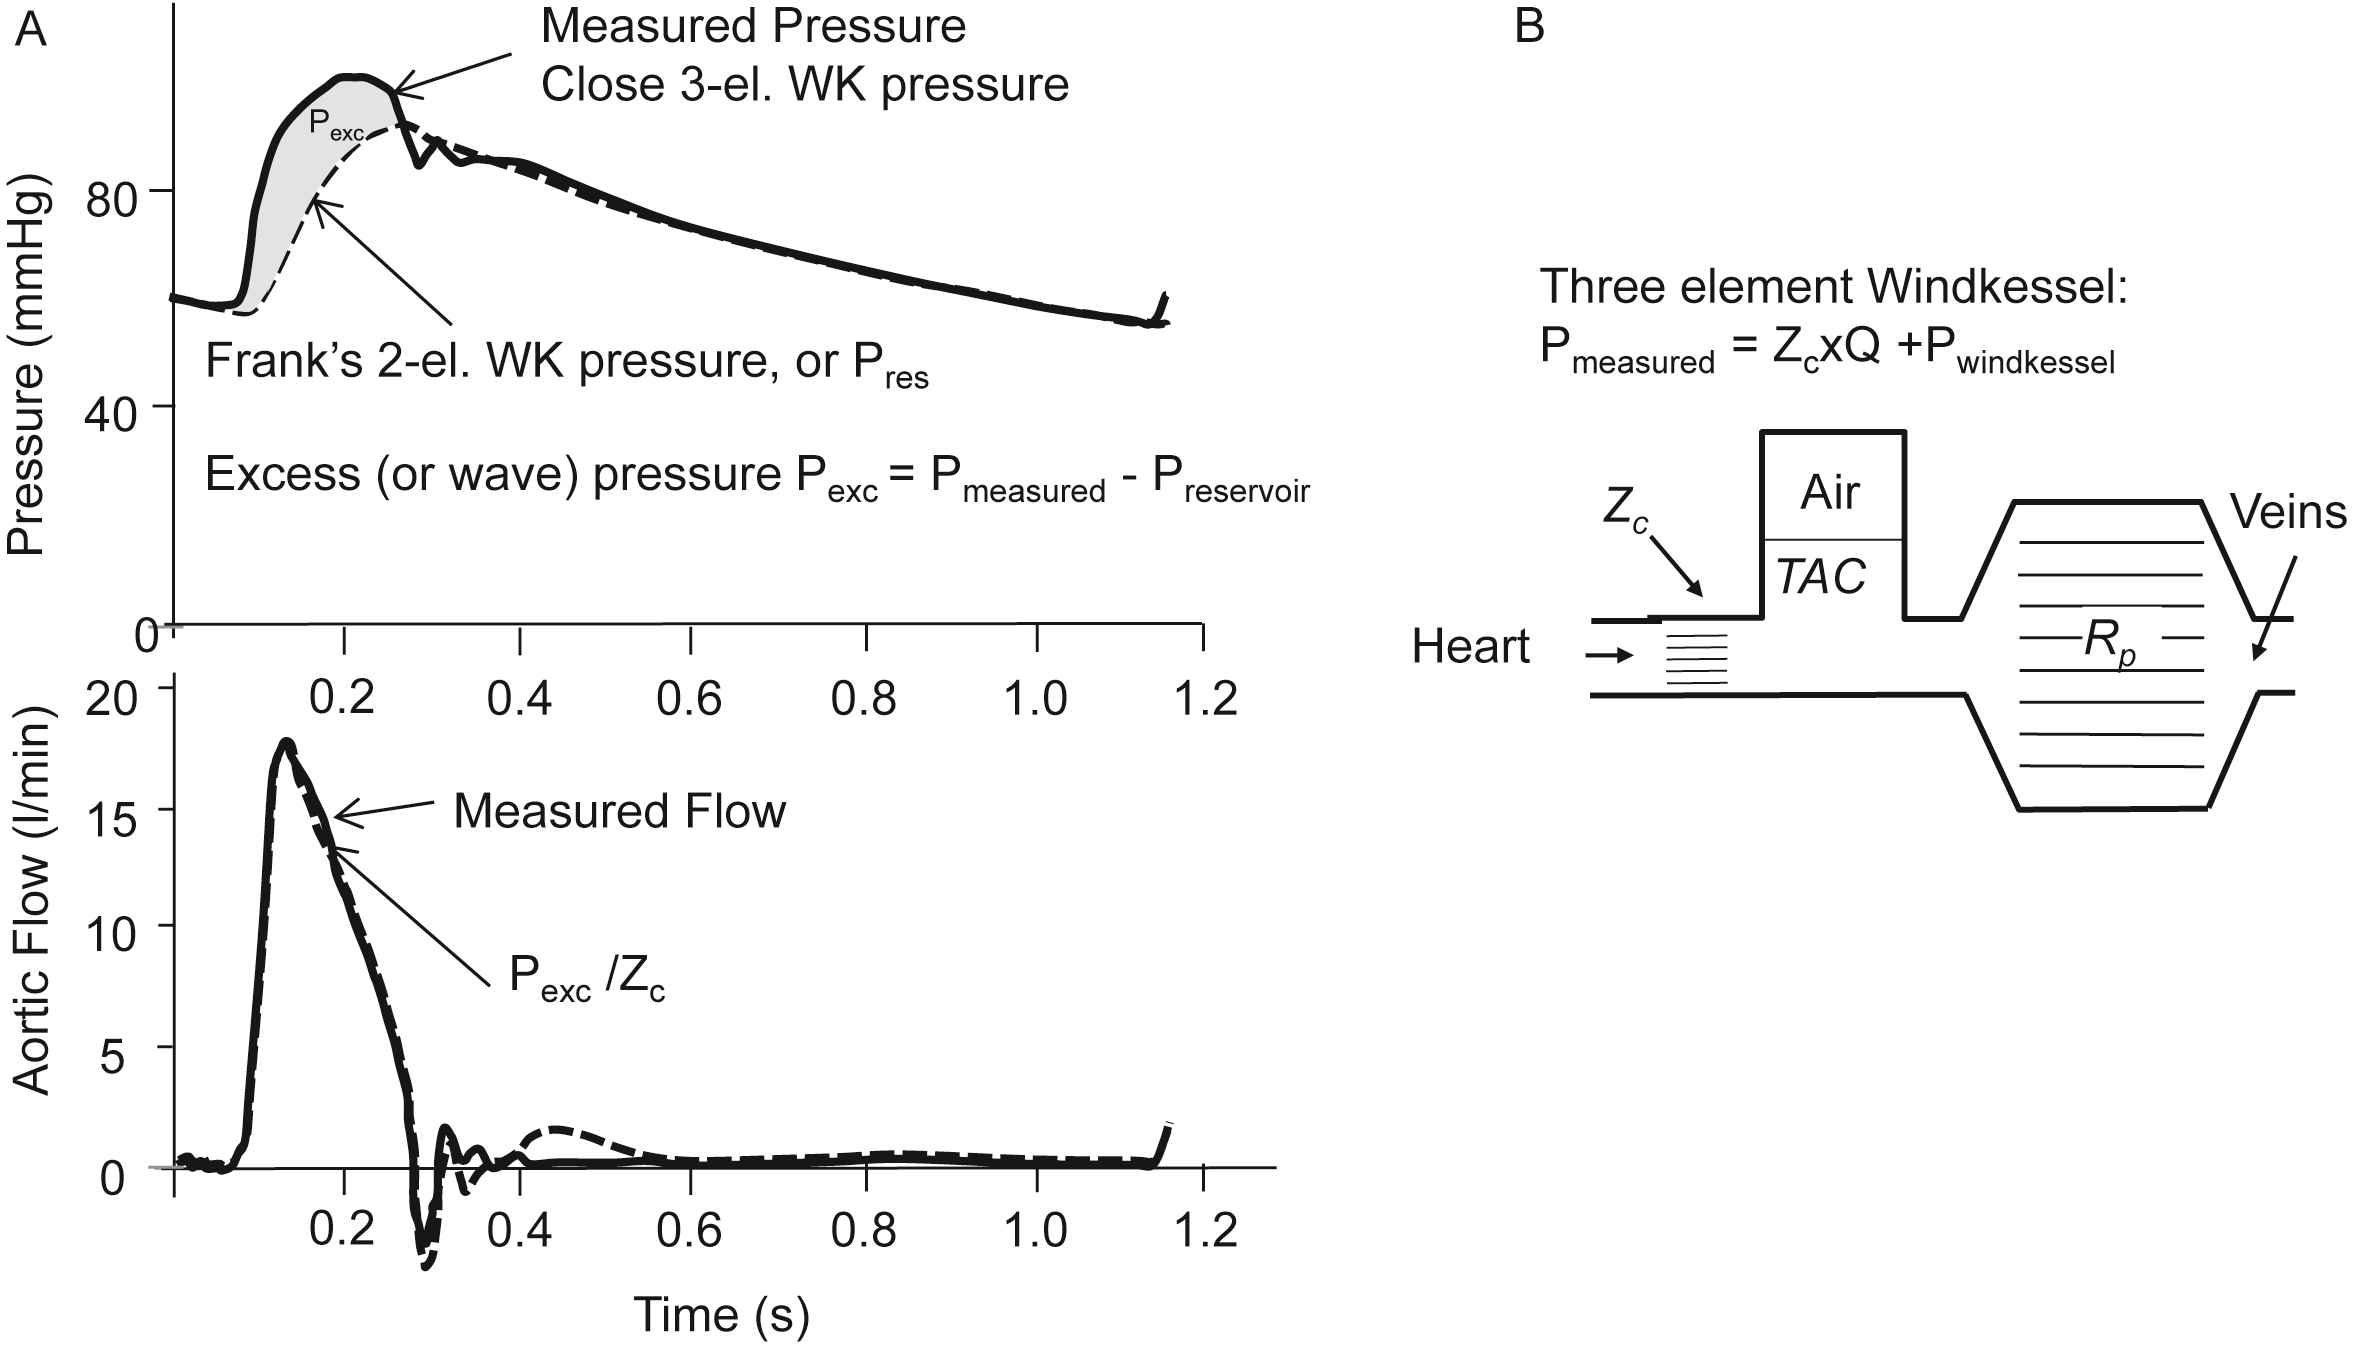
The Reservoir-Wave Approach. Panel A: Pressures (top) and flow (bottom). The two-element (Frank’s) WK consists of a Compliance and Resistance only, and with measured flow as input results in the so-called Windkessel or reservoir pressure (dashed line). In diastole the reservoir pressure is close to measured pressure. In systole measured pressure minus reservoir pressure is the excess pressure, which is close to flow times Zc. Adapted from Wang et al.4 Panel B: The three-element Windkessel. When measured flow is fed into the three-element Windkessel the predicted pressure both in systole and diastole is close to measured pressure.
The Reservoir Wave equals twice the backward pressure wave: 2Pbackward. This can be shown as follows. The forward and backward waves according to WSA analysis are given above (eq. (1)).
Hametner et al. have indeed shown in patients that Pbackward and Preservoir relate very strongly in patients with Preservoir = 2.01·Pbackward, R2 = 0.94.39 The backward pressure (Preservoir/2) derived at different locations shows that it arrives later in the distal aorta, see Fig. 3.15 It does travel and depends on time and location and is by definition a wave.
The wave-related part of pressure is assumed to be present in the Pexc (or Pwave). However, when Pexc is split in its forward and backward waves the reflected part of the wave is negligible.33,34 The limited amount of reflection found in Pexc is understandable since it holds that Pexc = Zc Qmeasured implying that Pexc and measured flow have similar wave shapes and Wave Separation then results in negligibly reflected waves (see eq. (1b)). See also the work by Mynard et al. in criticizing the concept of reservoir pressure and excess pressure.8,40,41
In summary, we show that the reservoir pressure is a wave, and it was also shown that the excess pressure is almost reflection-less. This then would result in negligible reflection overall. This makes the RWA inconsistent in itself.
The instantaneous wave Free Ratio (iFR)
The instantaneous wave Free Ratio, iFR, is defined as ratio of proximal pressure and distal pressure (of a stenosis) in the latter 75% of diastole, the so-called ‘wave free period’. The iFR has been proposed for the coronary arterial system to avoid the need for vasodilation in the estimation of stenosis severity.5,29 One strength of the use of diastole, although not a wave free period, is that the effect of cardiac contraction on the coronary vasculature is minimized. The iFR is based on WIA with the assumption of a ‘wave free period’. The extra assumptions are that, in this period, the ratio of pressure and flow (instantaneous, or mean over ‘Wave Free period’) is a measure of resistance (Fig. 7) and that this “Intracoronary resistance is naturally constant and minimized during the wave-free period”.5 We here illustrate the assumptions on which the iFR is based for the systemic circulation rather than the coronary vasculature.
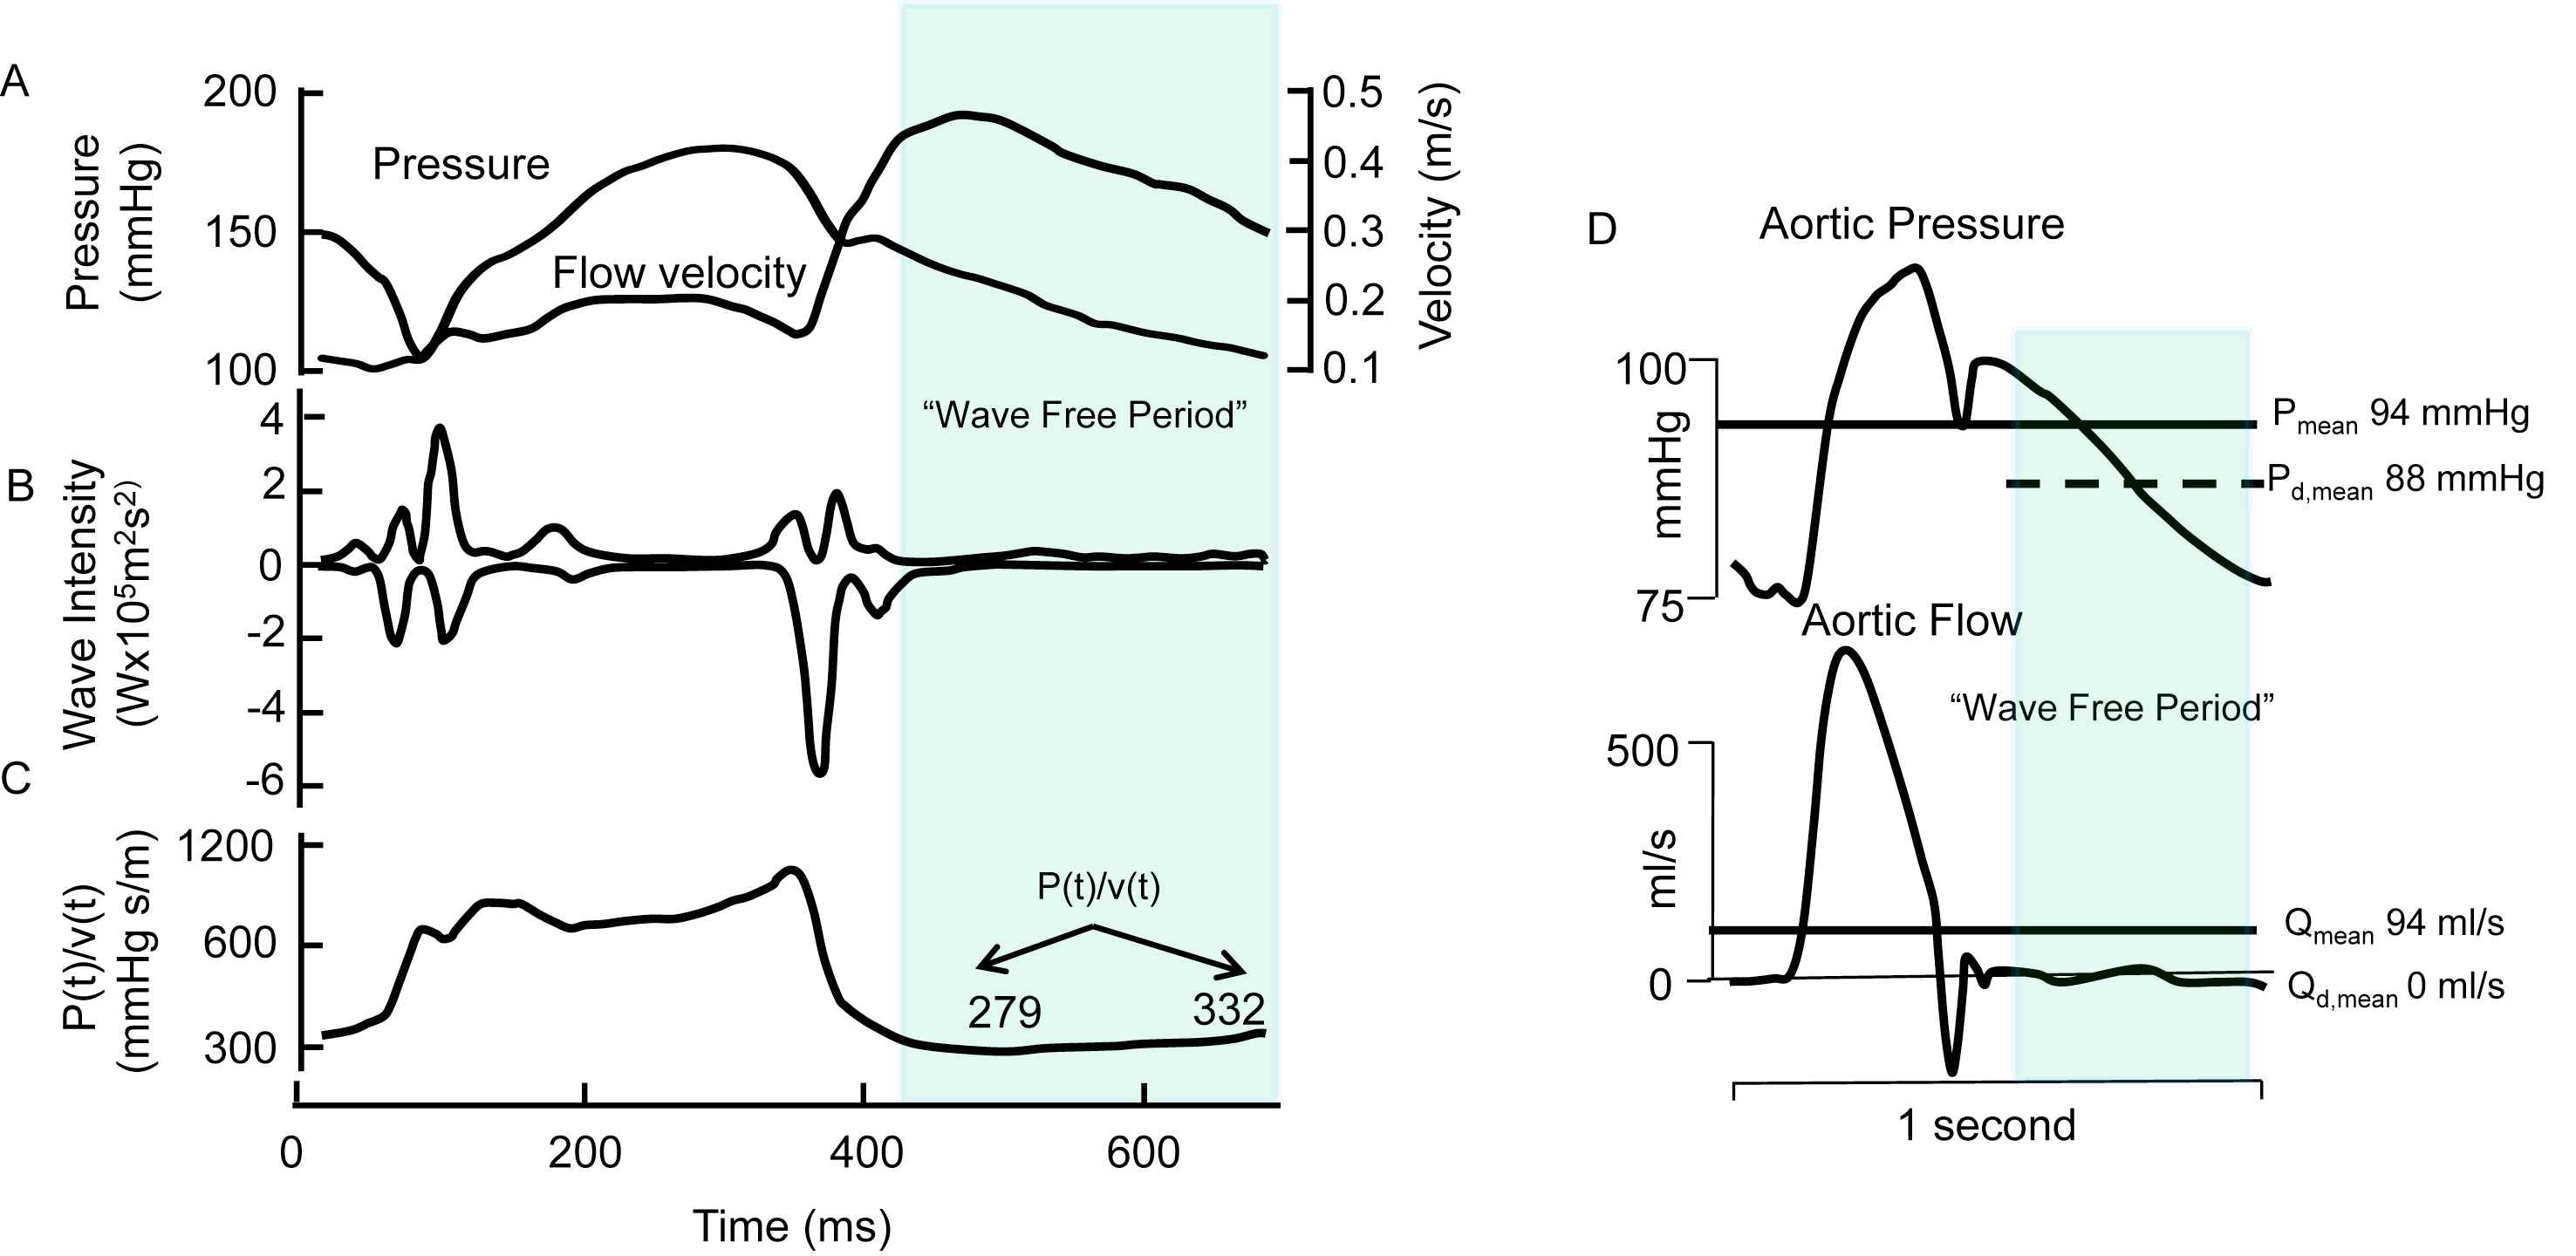
The instantaneous wave Free Ratio. Panel A: Pressure and flow velocity measured in coronary artery. Panel B: Wave intensity with suggestion of ‘wave free period’, indicated by the shaded section. Panel C. ‘Resistance’ as calculated form the moment-to-moment ratio of pressure and flow velocity. This calculation violates Ohm’s law, and the so derived ‘apparent resistance’ varies within a heartbeat. Next to assuming a ‘wave free period’ and deriving instantaneous pressure–velocity ratio it is assumed that “Intracoronary resistance is naturally constant and minimized during the wave-free period” (Adapted from Sen et al.5). Panel D: example of the instantaneous Pressure-Flow ratio applied to aortic pressure and flow. While true resistance is equal to Pmean/Qmean (about 1 mmHg s/ml) the instantaneous ratio of pressure and flow in diastole, where flow is zero, is infinity.
Resistance can only be calculated from the ratio of mean pressure drop and mean flow (Ohm’s law). The invalid way of calculating resistance from part of the cardiac cycle may be understood from the ratio of aortic pressure and flow in diastole (Fig. 7D). Since flow in diastole is zero, the ratio of diastolic pressure and diastolic flow results in infinite values. Also resistance cannot change over the cardiac cycle, as suggested from Fig. 7, since the smooth muscle in the arterial wall is too slow. Moreover, Nijjer et al.42 recently showed that coronary ‘microvascular resistance’ calculated over the ‘wave free period’ decreased from 4.5 to 1.6 vasodilation (hyperemia). In other words, this ratio is not naturally minimized.
In summary, iFR is based on the erroneous assumptions of a ‘wave free period’, is violating Ohm’s law and the so derived pressure flow ratio is not minimized. Association studies have shown associations of iFR with Fractional Flow Reserve,32 but has also been criticized.43,44
The Windkessel model
The arterial system has been characterized by Windkessel models, these lumped models do not contain waves since they apply to a single location. The (two-element) Windkessel model, popularized by Otto Frank, assumes a resistance, mimicking the periphery (TPR) and a compliance representing the (total) compliance of the aorta and conduit arteries (TAC). This model is quite good during diastole but falls short in systole (Fig. 8). The three-element Windkessel adds a third element to Frank’s model, namely aortic characteristic impedance.33,45 The introduction of Zc was based on input impedance information.33 The mean pressure – mean flow ratio gives the peripheral resistance, and one is, as it were, looking far into the system. For intermediate frequencies impedance is determined by arterial compliance, which is located closer to the heart. For high frequencies reflections, returning from many sites, cancel and aortic characteristic impedance (close to the heart) is obtained (Fig. 8).
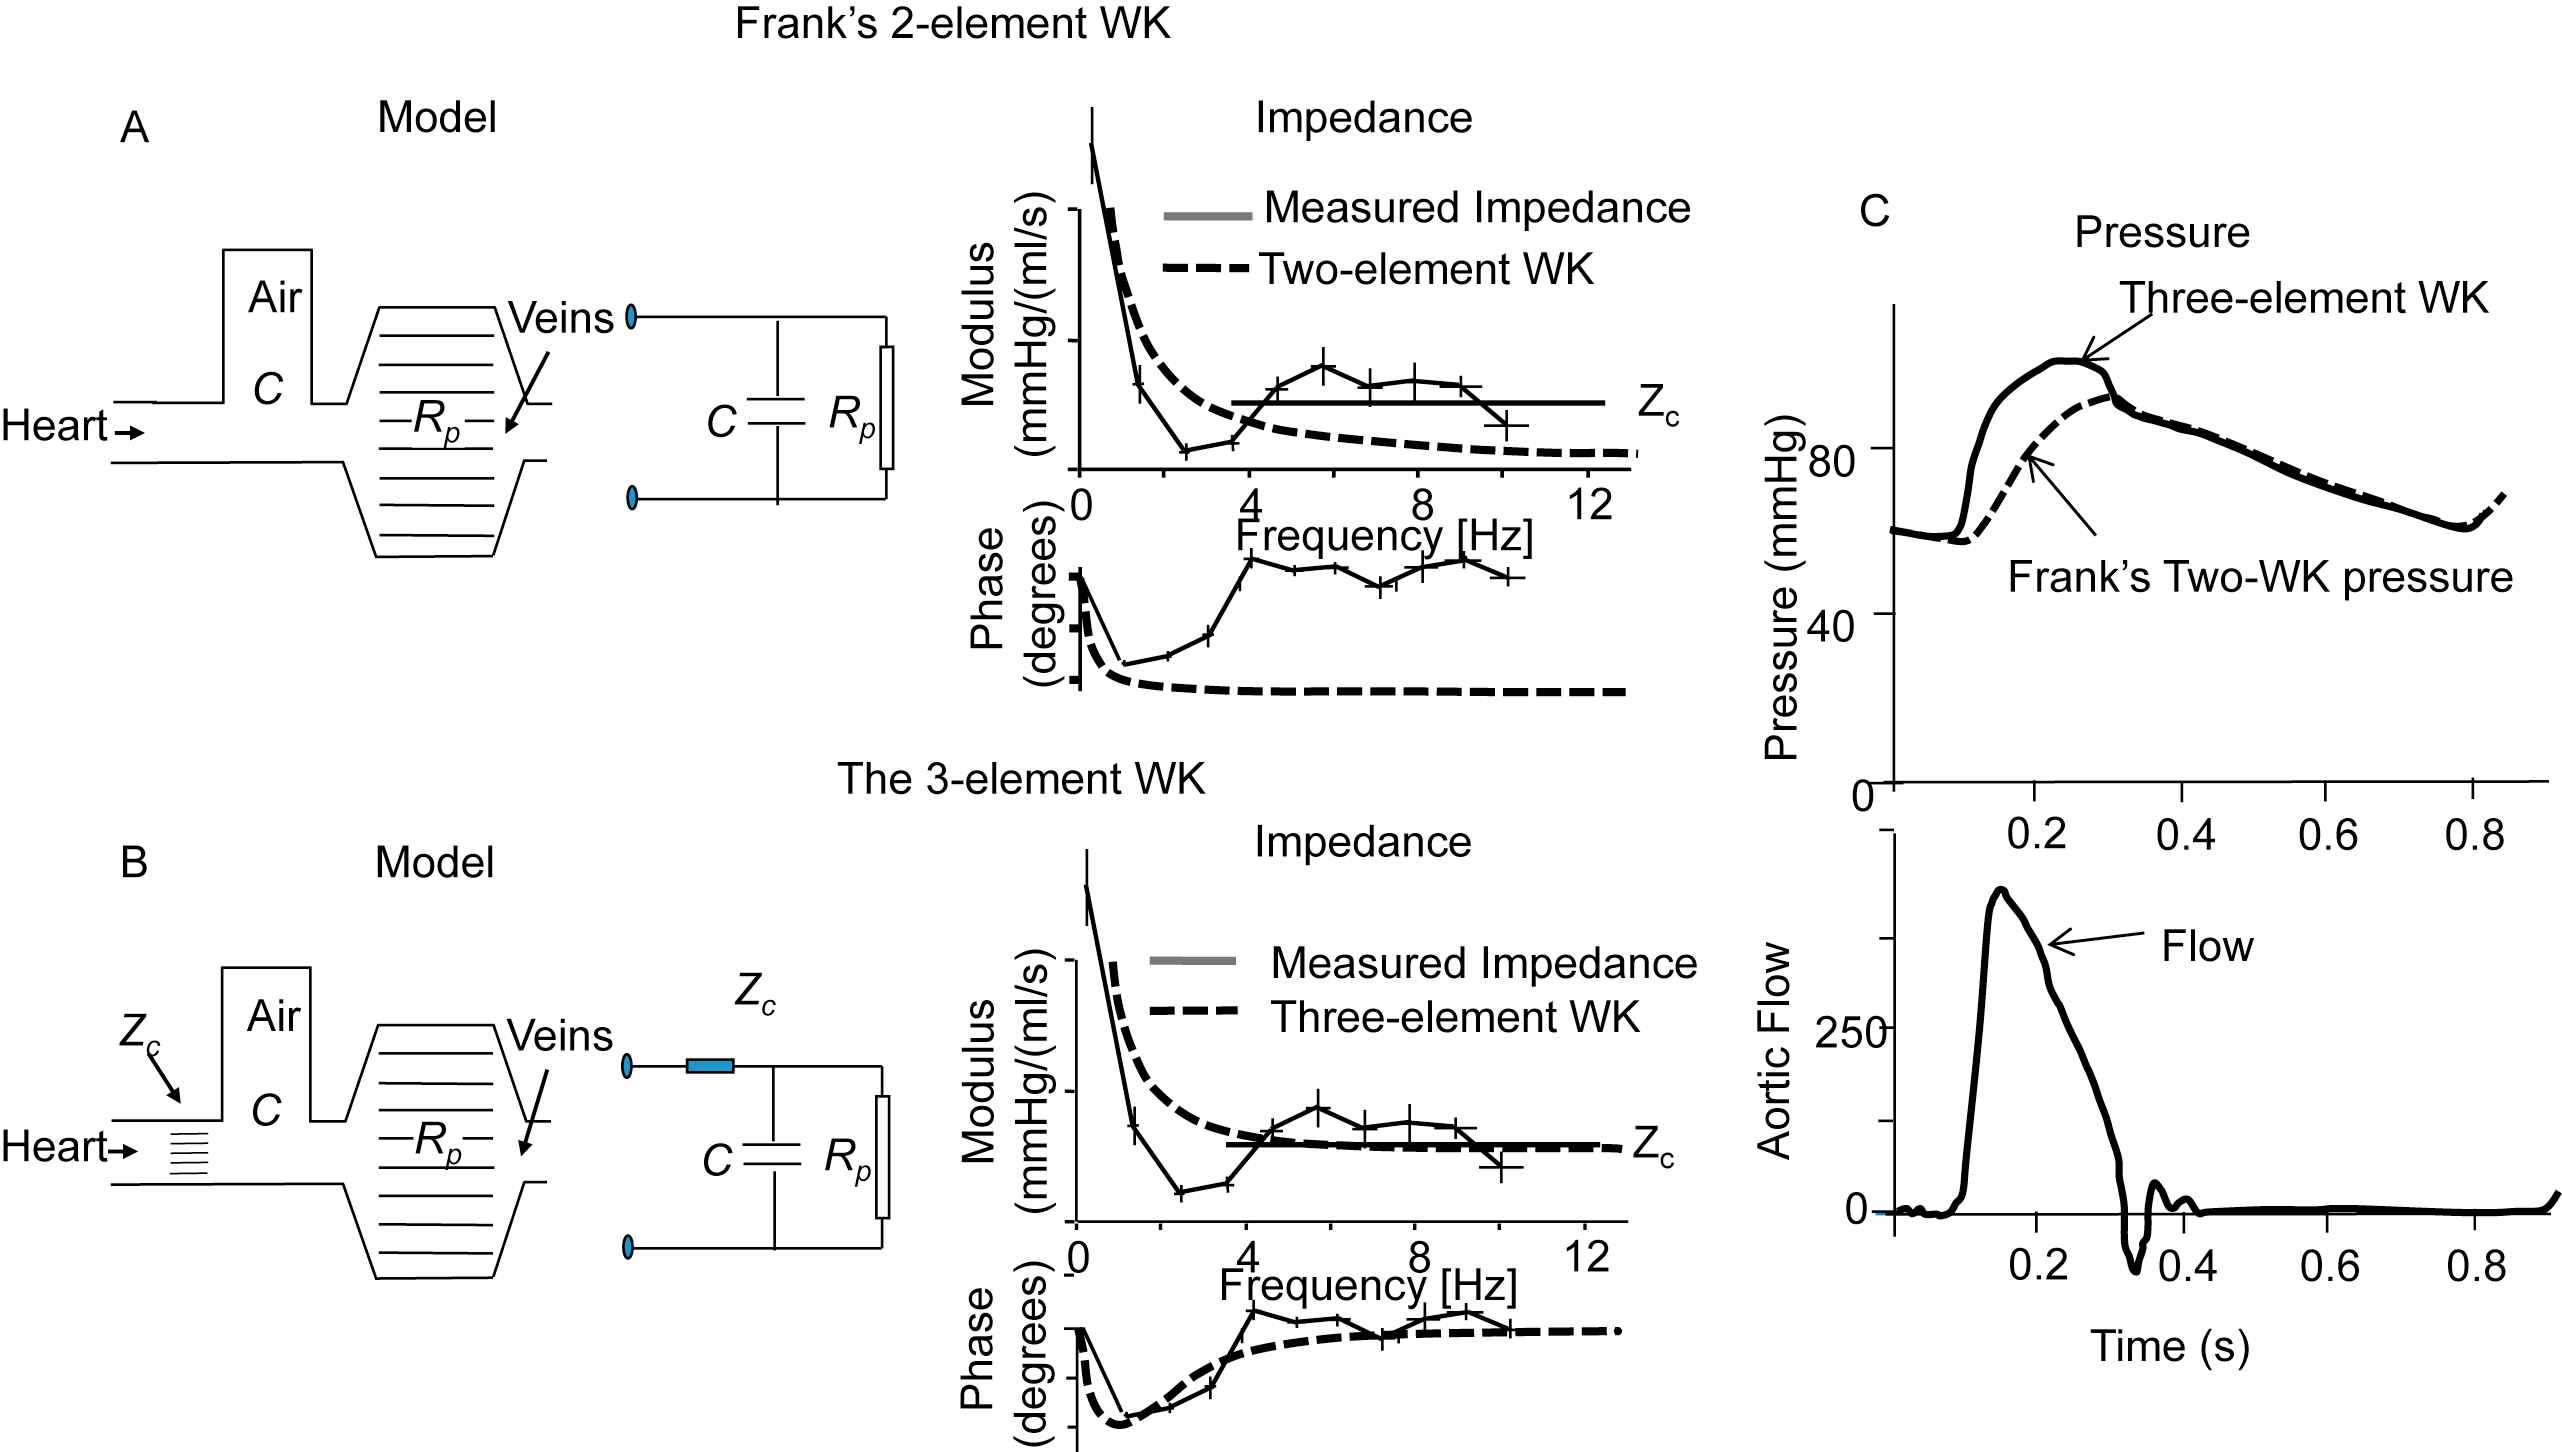
The Windkessel Models. Panel A: The Frank Windkessel or 2-element WK in hydraulic and electrical form. Input impedance of the 2-element WK (dashed lines) and actual input impedance derived from measured pressure and flow. Panel B: The 3-element WK in hydraulic and electrical form. Input impedance of this WK (dashed lines) and actual input impedance derived from measured pressure and flow. The 3-element WK approaches the real impedance better than the 2-element WK, especially at higher frequencies. Panel C: the pressure predicted by the two-element (dashed) and three-element Windkessel (fully drawn) with flow (bottom) as input. Adapted from Westerhof et al.45
This three element model has an input impedance and results in an aortic pressure close to the measured input impedance and measured pressures and flows. It can be used to study effect of arterial changes on the (isolated) heart.46,47 When PWV is high, thus compliance is small, as in the elderly; its behaviour is closer to reality than in a compliant, young, arterial system. Limitations have been discussed by Segers et al.48 It may be seen that, for instance during the Valsalva manoeuvre (Fig. 2), the TAC increases so much that the role of peripheral resistance is minimized and characteristic impedance mainly determines the relation between measured pressure and flow.
Windkessel models can describe a system consisting of compliant and resistive arteries with waves present, but cannot tell us whether or not the system contains waves, or in other words (time and location dependent) waves are not existent.
The three-element Windkessel is not a good model to use in the estimation of TAC. This is the consequence of the fact that the characteristic impedance is modelled by a resistor. Characteristic impedance is not a resistor but a lossless quantity accounting for acceleration of blood into an elastic aorta, Zc2 = L/C with inertia L = ρ/A and C = dA/dP. Modelling Zc as a resistor makes the impedance for mean pressure and flow TPR + Zc rather than TPR, while Zc is a lossless parameter. To compensate for this resistance-like property and extra mass term was introduced representing total arterial inertance.49,50 This fourth element indeed improves the model, but this element is difficult of derive quantitatively from pressure and flow measurements.51
In summary, Windkessels are modelling pressure and flow quite accurately, giving understandable, overall estimates of arterial parameters such a TPR and TAC. The models give information at the chosen location and do not contain information on waves and wave reflection. Windkessels model the arterial system but the arterial system is not a Windkessel.
Conflict of interest statement
NW and BW have no conflicts of interest to declare.
Support
Berend Westerhof is supported by
References
Cite this article
TY  - JOUR
AU  - Nicolaas Westerhof
AU  - Berend E. Westerhof
PY  - 2017
DA  - 2017/03/31
TI  - Waves and Windkessels reviewed
JO  - Artery Research
SP  - 102
EP  - 111
VL  - 18
IS  - C
SN  - 1876-4401
UR  - https://doi.org/10.1016/j.artres.2017.03.001
DO  - 10.1016/j.artres.2017.03.001
ID  - Westerhof2017
ER  -