
Arterial stiffness: From surrogate marker to therapeutic target☆
This article was presented as lecture during the symposium on “Arterial stiffness: a translational approach” at the ARTERY 14 Congress in Maastricht, the Netherlands (October 9–11, 2014).
- DOI
- 10.1016/j.artres.2016.01.001How to use a DOI?
- Keywords
- Pulse wave velocity; Arterial stiffness; Target organ damage; Hypertension guidelines
- Abstract
Carotid-femoral (aortic) pulse wave velocity (PWV) is the modern benchmark for the assessment of arterial stiffness. Current European hypertension guidelines acknowledge the good cardiovascular (CV) predictive value, reproducibility and cost-effectiveness of PWV. Aortic PWV is an asset to classical cardiovascular risk scores and can reclassify patients. Reference values for carotid-femoral PWV have been established. Together with standardisation of user procedures and patient conditions, these reference values are needed for an appropriate use of aortic stiffness in daily clinical practice. Finally, the existing evidence for a decrease in CV risk by decreasing aortic stiffness is discussed.
- Copyright
- © 2016 Published by Elsevier B.V. on behalf of Association for Research into Arterial Structure and Physiology.
- Open Access
- This is an open access article distributed under the CC BY-NC license.
The aim of this article is to review how arterial stiffness has become an important asset in cardiovascular risk (CV) stratification and a therapeutic target in patients with elevated CV risk. It also deals with current views on standardisation of methods to make arterial stiffness suitable for use in daily clinical practice.
Aortic stiffness and CV risk
In the nineties of the previous era arterial stiffness was found associated with many cardiovascular risk factors such as age, hypertension, diabetes, insulin resistance, hypercholesterolemia, hyperhomocysteinemia and acute effects of smoking.1 These findings were followed by numerous studies showing that carotid-femoral (aortic) pulse wave velocity (PWV) was an independent risk factor for CV disease and events.1 A meta-analysis of 17 longitudinal studies showed that an increase in aortic PWV of 1 m/s independently of other risk factors increases the relative risk of both all-cause and CV mortality by 15% (p < 0.001).2
In the Framingham Heart Study, a large population study, aortic stiffness was a clear predictor of incident hypertension and major cardiovascular events, while augmentation index, pulse pressure amplification and central pulse pressure did not show any predictive value.3,4
Aortic stiffness is the gold standard
The predictive value of arterial stiffness differs between vascular territories. Carotid-radial PWV, including muscular arteries of the upper limb, did not predict CV events,4 while carotid-ankle and heart-ankle PWV, including the aorta and muscular arteries of the lower limbs were predictive.5,6 But head-to-head comparison of the latter 2 with carotid-femoral PWV is lacking.
Like the aorta, the common carotid artery (CCA) is an elastic artery. However, early studies on the predictive value of CCA stiffness are not unequivocal. In patients with end-stage renal disease and after kidney transplantation7,8 CCA stiffness was an independent predictor of CV disease, but not in population-based studies like SMART9 and the Rotterdam Study.10 On the contrary, the more recent Hoorn Study, also a population study but with excess of diabetes patients, showed predictive value of carotid and femoral artery stiffness. But these predictive values differed from aortic stiffness.11 A recent systematic review and meta-analyses of aggregate and individual patient data confirmed the results of the Hoorn Study on carotid artery stiffness being predictive of CV events and CV and all-cause mortality.12
Aortic PWV also helps reclassify patients to higher or lower risk groups. This was first shown by Boutouyrie et al.13 In hypertensive patients the risk for a primary coronary heart disease within 6 years increased with increasing Framingham risk score (FRS) and with aortic stiffness. But in patients within the highest tertile of aortic stiffness and the lowest tertile of FRS, this risk was similar to those with the lowest aortic stiffness and highest FRS, showing that arterial stiffness can correct risk over-as well as underestimation by FRS. Other studies confirmed that aortic stiffness can reclassify patients not only to higher and lower risk measured by FRS but also by SCORE.14,15 Carotid stiffness also improved stroke risk prediction beyond Framingham and aortic stiffness, but not of coronary heart events.12
In addition, Paini et al. found the effect of ageing being similar on CCA and aorta stiffening when no CV risk factors were present. But in the presence of CV risk factors like hypertension and diabetes, the aorta showed an accelerated stiffening with ageing compared to the CCA, suggesting a better than CCA predictive value of aortic stiffening.16
Based on all these results aortic stiffness measured as carotid-femoral PWV is considered the gold standard and entered the 2007 joint guidelines of the European Societies of Cardiology (ESC) and Hypertension (ESH) as target organ damage.17
Standardisation of carotid-femoral PWV is urgently needed
Pulse wave velocity is calculated from the distance and time travelled by a pulse wave. Whereas the travel time of carotid-femoral PWV can be measured accurately, the non-invasive estimation of the travel distance was not standardized. Numerous methods exist to estimate the travel distance: the direct distance between the measurement sites at the carotid and femoral arteries, promoted by the Complior®, overestimates the travelled path length by 25%, while the subtracted distance using the sternal notch underestimates the path length by 29% (Table 1).18,19 The subtracted distance using the suprasternal notch, advocated by the Sphygmocor® and also used in the Framingham Heart Study, underestimates the distance with 10%.
| Tape-estimated APL | Tape-MRI (cm; mean ± SD) |
Tape/MRI (%) |
Cutoff (m/s) |
|---|---|---|---|
| (CA-FA) – (SSN-CA) | 2.3 ± 3.8 | +4% | 9.98 |
| (CA-FA) – (SN-CA) | −2.4 ± 3.8 | −5% | 9.12 |
| (SSN-FA) – (SSN-CA) | −5.1 ± 3.5 | −10% | 8.64 |
| (CA-FA) | 13.0 ± 4.2 | +25% | 12.00 |
| (SN-FA) – (SN-CA) | −14.8 ± 3.9 | −29% | 6.82 |
| (CA-FA) × 0.8 | 0.3 ± 3.8 | +0.4% | 9.64 |
| (Body height ÷ 4) + 7.28 | −0.5 ± 3.9 | −1% | 9.50 |
| Body height × 0.29 | −0.9 ± 4.0 | −1.8% | 9.43 |
Adapted from: Van Bortel et al. J Hypertens. 2012; 30:445–8.18,19 Reference distance used for comparison was (AA-FA) – (AA-CA) measured with MRI, Abbreviations: AA, ascending aorta; CA, carotid artery; FA, femoral artery; MRI, magnetic resonance imaging; SD, standard deviation; SN, sternal notch; SSN, suprasternal notch.
Comparison of reference distance of aortic path length (APL) with estimated distance of APL.
The distance from carotid artery to the femoral artery × 0.8 was found to give the best real-life approximation of real aortic path length and became the standard distance.18,19 Since the cut-off value of 12 m/s published in the 2007 joint ESH/ESC guidelines17 was based on the full carotid-femoral distance, recalculation of the PWV cut-off based on the standard distance gives a new threshold of 9.64 m/s.18,19 However, an aortic PWV threshold >10 m/s was chosen as this value is easy to remember in everyday clinical practice and was also predicting a 4% risk of a major CV event over 8 years in the Framingham Heart Study(-Fig. 1).4,19 Indeed, 10 m/s using the standard distance equals 8.96 m/s using the subtracted distance with the suprasternal notch, which is at the upper edge of the second quartile of aortic PWV, representing about 4% risk over 8 years.
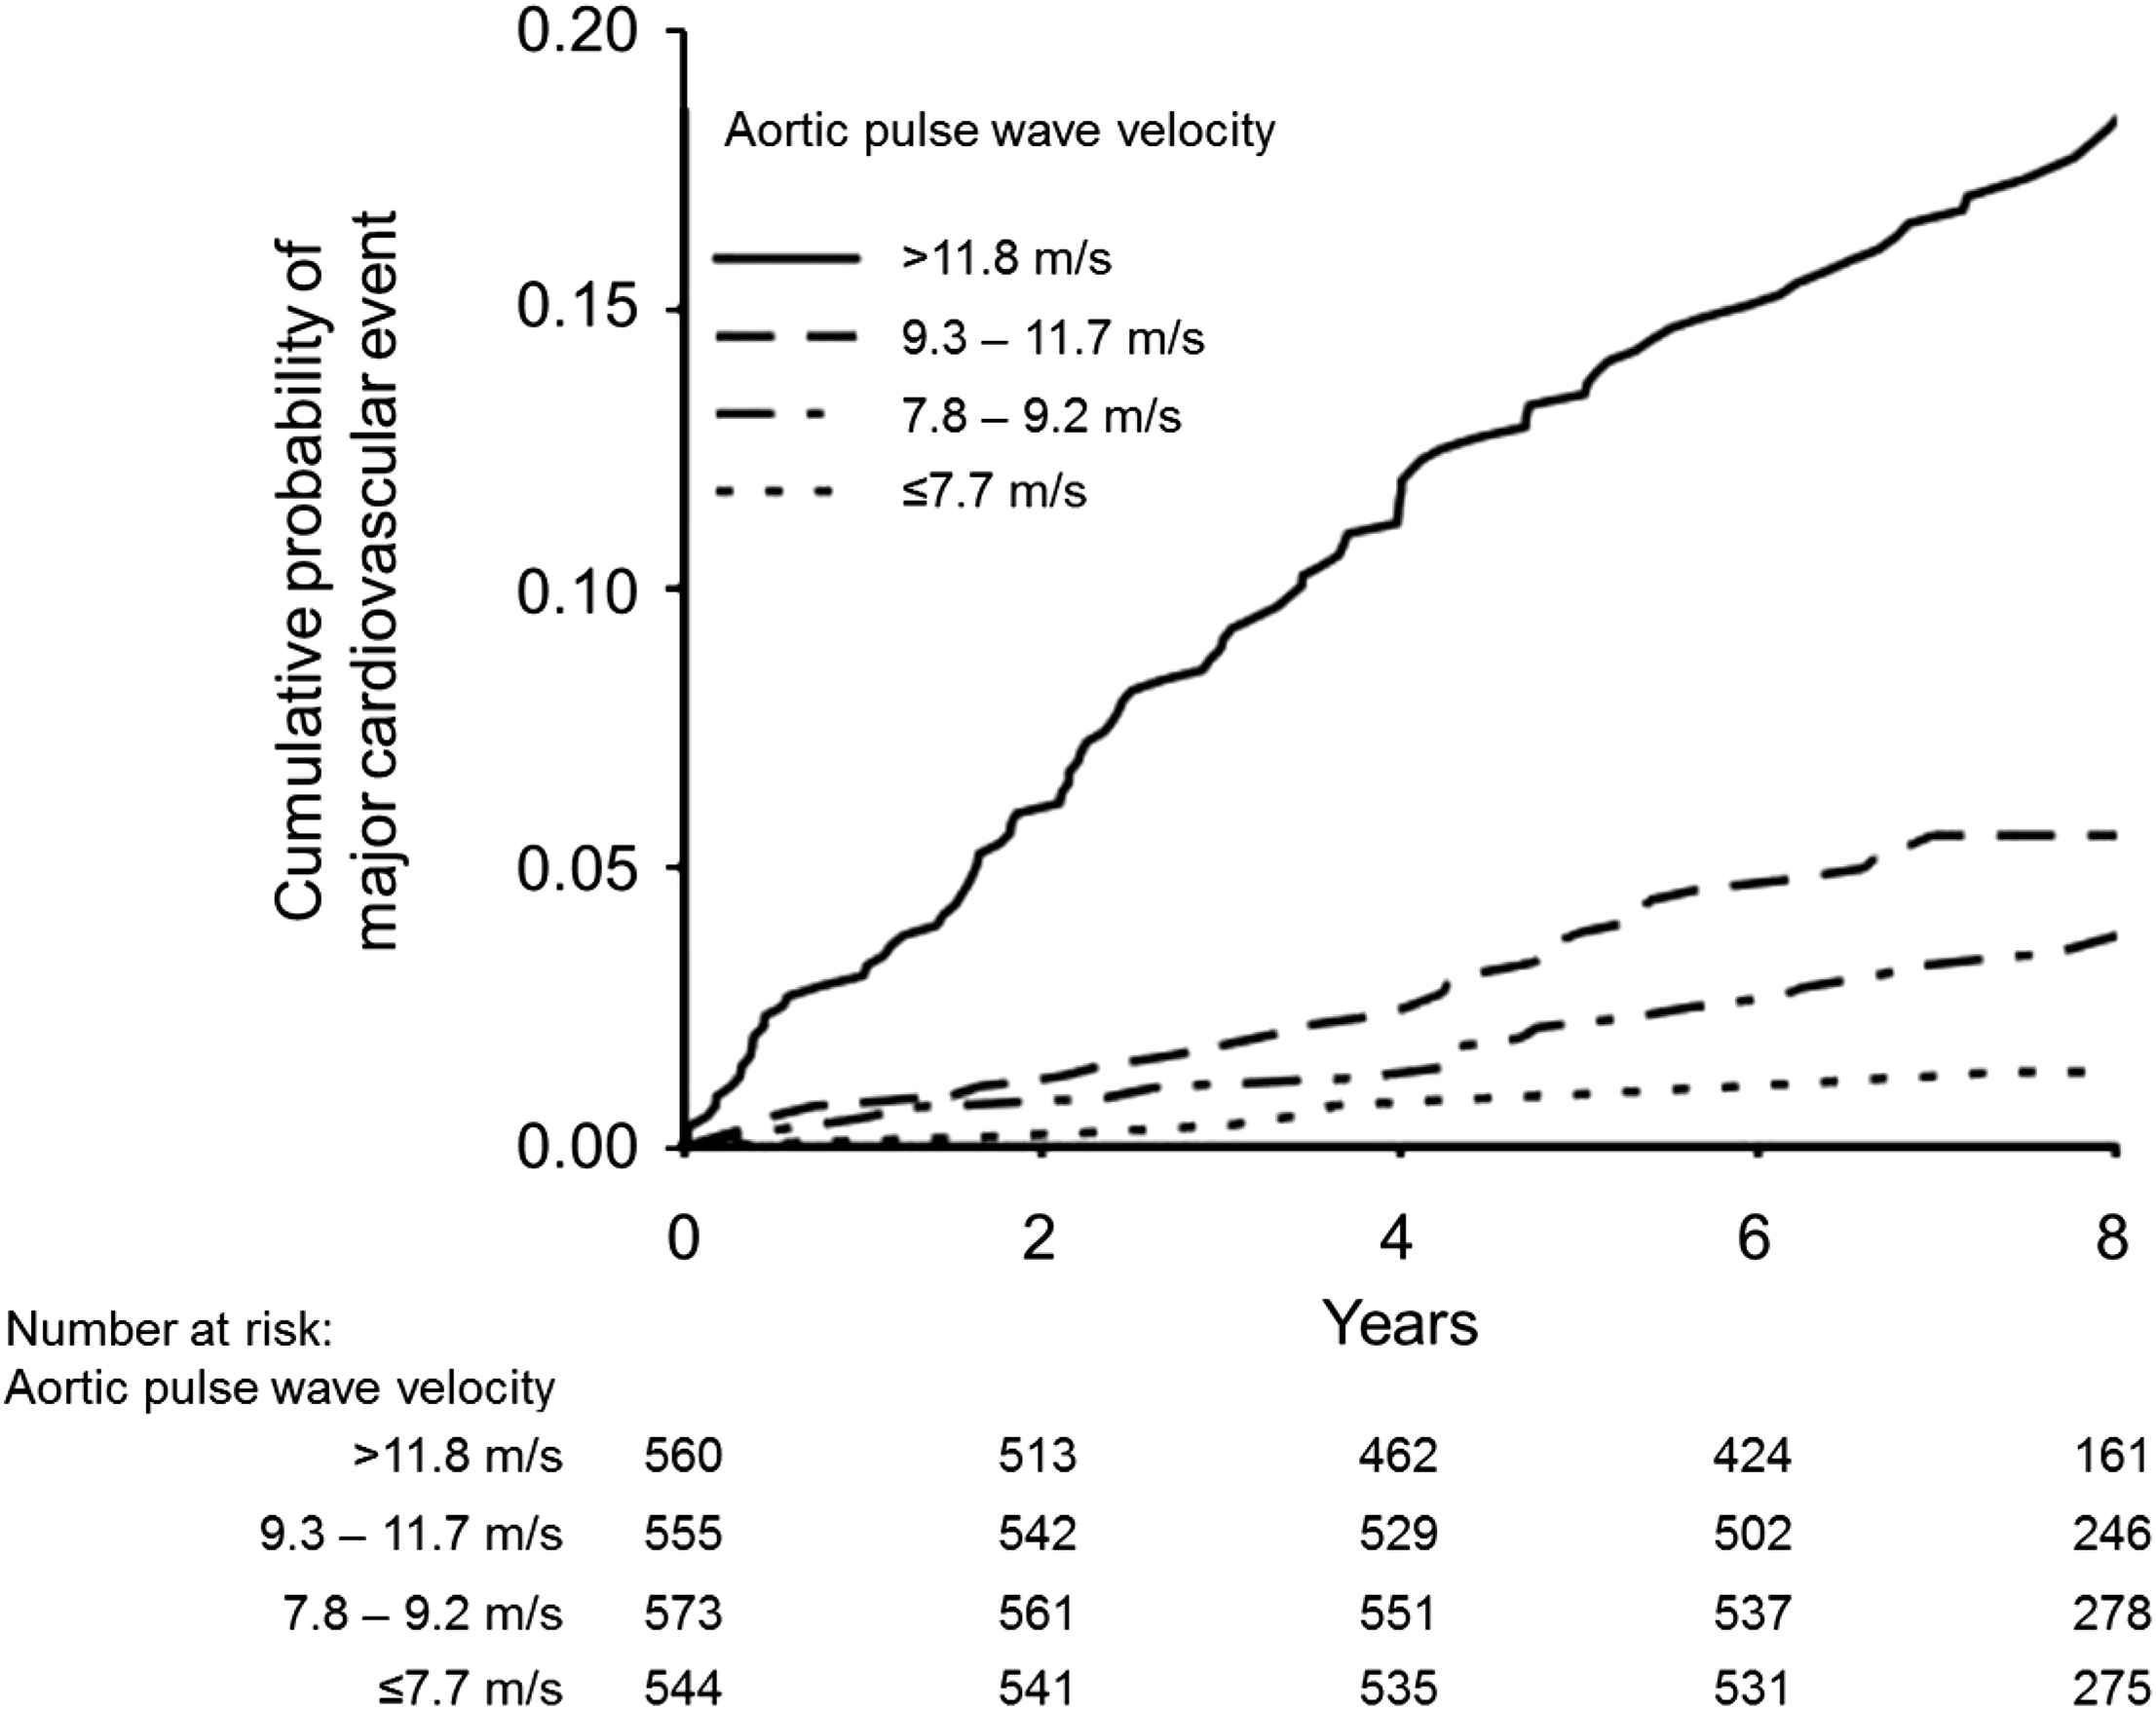
Kaplan–Meier curve showing the cumulative probability of a first major CV disease event when participants of the Framingham Heart Study were grouped by quartile of aortic pulse wave velocity (carotid-femoral).
Modified from: Mitchell et al. Circulation. 2010; 121:505–11.4 Aortic pulse wave velocity was measured using the subtracted distance with the suprasternal notch. The 10 m/s cut-off value using the standard distance (80% of the full carotid-femoral distance) is equal to 8.96 m/s in the present graph, being at the upper part of the second quartile, and representing approximately 4% risk after 8 years.
Standardisation of user procedures and patient conditions remain fundamental requirements for accurate measurements of PWV.20 This guidance has evolved in the last decade (Table 2).19 In addition, recently it was shown that aortic PWV should ideally be measured on the right side of the body with a sliding calliper.21,22 Overestimation using the 80% formula of the real travelled path length has been shown to be less on the right side of the body (0.5%) than the left side (2.7%), while BMI was shown to influence tape-measured distances. The use of a sliding calliper decreased the estimation error to −0.2% and +1.9% at the right and left body side, respectively. The 2013 ESH/ESC hypertension guidelines have confirmed that aortic PWV >10 m/s is a marker of target organ damage and that standard distance should be used.23
| Use the standard distance being 80% of the direct carotid-femoral distance. |
| Measure distance in a straight line. The use of a sliding caliper is always recommended, but particularly in obese subjects. |
| Measurements should preferably done at the right side of the body. |
| Take the mean of at least 2 measurements. If the 2 measurements differ more than 0.5 m/s, do a 3rd measurement and take the median of the 3 measurements. |
| Measurements should be performed in a quiet room with stable room temperature |
| Perform measurements in supine position after at least 10 min of rest. |
| Because of diurnal variations repeated measurements should be done at the same time of the day. |
| No meal, caffeine or smoking are allowed within 3 h before measurements. |
| Speaking is not allowed during measurements. |
| Data should be mean of registrations during at least 1 respiratory cycle (about 5–6 s). |
| Be aware of possible white coat effects. |
| Do not perform measurements in patients with arrhythmia, unstable clinical condition, carotid artery stenosis, carotis sinus syndrome. |
Aortic stiffness in daily clinical practice
Standardisation of carotid-femoral stiffness measurements enables comparison of results from different studies. Using the standard method reference values for aortic PWV according to age and blood pressure status have been calculated.24 Apart from mean PWV (±2 SD) results are also shown as median values and percentiles. This allows to investigate whether a significant change in percentile may also be translated in a meaningful change in CV risk.
While current European hypertension guidelines acknowledge the good cardiovascular predictive value, reproducibility and cost-effectiveness,23 evidence for a decrease in CV risk by a decrease in arterial stiffness is still limited to 1 study in patients with end-stage renal disease.25
Research is currently underway to determine whether a therapeutic strategy targeting normalization of arterial stiffness is more effective than standard care at preventing CV events in 3000 medium-to-very-high risk hypertensive patients in a 4-year French prospective randomised open blinded endpoint parallel group study.26 The active arm of the ongoing SPARTE (Stratégie de Prévention basée sur la rigidité ARTerielle) study has targeted reduction of aortic stiffness via normalisation of BP, use of specific aortic stiffness–reducing pharmacotherapy (RAAS inhibitors and spironolactone) and intense reduction of CV risk factors.
Today, aortic PWV meets many, but not all, of the criteria of a surrogate endpoint of CV events.26,27 It fulfils the criteria of proof of concept, prospective validation, incremental value, and clinical use. However, evidence for its use in improving clinical outcomes is currently both weak and indirect, while there are currently no data that address the criterion of cost-effectiveness. Ongoing trials may soon provide answers to address the lack of data in these areas, in particular clinical outcomes by comparing therapeutic strategies for CV event reduction based on guidelines with those based on aortic stiffness–reduction.
Conflicts of interest
LvB has no conflicts of interest concerning this topic.
References
Cite this article
TY  - JOUR
AU  - Luc Van Bortel
PY  - 2016
DA  - 2016/02/22
TI  - Arterial stiffness: From surrogate marker to therapeutic target☆
JO  - Artery Research
SP  - 10
EP  - 14
VL  - 14
IS  - C
SN  - 1876-4401
UR  - https://doi.org/10.1016/j.artres.2016.01.001
DO  - 10.1016/j.artres.2016.01.001
ID  - VanBortel2016
ER  -