
Ventricular–arterial coupling: Invasive and non-invasive assessment
- DOI
- 10.1016/j.artres.2012.12.002How to use a DOI?
- Keywords
- Ventricular-arterial coupling; Ventricular afterload; Ventricular elastance; Effective arterial elastance
- Abstract
Interactions between the left ventricle (LV) and the arterial system, (ventricular–arterial coupling) are key determinants of cardiovascular function. Ventricular–arterial coupling is most frequently assessed in the pressure–volume plane using the ratio of effective arterial elastance (EA) to LV end-systolic elastance (EES). EA (usually interpreted as a lumped index of arterial load) can be computed as end-systolic pressure/stroke volume, whereas EES (a load-independent measure of LV chamber systolic stiffness and contractility) is ideally assessed invasively using data from a family of pressure–volume loops obtained during an acute preload alteration. Single-beat methods have also been proposed, allowing for non-invasive estimations of EES using simple echocardiographic measurements. The EA/EES ratio is useful because it provides information regarding the operating mechanical efficiency and performance of the ventricular–arterial system. However, it should be recognized that analyses in the pressure–volume plane have several limitations and that “ventricular–arterial coupling” encompasses multiple physiologic aspects, many of which are not captured in the pressure–volume plane. Therefore, additional assessments provide important incremental physiologic information about the cardiovascular system and should be more widely used. In particular, it should be recognized that: (1) comprehensive analyses of arterial load are important because EA poorly characterizes pulsatile LV load and does not depend exclusively on arterial properties; (2) The systolic loading sequence, an important aspect of ventricular–arterial coupling, is neglected by pressure–volume analyses, and can profoundly impact LV function, remodeling and progression to heart failure. This brief review summarizes methods for the assessment of ventricular–arterial interactions, as discussed at the Artery 12 meeting (October 2012).
- Copyright
- © 2013 Association for Research into Arterial Structure and Physiology. Published by Elsevier B.V. All rights reserved.
- Open Access
- This is an open access article distributed under the CC BY-NC license.
The interactions between the left ventricle (LV) and systemic arteries are key determinants of cardiovascular function. This brief review deals with various approaches used for the assessment of ventricular–arterial interactions and coupling, with a focus on underlying physiologic principles and the interpretation of various indices obtained with invasive and non-invasive methods, as discussed in the 12th meeting of the Association for Research into Arterial Structure and Physiology (ARTERY 12, Vienna, October 2012).
Analyses in the pressure–volume plane
The LV pressure–volume loop is a plot of LV instantaneous cavity pressure and volume throughout the cardiac cycle. When volume and pressure are plotted in the horizontal and vertical axes, respectively, instantaneous pressure–volume pairs proceed in a counter-clock wise manner, defining a loop (Fig. 1A). The lower right “corner” of this loop represents end-diastole. Isovolumic LV contraction results in an increase in LV pressure without an increase in LV volume (vertical line). After aortic valve opening, LV volume decreases as the LV ejects blood, which results in a leftward shift of the instantaneous pressure–volume points. At the end of ejection, aortic valve closure is followed by a drop in LV pressure before mitral valve opening (isovolumic relaxation), resulting in a vertical line in the PV loop. After mitral valve opening, diastolic suction continues until the end of relaxation, which is followed by passive filling of the cavity with increasing pressure until end-diastole. Late diastolic passive filling follows a non-linear pattern in the pressure–volume plane.
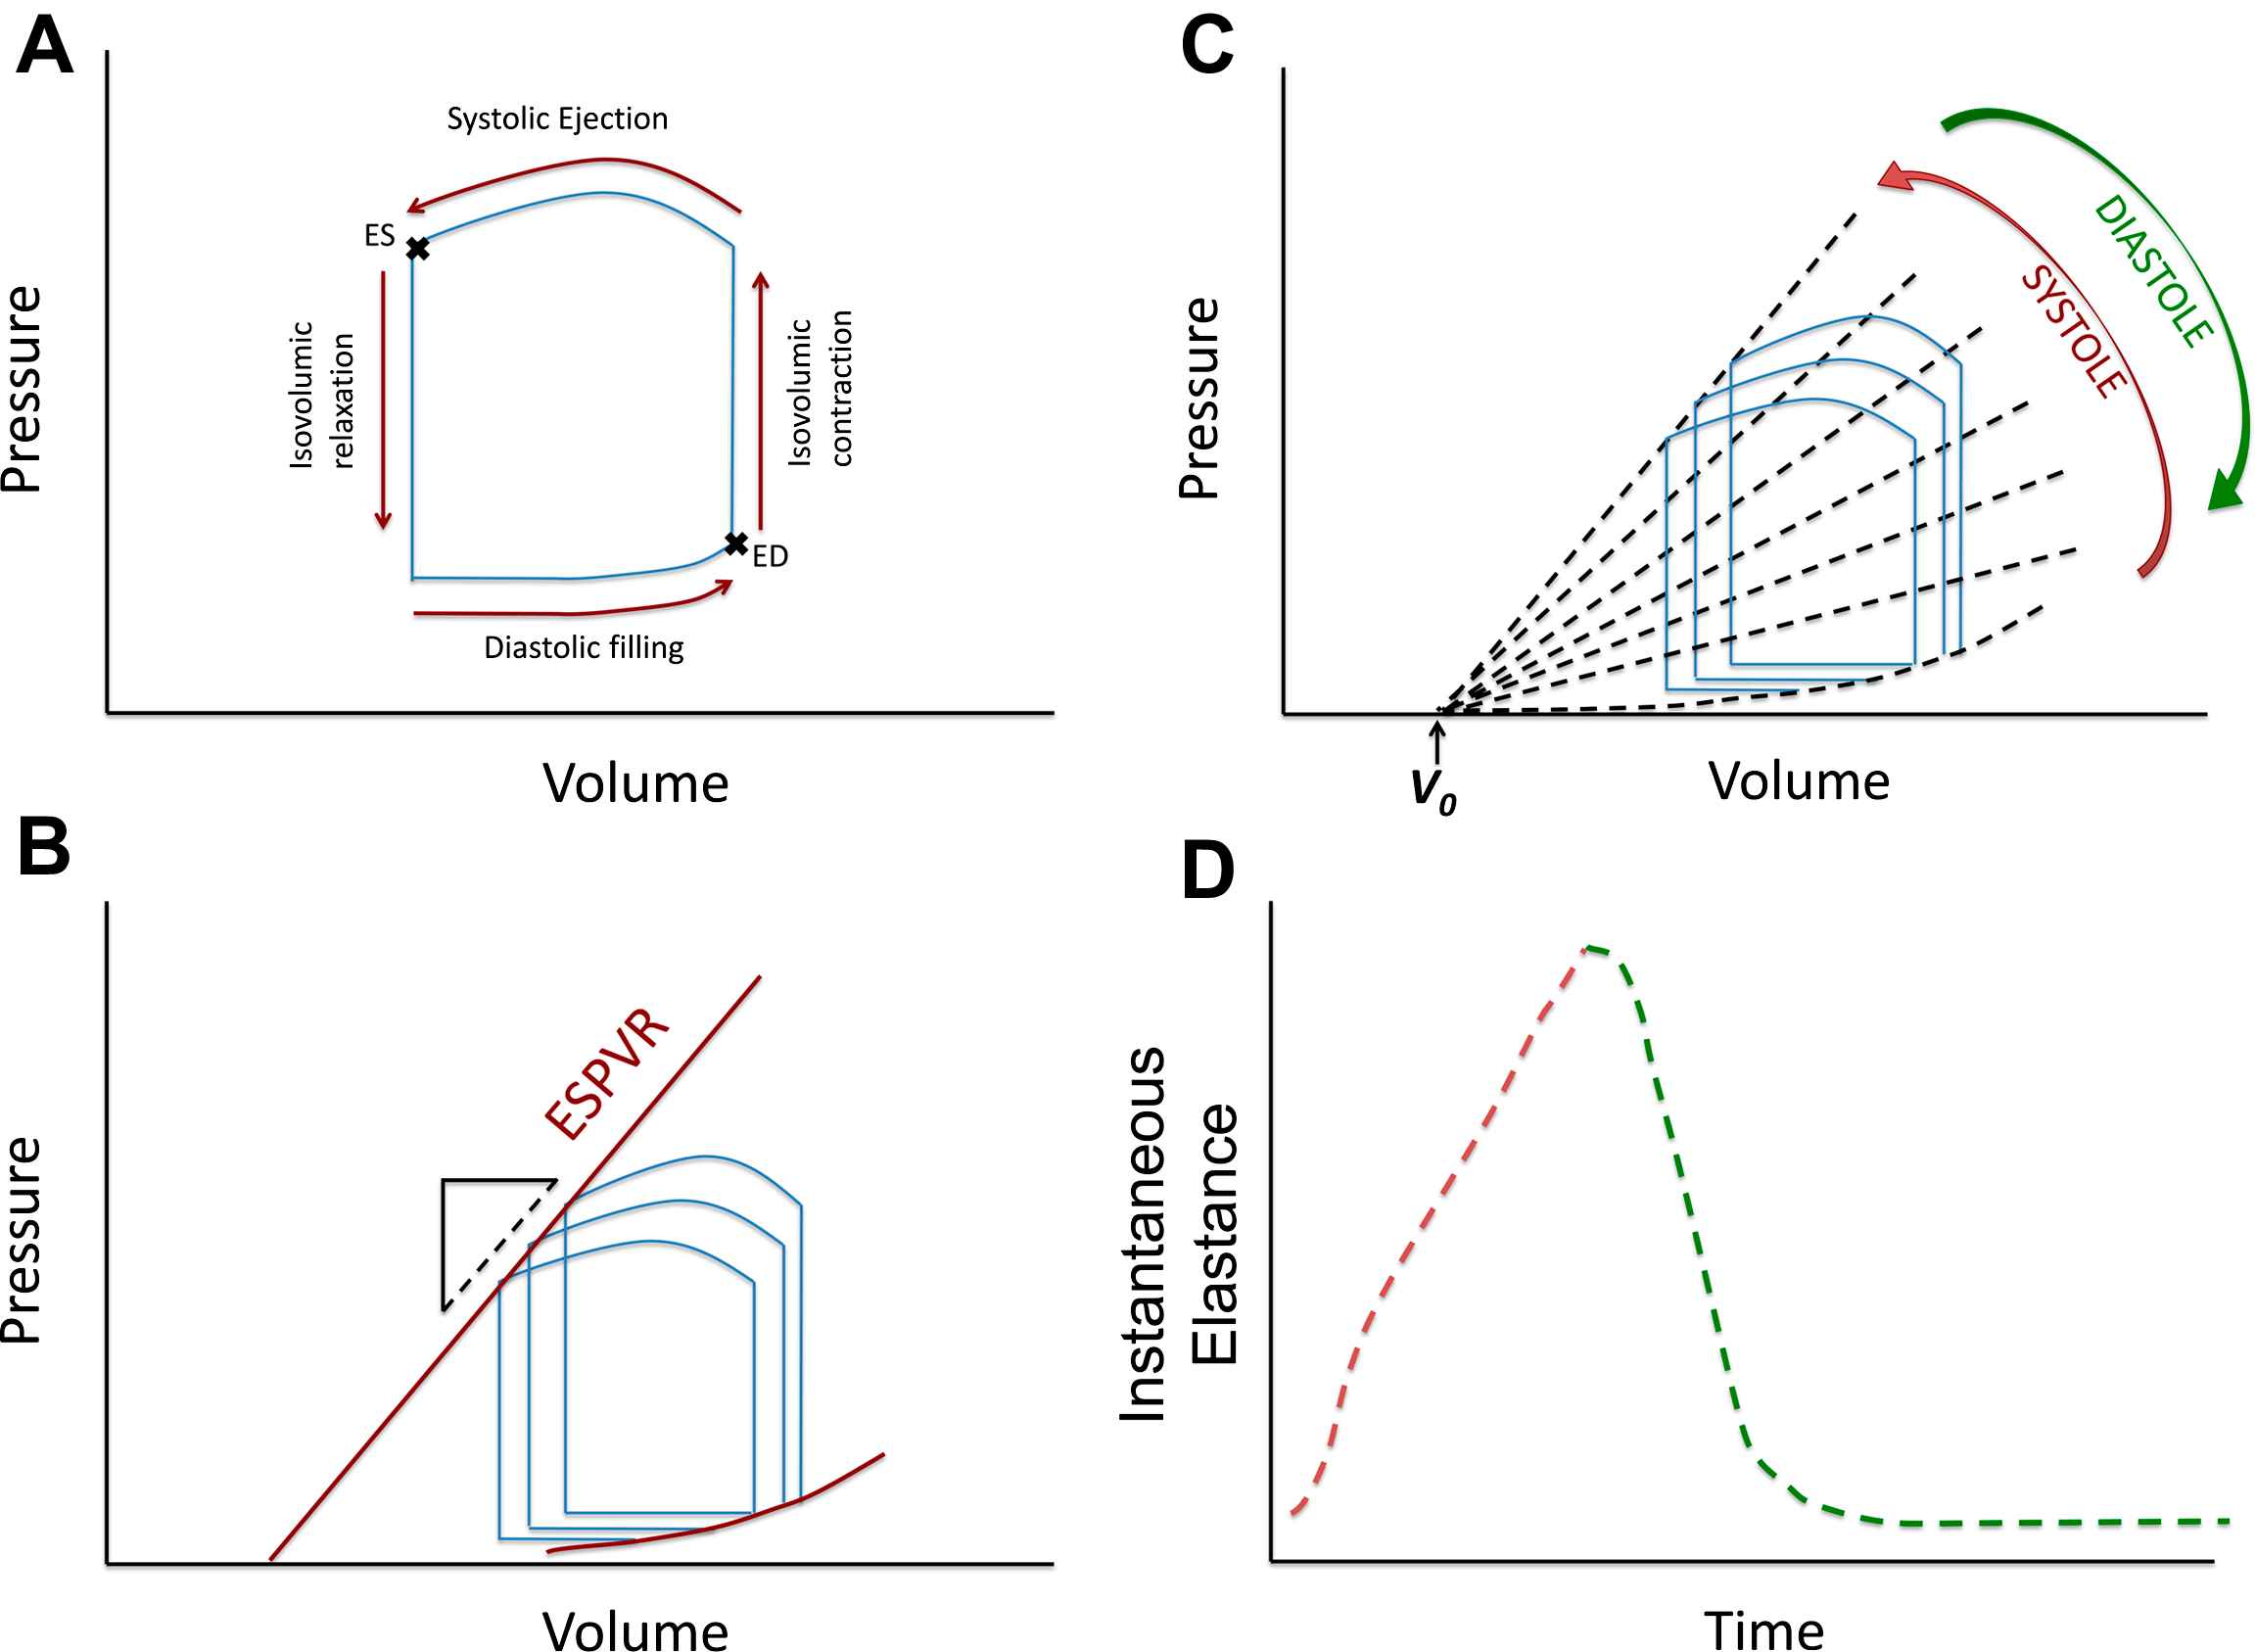
A: LV pressure–volume relation in a single beat; B: End-systolic and end-diastolic pressure–volume relations obtained from a “family” or pressure–volume loops; C: Instantaneous isochrones during the cardiac cycle (note the assumption of a common volume-axis intercept, V0); D: Time-varying elastance curve, obtained from plotting the slope of the isochrones over time.
The LV as an elastance
The concept of the time-varying LV elastance and its role in LV pump function and myocardial energetics was first formulated by Suga and Sagawa several decades ago.1–4 When a “family” of pressure–volume loops are obtained from the same subject during acute preload or afterload alterations at constant inotropic state, the left upper loop corners (end-systolic pressure–volume points) describe the end-systolic pressure–volume relation (ESPVR). The LV end-systolic elastance (EES) is quantified as the slope of the ESPVR, which is generally assumed to be linear. Fig. 1B shows a schematic representation of PV loops from a hypothetical subject, obtained during 3 beats under different pre-load conditions. The 3 points corresponding to end-systole can be connected with a line, the slope of which is EES. V0 is the volume-axis intercept of the ESPVR, which represents a purely theoretical volume at zero pressure, assuming a linear ESPVR. EES is an index of the contractility and systolic stiffness of the LV. As such, it is affected by the inotropic state of the myocardium and in the long-term, by geometric remodeling and biophysical myocardial tissue properties (which in turn depend on stiffness of myocardial cells, fibrosis and other factors).5,6
The end-systolic elastance concept is intuitive because it is based on a well-defined time point in the cardiac cycle. However, a pressure–volume relationship exists at each instant during the cardiac cycle, giving rise to the concept of the “time-varying” elastance (Fig. 1C–D). Fig. 1C shows a representative family of LV instantaneous pressure–volume relationships based on joining instantaneous pressure–volume points that occur at similar times during the cardiac cycle in different beats (“isochrones”). The slope of these isochrones increases during systole and becomes steepest toward the end of systole (red arrow), to then decrease during diastole (green arrow). If the slope of these isochrones is plotted over time, a time-varying elastance [E(t)] curve is obtained (Fig. 1D). The linear E(t) theoretical framework treats the LV as a spring that stiffens and relaxes along a predictable time course during the cardiac cycle.3,7 Although the maximal value (i.e., steepest isochrone) of E(t) does not always occur in end-systole (likely due to inertial influences on pressure and LV outflow before aortic valve closure), this issue is usually ignored and the maximal value of E(t) is considered to be equivalent to EES.8
Key pre-requisites and/or proposed features of the linear E(t) model are: 1) a linear shape of all isochrones (lines connecting equal time points in a P–V diagram of different beats, acquired under different loading conditions); (2) a common intercept of these isochrones with the volume-axis (Fig. 1C); (3) E(t) is a function of time only, independent of instantaneous and past pressure and volume under a stable contractile state; (4) when normalized for amplitude and time to peak amplitude, the shape of the E(t) curve has a relatively constant shape despite variations in underlying cardiac disease, contractility, loading, and heart rate, particularly during early systole (first 25%–35% of contraction). These features and assumptions are important to understand because they are central to the E(t) theory and underlie its main strengths and limitations. In addition, these features lead to the development of commonly used methods to approximate EES, which are based on the derivation of V0 and EES from measurements performed in a single heart beat, without the need for pre-load alterations.9,10
The pressure–volume area (PVA) and ventricular energetics
For a given beat, the PVA is the area circumscribed by three sides: 1) the end-diastolic pressure–volume relation curve; 2) the end-systolic P–V relation line, and; 3) the systolic portion of the pressure–volume loop trajectory (Fig. 2A).2,11
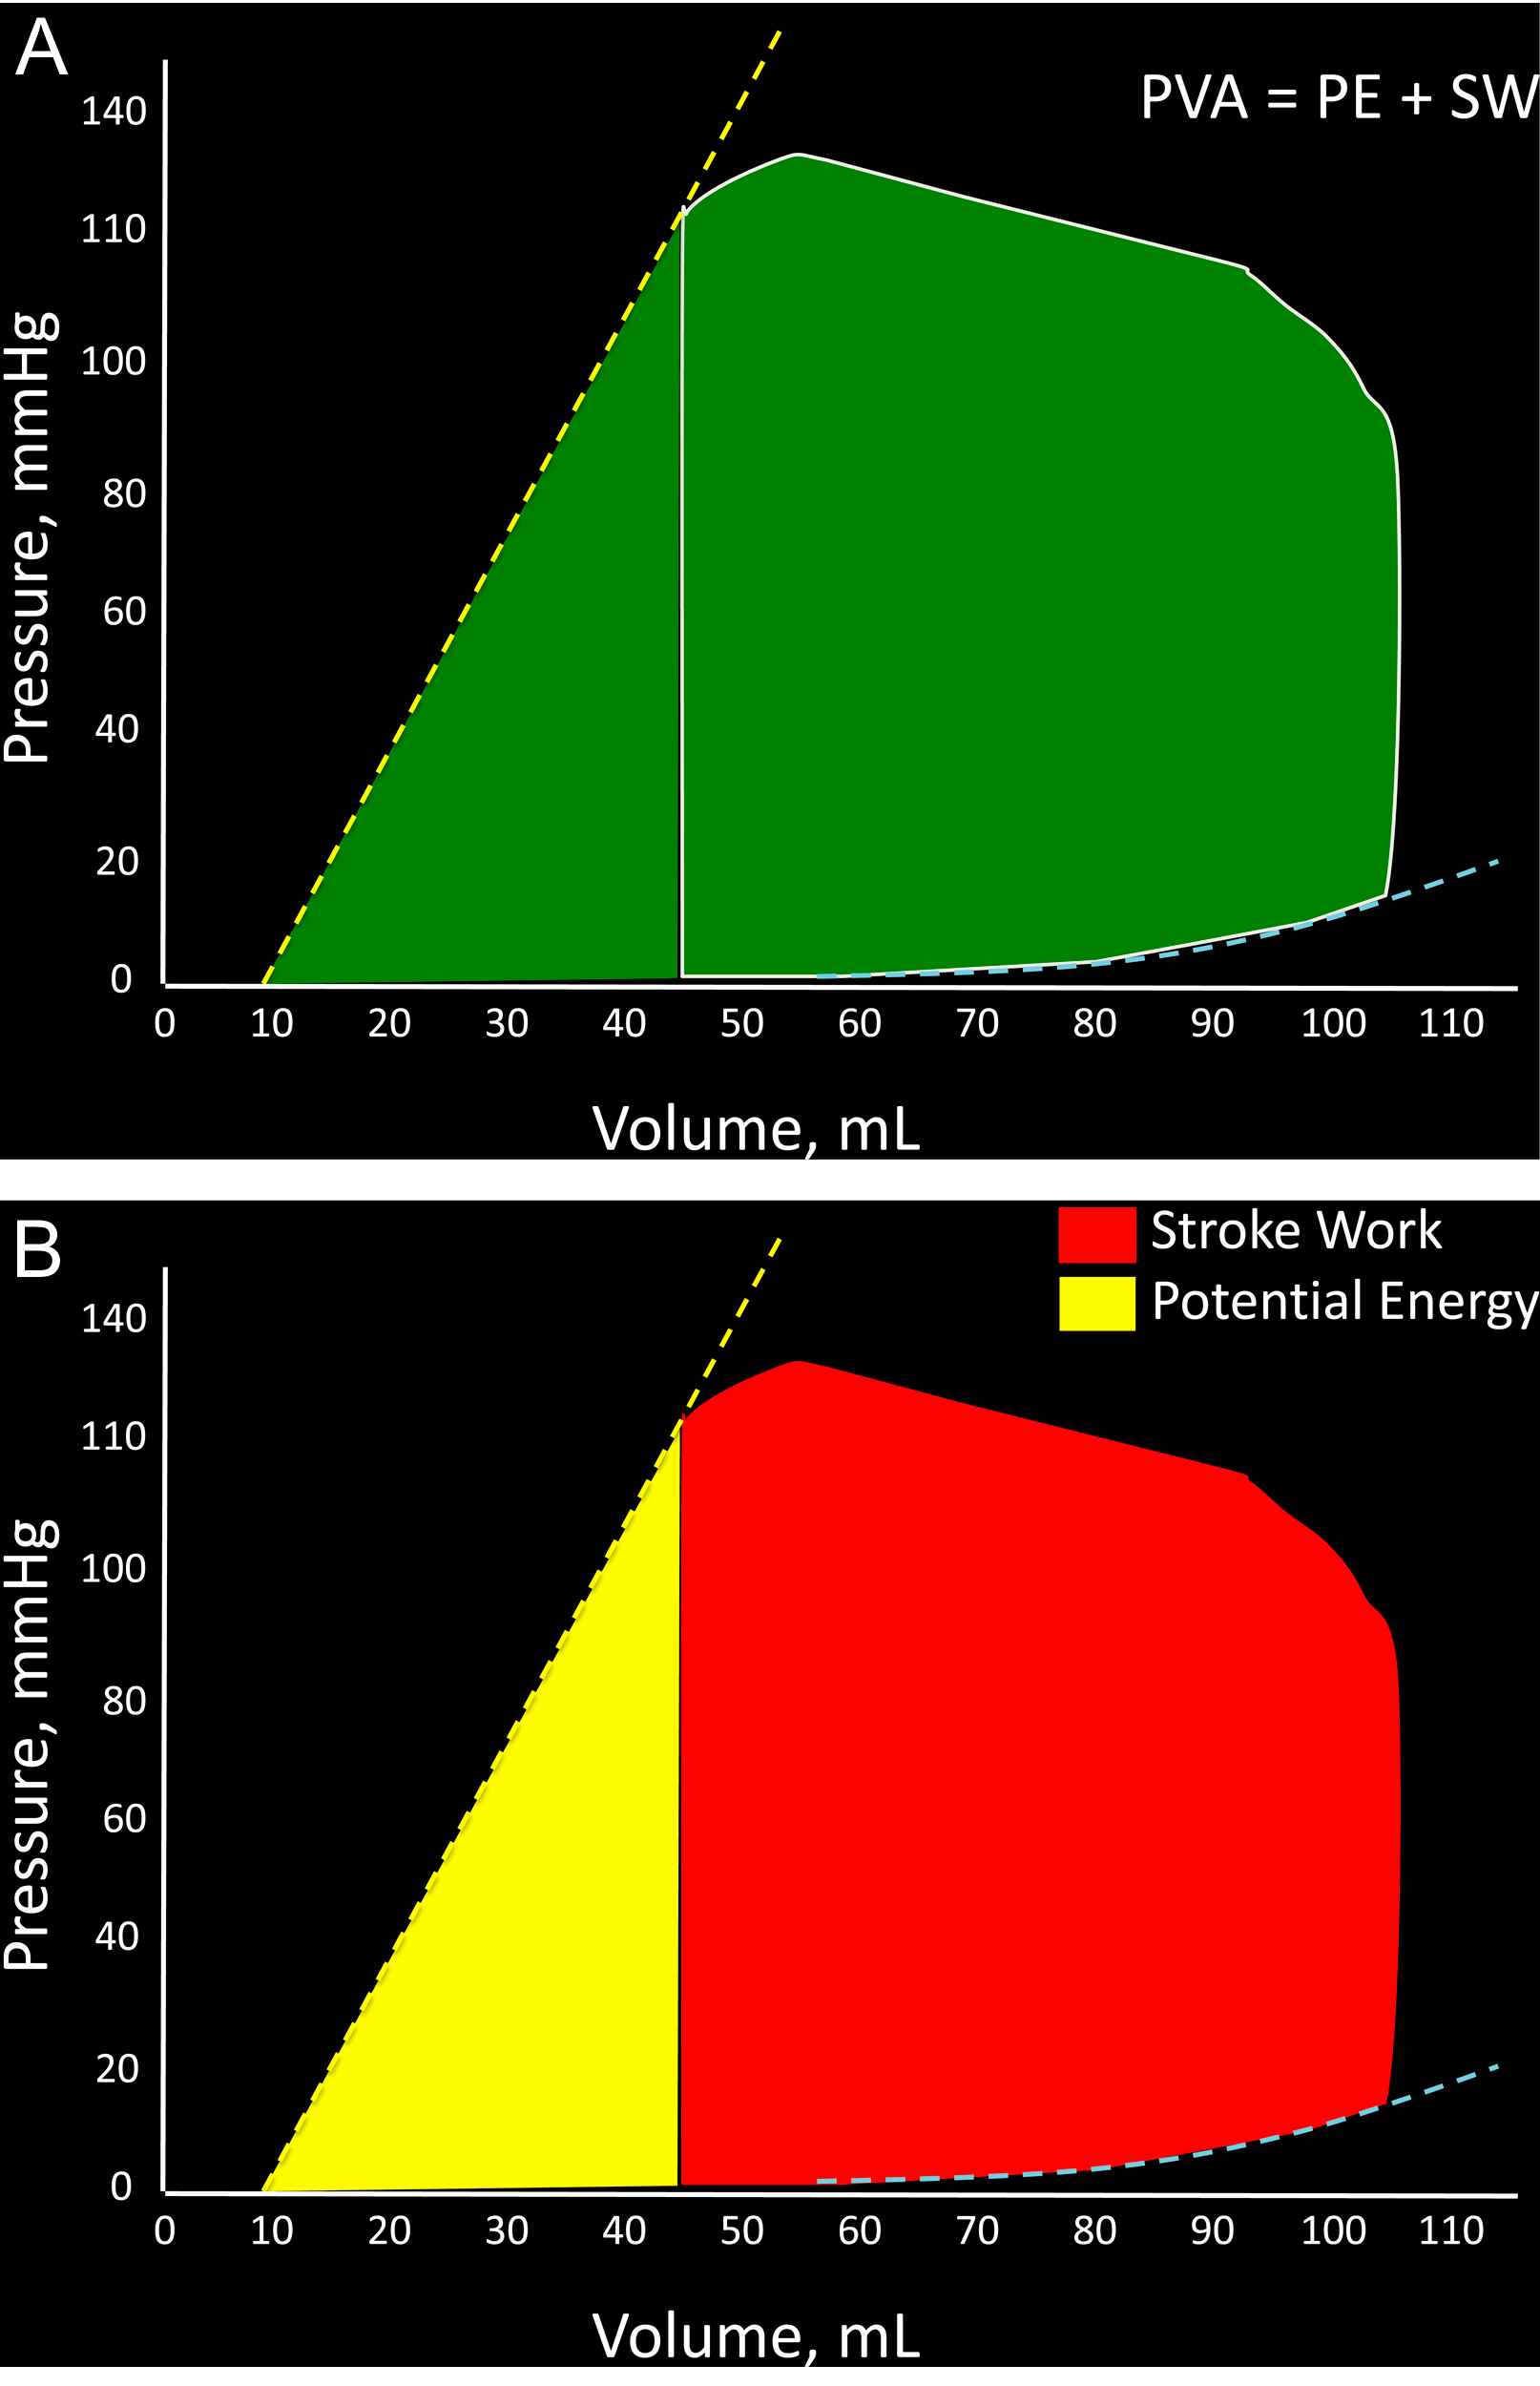
A: Representation of the pressure–volume area (PVA) of a single beat; B: Breakdown of the PVA into stroke (external) work (red) and potential energy (yellow). (For interpretation of the references to colour in this figure legend, the reader is referred to the web version of this article.)
The PVA in an ejecting contraction can be divided in 2 parts: (1) The area within the pressure–volume loop trajectory, which equals LV external work or stroke work; (2) The approximately triangular area enclosed by the end-systolic pressure–volume relation, the left border of a single pressure–volume loop and the end-diastolic pressure–volume relation (Fig. 2B). The latter area has been proposed to represent the end-systolic elastic potential energy built up and stored in the LV wall.
According to the time-varying elastance theory, the PVA represents the total mechanical energy generated by LV contraction until the end of systole. Experiments in excised canine heart preparations cross-circulated with a support dog have shown that, when a single excised heart operates at a stable contractile state under various preload and afterload conditions, PVA correlates strongly and linearly with myocardial oxygen consumption (MVO2) per beat.2,11,12 (Fig. 3A). Based on these experiments, it was proposed and it is now widely accepted that the ratio of stroke work (SW) to PVA (the latter considered in this context a surrogate of MVO2 per beat) represents an index of mechanical efficiency.
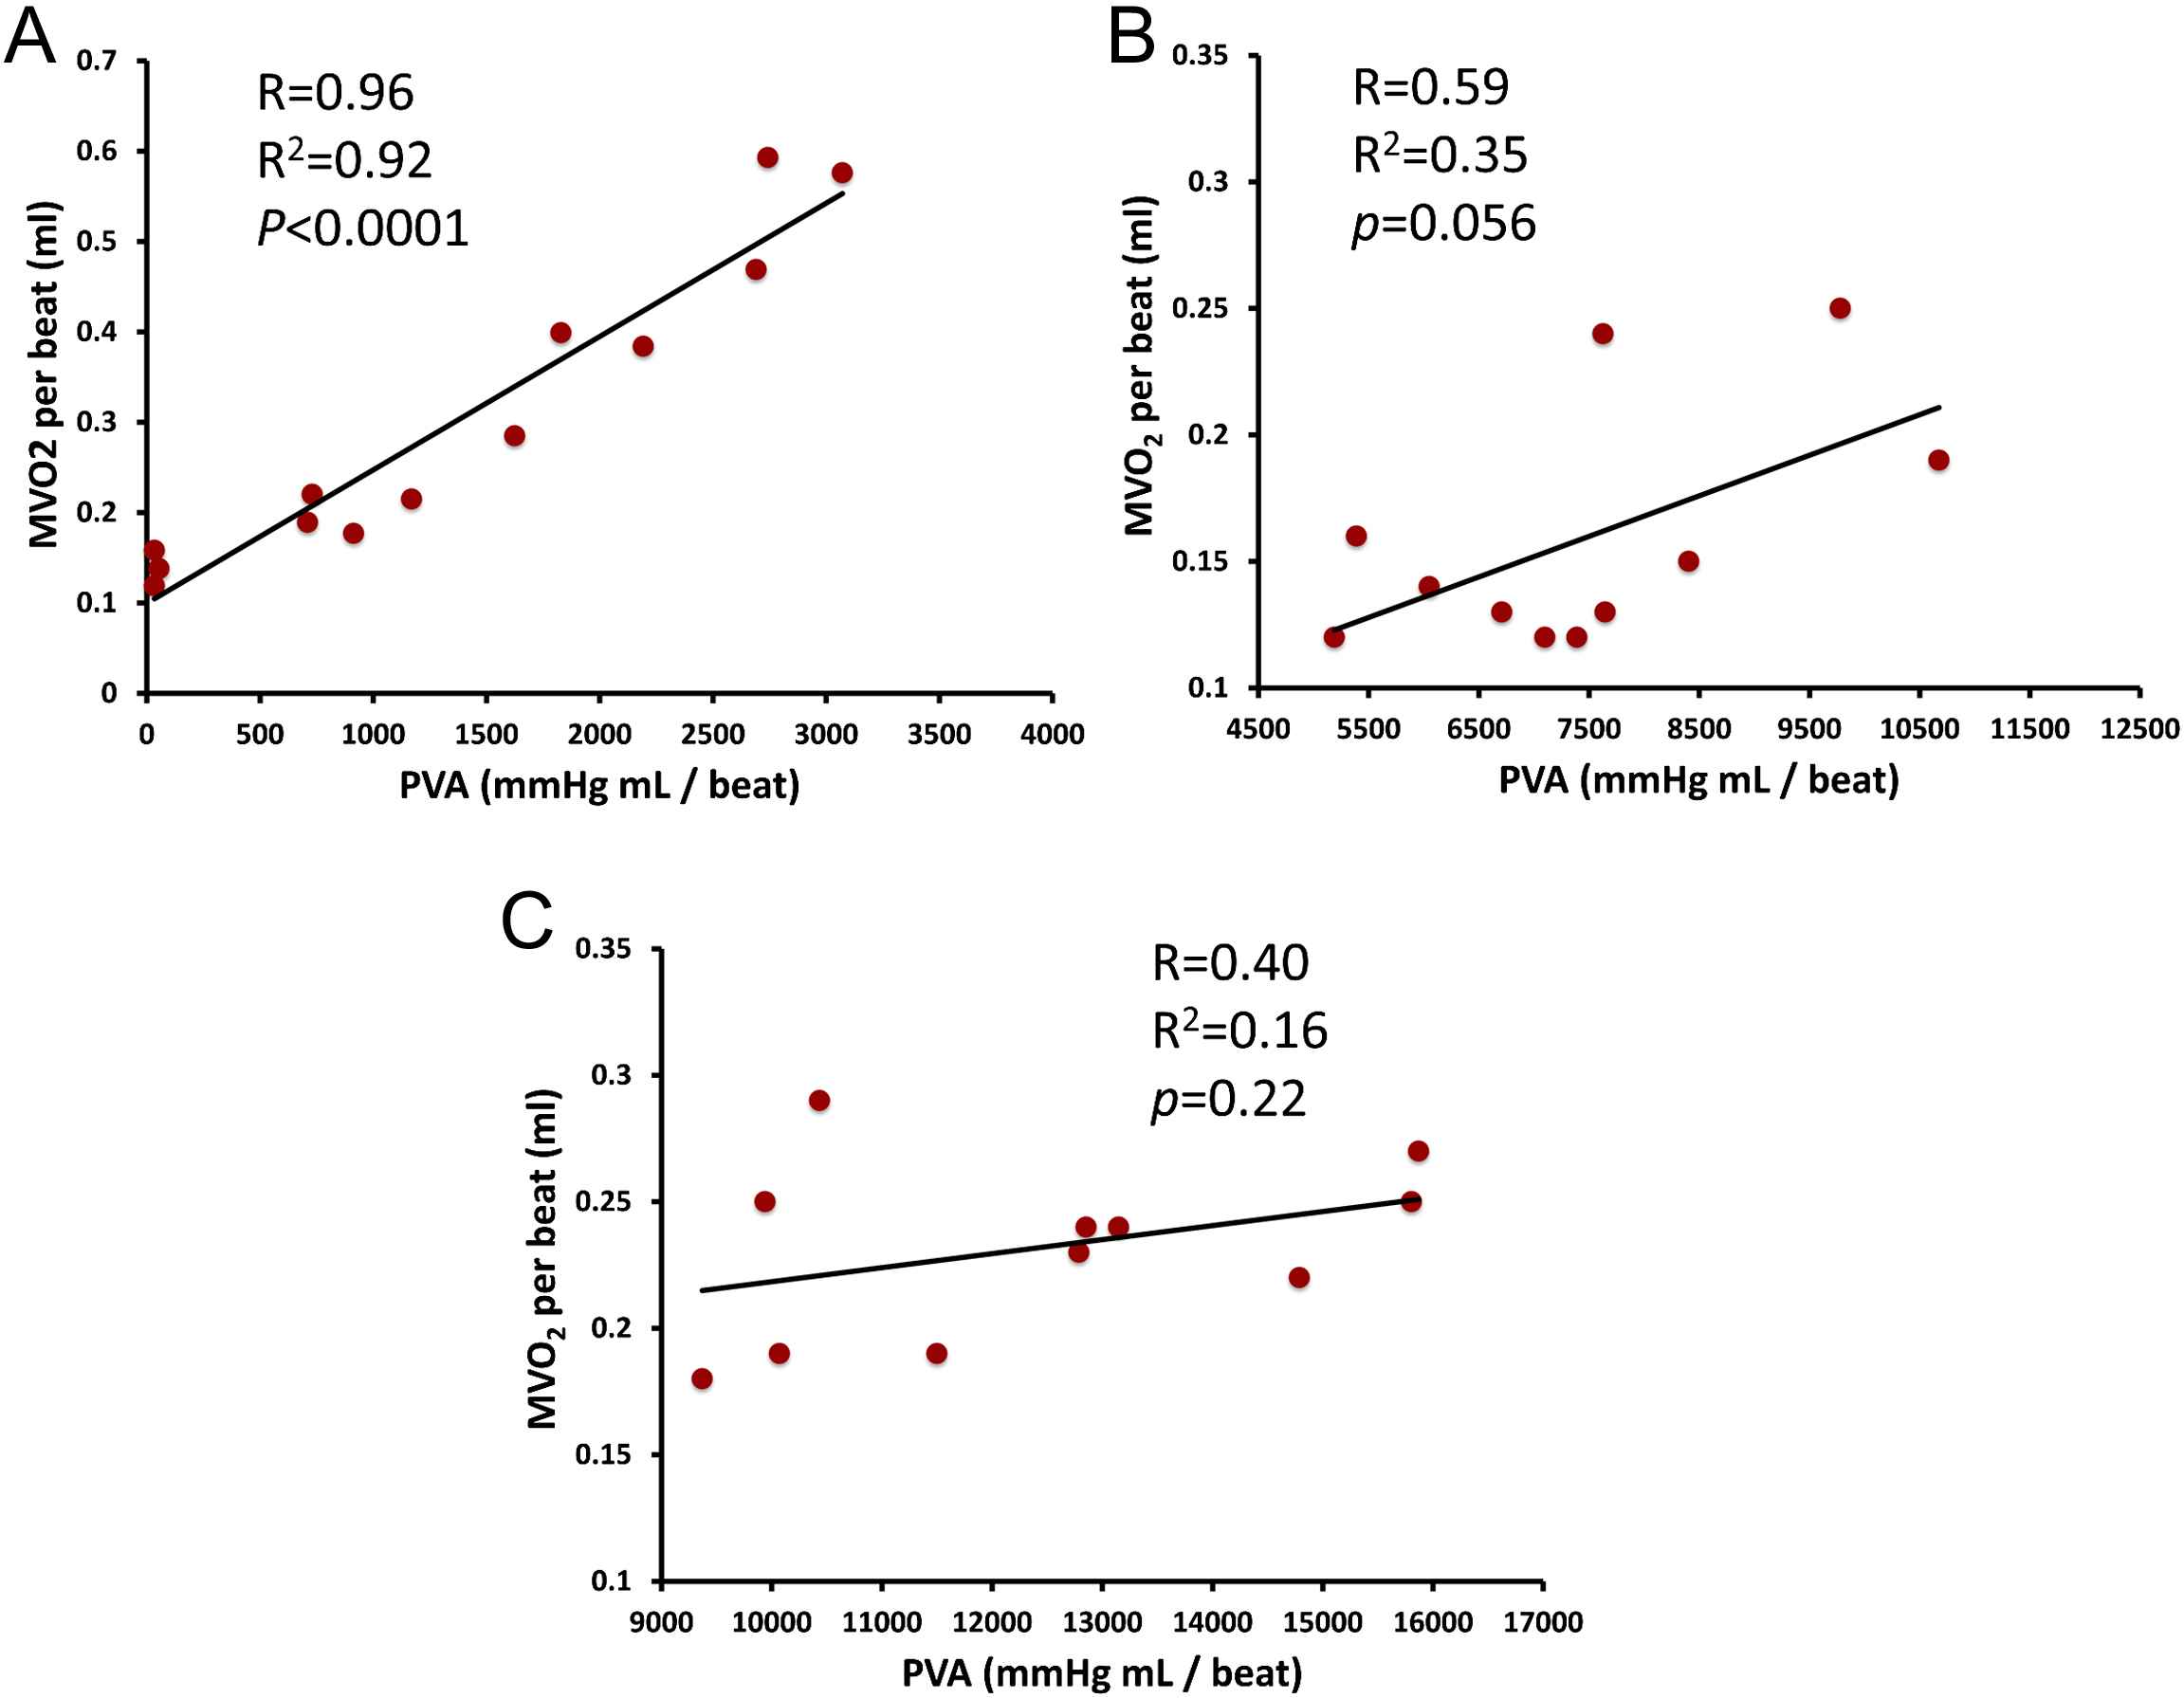
Panel A shows the strong, linear PVA–MVO2 relation in a single excised heart at a stable contractile state operating under various preload and afterload conditions, as initially reported by Khalafbeigui, Suga and Sagawa. Panels B and C show the authors’ analysis of data from Kameyama et al. (presented in Tables 1 and 2 in reference 13) obtained from 11 patients with different contractile states at baseline (B) and after administration of phenylephrine, which increases afterload (C). In contrast to the strong PVA–MVO2 relation seen in individual hearts, the PVA–MVO2 relation is much weaker, due to the great between-heart variability in the slope and particularly, the intercept of the relation (see text for details).
A point of caution should be raised regarding the use of PVA as a surrogate of MVO2 in clinical studies, which has become popular due to the relative case of estimating the PVA as opposed to MVO2 in vivo. Whereas the strong linear relation between PVA and MVO2 within a given heart is unquestionable, the relationship between measured MVO2 and PVA within a group of human hearts in vivo is actually much weaker. This can be understood by more closely assessing the nature of the PVA–MVO2 relation. Within a given heart (Fig. 3A), the line that relates MVO2 to PVA demonstrates: (1) A finite slope, which characterizes the efficiency of cardiac chemo-mechanical conversion in that particular heart in the setting of varying preload and afterload states; (2) A positive intercept with the MVO2-axis, which can be seen as the “PVA-independent” MVO2 of that particular heart under that particular inotropic state. The “PVA-independent” MVO2 is likely related to the energetic costs of excitation–contraction coupling and basal myocardial cellular metabolism. It should be noted, however, that both the slope and particularly, the intercept of this relation are highly variable between different hearts or even in the same heart operating at different inotropic states13 (for example, positive inotropic interventions generally, but not universally, increase the intercept of the relation and thus shift the entire relation “upward”, and vice-versa). Although the variability in the slope and intercept of the PVA–MVO2 relation appears to be limited between excised hearts operating ex vivo under highly controlled conditions, analyses of invasive human in vivo data reported by Kameyama et al. (case-wise data shown Tables 1 and 2 of reference 13), clearly reveals that the relationship between MVO2 and PVA is much weaker, either at rest (Fig. 3B) of after phenylephrine administration (an intervention that increases afterload, Fig. 3C). This is due to great variability in both the slope and the intercept of the PVA–MVO2 relation between individuals, with the slope varying from 2.08 to 3 J/beat, and MVO2-axis intercept variability varying over a span greater that an order of magnitude (from 0.04 to 1 J/beat) in that study.13 Therefore, great caution should be undertaken when using the PVA to assess mechanical efficiency (when the latter is defined as the MVO2 required to generate a given stroke work), within populations or even within individuals in the setting of interventions that induce compensatory responses that may shift the intercept or alter the slope of the PVA–MVO2 relation.
Effective arterial elastance and ventricular–arterial coupling
Provided that heart rate, diastolic and systolic duration remain constant, arterial end-systolic pressure changes with stroke volume in a roughly linear fashion (the greater the stroke volume ejected into the arterial system, the greater the generated end-systolic pressure will be). Making a number of simplifying assumptions, Sunagawa et al. derived an equation that relates the slope of this relation to arterial properties and proposed that this slope can be used as a lumped parameter of the impedance that the arterial tree offers to the stroke flow.14,15 This slope was called effective arterial elastance (EA), since it treats the arterial system as an elastic chamber that has a volume elastance. With such representation, both the LV and the arterial system are thus treated as elastances and quantified in the same units (change in pressure for a given change in volume; or mm/mL). Some important aspects of ventricular–arterial coupling can be assessed in the pressure–volume plane using the ratio of effective arterial elastance (EA) to left ventricular (LV) end-systolic elastance (EES). It was predicted analytically and shown experimentally in isolated canine heart preparations, that the mechanical energy (stroke work) transferred from the ventricular to the arterial elastance is maximal when the slopes of these elastances are approximately equal to one another.14 A value of EA/EES equal to 1 implies that the effective ejection fraction (ratio of stroke volume to the effective end-diastolic volume, where “effective” end-diastolic volume equals measured end-diastolic volume minus V0) is ∼50%. Given that V0 usually has a small positive value, rather than a zero value, this operating state would correspond to actual ejection fraction values slightly lower than 50%, which are clearly not the norm in healthy humans. It was subsequently predicted that, whereas stroke work is maximized when EA/EES ∼1, energetic efficiency is maximized at lower EA/EES ratios.16 De Tombe et al. studied the dependence of stroke work and mechanical efficiency on the EA/EES ratio in isolated blood-perfused canine hearts17 over a broad range of EA values. It was shown that on an average, stroke work was maximized at EA/EES ∼ 0.80, whereas efficiency was maximal at EA/EES ∼0.70. Interestingly, mean EA/EES ratios reported in large cohorts of normal humans are ∼0.62–0.82.18,19 More importantly, De Tombe et al.17 showed that both stroke work and efficiency were ≥90% of their optimal values over a broad range of EA/EES ratios (0.3–1.3), which corresponded to a wide range of ejection fractions (∼40–80%). The authors concluded that precise optimization of either stroke work of mechanical efficiency is of little consequence in the absence of severe abnormalities in EES or EA and that in such circumstances, regulatory systems likely center on control of blood pressure, circulating volume and oxygenation, and can ignore ventricular stroke work or efficiency.17 In severely abnormal coupling states, however, this homeostasis may be lost. For example, in patients with systolic heart failure, these ratios may rise to as high as 4.0 due to the relative decline in ventricular contractile function (lower EES) and concomitant rise in EA. Such coupling would be clearly suboptimal from the standpoint of ventricular performance and metabolic efficiency, as discussed below.
Assessing the consequences of “primary” LV or arterial dysfunction in the pressure–volume plane
The principles discussed above can be intuitively applied to understand the consequences of primary arterial or myocardial disease on some aspects of ventricular–arterial coupling. Fig. 4 demonstrates some potential consequences of a “primary” reduction in EES. The top panel represents a normal physiologic state. For simplicity, an EA/EES ratio of 1 is assumed to represent “normal” elastance coupling. In this situation, a large proportion (∼2/3) of the PVA corresponds to stroke work and the LV operates at an effective ejection fraction of ∼50%. The middle panel represents a situation where, all other factors being equal, EES has decreased to ∼50% of its nominal value and end-diastolic volume has increased, which may occur, for instance, in the setting of a dilated cardiomyopathy. In this situation, a high EA/EES ratio is observed, which is accompanied by an increased proportion of the PVA (∼50%) corresponding to potential energy, and a reduced proportion (the remaining ∼50%) corresponding to external work, denoting an unfavorable energetic efficiency state. In this situation, the ventricle operates at an effective ejection fraction of ∼33%, although in this particular example stroke volume is relatively preserved due to the increased end-diastolic volume. The bottom panel corresponds to what may occur with an intervention that, in this circumstance, reduces EA to 50% of its nominal value. This would theoretically result in normalization of the EA/EES ratio, a restoration of the proportions of the PVA corresponding to external work and potential energy, and a normalization of the effective ejection fraction. This situation is unlikely to be realistic in vivo since the reduction in the intersection point between EA and EES in the pressure axis (i.e., end-systolic pressure) is limited by the minimum perfusion pressures required for perfusion of peripheral organs. Thus, in hearts with markedly decreased EES, an optimal mechanical efficiency is only achievable at a lower end-systolic pressures than those required to maintain adequate systemic circulation; operating efficiency is thus necessarily decreased relative to the maximally attainable efficiency, in order to maintain acceptable perfusion pressures.
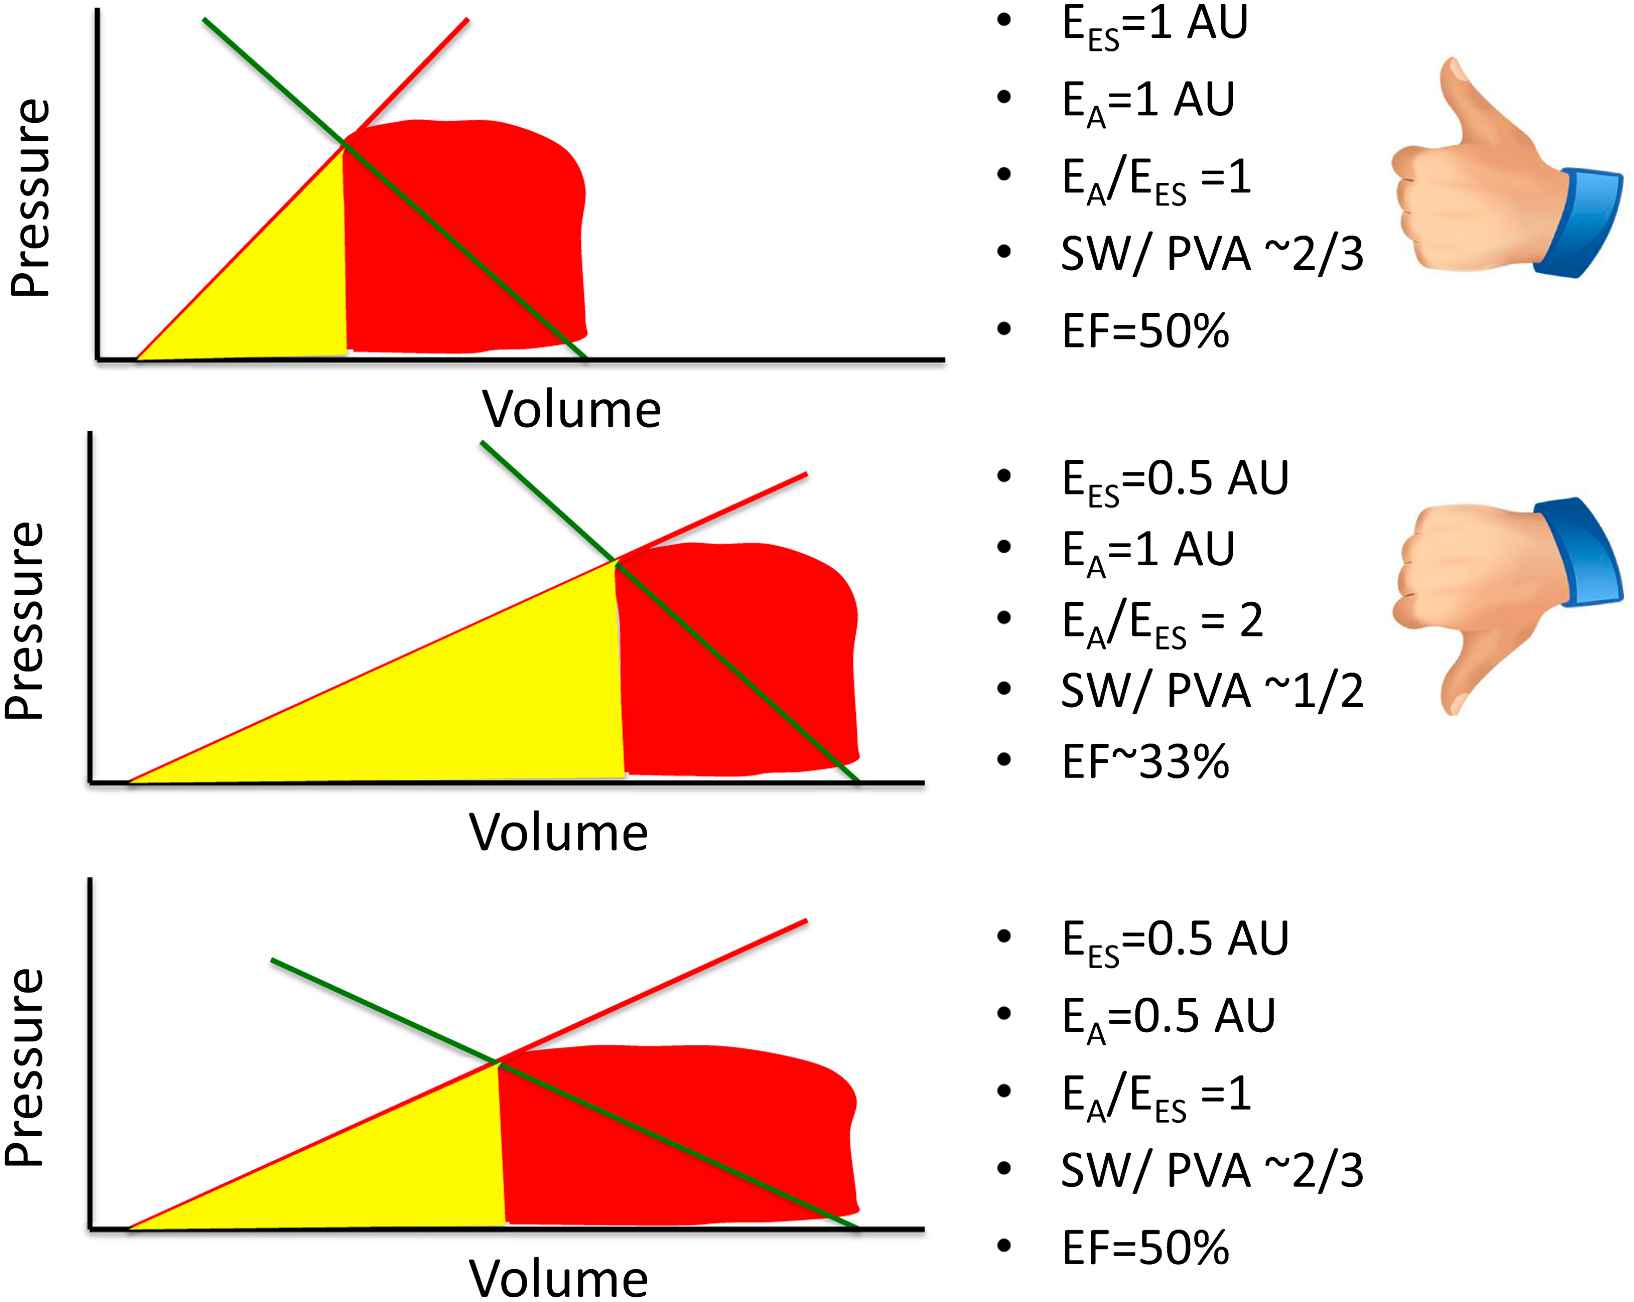
Potential consequences of a primary reduction of EES in energetic aspects of ventricular–arterial coupling. AU = arbitrary units. See text for details.
Figure 5 represents the consequences of a “primary” increase in EA. The top panel again represents a simplified normal physiologic state, with a “normal” EA/EES ratio, resulting in a high stroke work relative to pressure–volume-area and an effective ejection fraction of ∼50%. The middle panel represents a situation in which EA has increased to twice its nominal value (middle panel), without a change in EES. A high EA/EES ratio is again observed, which is accompanied by an increased proportion of the PVA (∼50%) corresponding to potential energy and a reduced proportion (the remaining ∼50%) corresponding to external work, denoting an unfavorable energetic efficiency state. In this situation, the LV operates at an effective ejection fraction of ∼33% and systemic arterial end-systolic pressure is somewhat increased. The bottom panel represents an alternative (and more common) situation, in which, in response to the increased EA, EES has increased (i.e., the LV demonstrates increased systolic stiffness). In this situation, the EA/EES ratio is normalized, with restoration of the proportions of the PVA corresponding to external work and potential energy and a normalization of the effective ejection fraction. However, despite an apparently “favorable” coupling between EA and EES, this is accompanied by systolic hypertension, impaired LV chamber contractile reserve and high sensitivity of blood pressure to preload, thus resulting in blood pressure lability.20,21 These features tend to be present in older hypertensive subjects with systolic hypertension and those with heart failure and preserved ejection fraction.
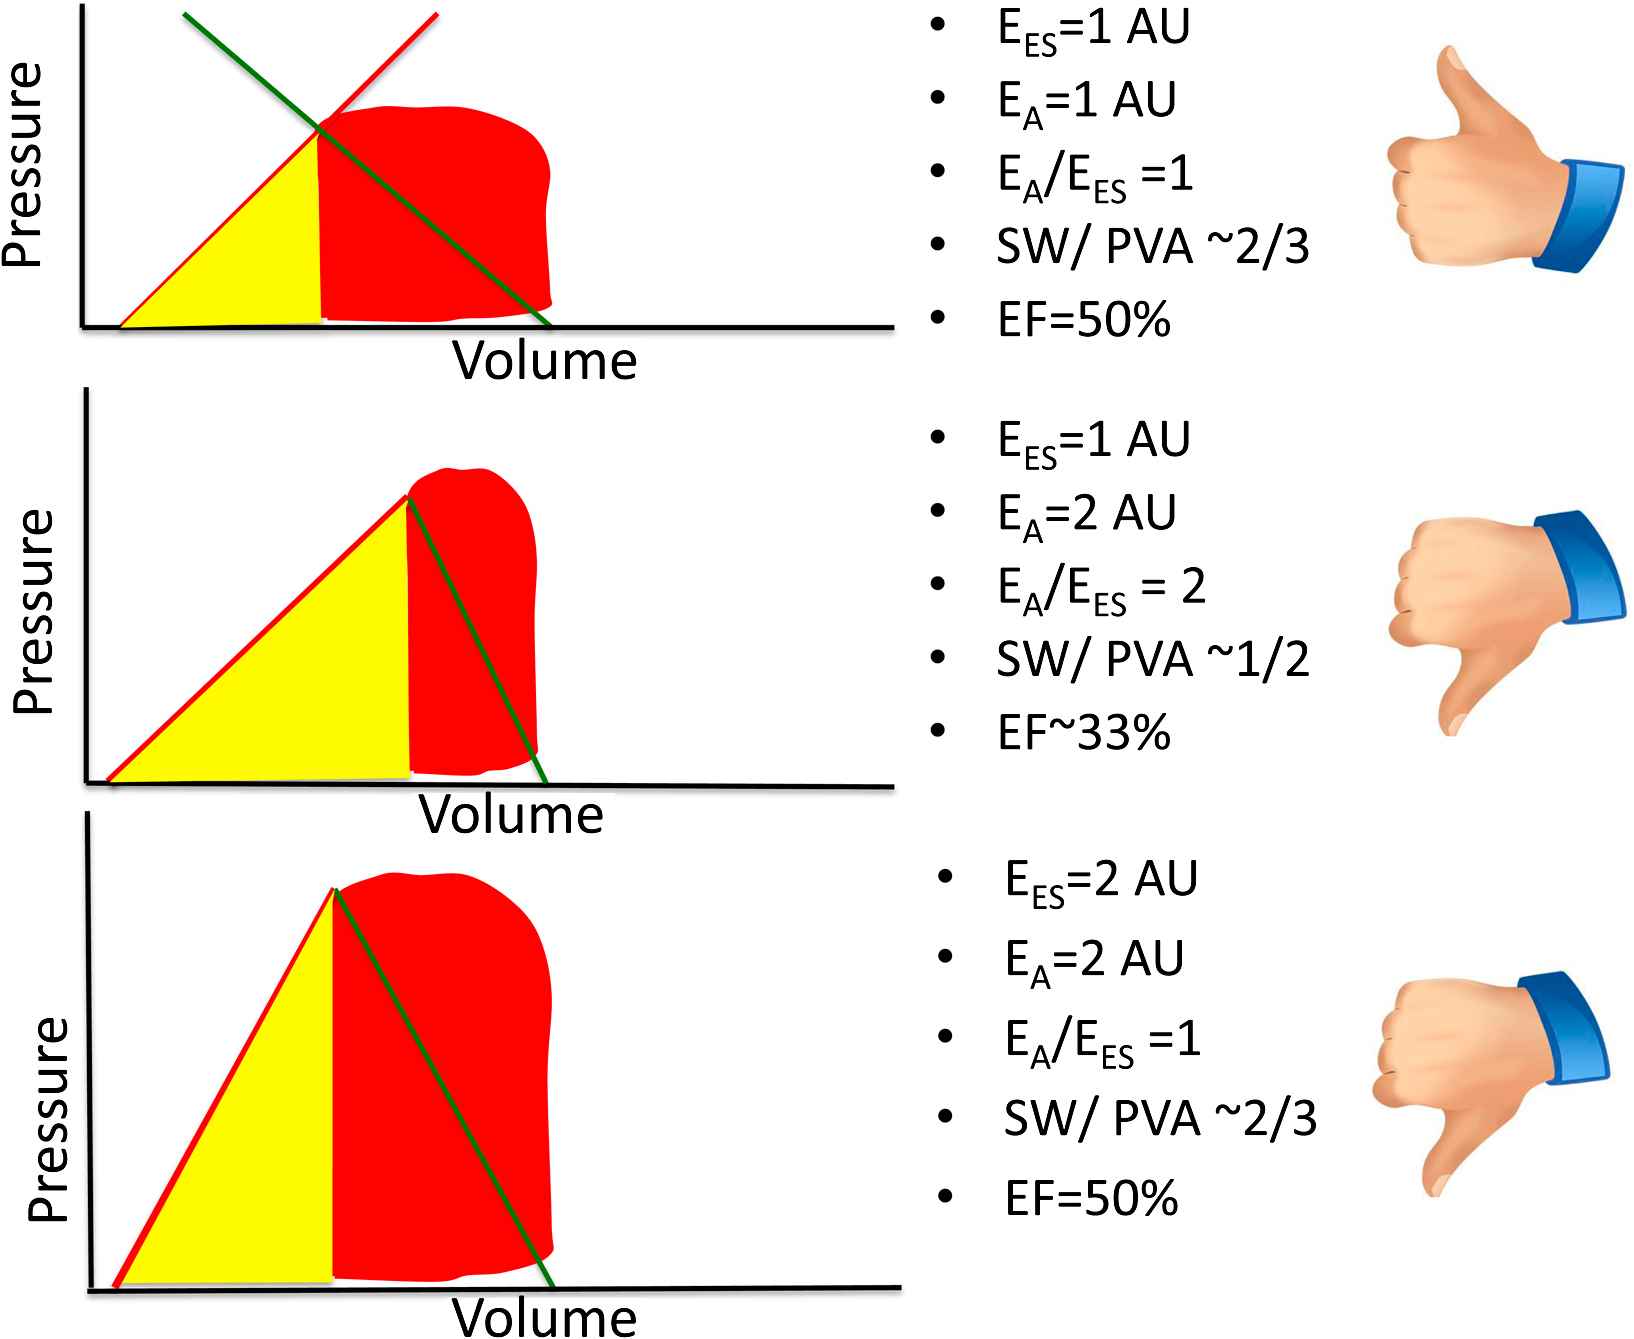
Potential consequences of a primary increase in EA on ventricular–arterial coupling. AU = arbitrary units. See text for details.
Advantages and limitations of the pressure–volume plane
Analyses of LV and arterial interactions in the pressure–volume plane are valuable and have lead to great progress in our understanding of physiologic and pathophysiologic states. This simplified approach to ventricular–arterial coupling enables an intuitive evaluation of the specific contributions of ventricular end-systolic properties and arterial system parameters in determining stroke volume and its relation to overall mechanical energetic cost.
Advantages of the pressure–volume plane (Table 1) include its well-established and highly intuitive framework, with extensive published data and its ability to quantify some LV and arterial properties in the same plane, thus characterizing important mechanical indices that have physiologic relevance from an energetic standpoint. Furthermore, these indices can be approximated using relatively simple echocardiographic methods and non-invasive blood pressure measurements.10
| Advantages |
|
| Disadvantages |
Disadvantages of EA:
|
Advantages and disadvantages of assessments of ventricular–arterial coupling in the pressure-volume plane.
Despite these important advantages, this approach also has limitations (Table 1). EA has notable disadvantages as an index of arterial load. EA has been shown to be highly sensitive to heart rate (a cardiac, rather than a ventricular property) and is thus not a pure index of arterial load.22,23 It is important to recognize that EA is mostly dependent on resistance and is therefore relatively insensitive to changes in pulsatile arterial load.22,23 Experimental evidence indicates that EA is minimally sensitive to changes in compliance over a range as large as 50%–200% of control values.24 However, pulsatile load is highly relevant for ventricular–arterial coupling in situations like aging, hypertension and heart failure, even if its effects on the end-systolic pressure/stroke volume ratio are not be prominent. Importantly, it should be avoided to accept EA as an index of arterial “stiffening” since it neither represents a physical elastance nor is it prominently affected by arterial stiffness or even by total arterial compliance.22,23 Furthermore, EA was derived using major simplifying assumptions, among which was a “square-shaped” pressure curve in systole, with its upper side corresponding to end-systolic pressure, thus ignoring the contribution of pulsatile phenomena to the contour of the arterial pressure curve above end-systolic pressure. Sunagawa et al. appropriately raised caution regarding the fact that the contribution of these phenomena can become important, with a relatively large error in this coupling model when the area under the systolic area of the curve becomes a large fraction of the overall pressure curve or when pulsatile phenomena lead to an increase in the area under the pressure curve above end-systolic pressure, which may occur for instance, at high heart rates and in the presence of prominent wave reflections, respectively.15,25 Furthermore, the derivation of EA as an index of arterial load assumed a constant ejection time, regardless of the loading conditions, whereas it is well known that ejection time can vary with afterload.25 Even is these simplifications are overseen, EA was derived from a three-element windkessel model, which, although valuable, does not account for systolic wave reflections, which are important for ventricular–arterial coupling.25–30
Shortcomings of EES should also be taken into account when interpreting the results of published studies. When subjected to rigorous examination, some fundamental principles of the LV E(t) theory do not hold in vivo. It has been shown that the end-systolic pressure–volume relation is non-linear and the degree of non-linearity depends upon the inotropic state.31–35 The presence of a V0 common to all isochrones, a key assumption of the time-varying elastance concept, has also been disproven.32,36–38 It has been shown that the peak value of the ESPVR decreases with an increase in LV size (preload), even if myocardial contractility is unchanged, which can be accounted for by the lower generated pressure corresponding to a given wall stress in the presence of greater cavity volumes.39 Furthermore, the ESPVR demonstrates afterload dependency40,41 and has been shown to be greater on ejecting beats than on isovolumic beats.31 Another important limitation of the E(t) theory is that is assumes a load-invariant time course of contraction, whereas in reality, the time course of contraction is load-dependent.42 Indeed, a fundamental assumption of EES is that the end-systolic point is reached independently of instantaneous and past pressure and volume.1–4 This intrinsically neglects the systolic loading sequence, an important determinant of LV dysfunction, LV hypertrophy and failure.43–53 An additional important limitation is of this approach is that, to the degree that, as shown by De Tombe et al.,17 non-severe abnormalities in EA/EES are of little consequence to optimization of stroke work and mechanical efficiency, the value of EES/EA as a relevant coupling index in the absence of severe disease may be questioned, since it is precisely these energetic aspects of ventricular–arterial coupling that EA/EES is meant to characterize. However, EES/EA does provide insight into the energetic aspects of ventricular–arterial coupling in the presence of important systolic dysfunction and it is in this situation where it may prove particularly useful in clinical populations.
The weak correlation between PVA and MVO2 between hearts (as detailed above) should be taken into account when interpreting results of in vivo studies. In particular, the PVA should not be thought of as a surrogate of MVO2 between individuals. Furthermore, The PVA area considers the stroke work the only “useful” energy, thus undermining the value of energy deposition in the myocardium, which favors diastolic suction. An additional important limitation of energetic optimization assessed in the pressure–volume plane is that stroke work, or “external” work does not directly dissect the physiologic importance of the flow vs. pressure generation. A high stroke volume at normal levels of systemic arterial pressure and a normal stroke volume and high levels of systemic arterial pressure, may thus be characterized by identical external work values, despite their vastly different clinical and pathophysiologic implications.
Indeed, the latter point leads to more fundamental questions about the role of regulatory processes in cardiovascular status as they relate to the pressure–volume plane. It is likely that the normal cardiovascular control system uses a unique combination of ventricular output, systemic perfusion pressure, heart rate, arterial flow and impedance patterns, which optimize ventricular performance, energetics and/or various other cellular processes. However, the pressure–volume scheme treats external stroke work (and its relation to the PVA) as the central coupling variable to be optimized. Yet, this does not intrinsically consider the vast differences between different pressure and flow states that may lead to identical stroke work values nor does it address many other cellular of mechanical processes that may require primary optimization on both the ventricle and the arteries. Indeed, Sunagawa et al. pointed out in their early seminal reports from isolated heart preparation studies,15 that their criteria for coupling optimization may not be valid for normally functioning animals or various pathologic states and raised the question of whether the maximum external stroke work is really the crucial criterion that an organism uses for optimizing the operation of the cardiovascular system in physiological circumstances, a question that remains open and that in all likelihood does not have a universal answer but one that strongly depends on specific pathophysiologic conditions.
Therefore, despite the important merits of pressure–volume analyses, it should be recognized that ventricular–arterial coupling is a broad term that encompasses different physiologic aspects, many of which are not characterized in the pressure–volume plane. Analyses of ventricular–arterial coupling should thus be complemented by more specific analyses of arterial and myocardial load that can provide additional physiologic information in various disease states.
Pulsatile load and importance of pressure–flow relations
Consideration of ventricular–arterial coupling in terms of pulsatile pressure–flow relations provides important incremental information about the physiologic status of the ventricular–arterial system. At the beginning of each cardiac cycle, the heart generates a forward-traveling energy pulse that results in increased pressure and forward flow in the proximal aorta during early systole.54,55 The energy wave generated by the LV (incident wave) is transmitted by conduit vessels and partially reflected at sites of impedance mismatch, such as points of branching or change in wall diameter or material properties along the arterial tree. Multiple small reflections are conducted back to the heart and merge into a “net” reflected wave, composed of the contributions of the scattered backward reflections. Wave dynamics are too complex to fully resolve in vivo and are usually simplified, considering only one forward (generated by the heart) and one backward wave (due to reflections in the periphery). Thus, wave reflections are often analyzed as a single discrete wave, originating from an “effective” reflection site, but this wave is actually the result of scattered reflections, originating from distributed reflection sites. In addition to hemodynamic phenomena related to wave transmission and reflections, the arterial system exerts a buffering function, which depends on its compliance and allows it to accommodate additional blood volume during systole without excessive increases in pressure and to release that excess volume throughout diastole without excessive drops in pressure.56
Arterial load can be precisely and comprehensively characterized via analyses of pressure–flow relations. Arterial input impedance analyses obtained in this manner constitute the gold standard method for the assessment of arterial load.25 Pressure–flow analyses allow the quantification of “steady” or “resistive” load and various components of pulsatile load.25,57–60 The steady component of afterload depends largely on the peripheral resistance, which in turn depends on arteriolar caliber, the total number of arterioles that are present “in parallel” and blood viscosity.25,60 It can therefore be affected by arteriolar tone, arteriolar remodeling, microvascular rarefaction and changes in blood viscosity. Pulsatile LV afterload is, in contrast, predominantly influenced by the properties of larger vessels. Although pulsatile LV afterload is fairly complex and cannot be expressed as a single numeric measure, key indices of pulsatile LV afterload can be quantified and summarized using relatively simple principles and mechanical models of the systemic circulation, using time-resolved proximal aortic pressure and flow.
Time-varying aortic pressure and flow can be assessed invasively or non-invasively. Non-invasive assessments of central pressure can be achieved using high-fidelity applanation arterial tonometry at the carotid artery.25 Aortic flow can also be measured non-invasively, using pulsed wave Doppler echocardiography61–63 or phase-contrast magnetic resonance imaging.64 The most convenient method to assess aortic inflow is pulsed wave Doppler interrogation of the LV outflow tract, given that systolic LV volume outflow equals proximal aortic volume inflow.63
LV afterload can be assessed in the frequency domain from the aortic input impedance spectrum (calculated from the harmonic components of central aortic pressure and flow waves) or estimated in the time domain.21,30,58,65,66 Input impedance is the “summed” mechanical load imposed by all vessels downstream a particular point (and which can be fully assessed by measuring time-varying flow and pressure at that particular point).57,58,63,65 Therefore, “aortic input impedance” represents the summed mechanical load impeding LV ejection. It should be noted that aortic input impedance is not exclusively determined by aortic properties, but depends on the properties of the entire arterial system.
Key parameters of pulsatile LV load include the characteristic impedance of the proximal aorta (Zc), the magnitude and timing of wave reflections and the total compliance of the arterial tree (“total arterial compliance”). The characteristic impedance of an artery can be intuitively measured as the slope of the pulsatile pressure–flow relation (where pressure and flow are measured in the same point within the artery) in the absence of reflected waves. Aortic Zc can thus be computed in the time domain using the slope of the pressure change over flow change in early systole, before the arrival of wave reflections to the proximal aorta (Fig. 6). Zc is a “local” arterial property (note the difference with input impedance); consequently, Zc measured using proximal aortic pressure and flow represents proximal aortic Zc. Wave reflections are usually assessed via wave separation analysis, based on the principle that reflected waves, by virtue of adding to pressure and subtracting from forward flow, distort the linear relationship between the increase in pressure and the increase in flow that is seen in early systole, when the pulsatile pressure–flow relation is assumed to be governed purely by ascending aortic Zc (Fig. 7). Total arterial compliance can be computed using windkessel models of the arterial tree. Frank proposed the original windkessel model as a resistance and compliance (C) pair (2-element windkessel), representing small vessel resistance and large artery compliance. The 3-element windkessel model additionally accounts for aortic characteristic impedance (Zc) in order to better isolate the effects of compliance.66 This model, originally proposed by Westerhof et al., can be considered the standard windkessel model for the systemic circulation. Several other extended models have been proposed (see Ref. 56 for review).
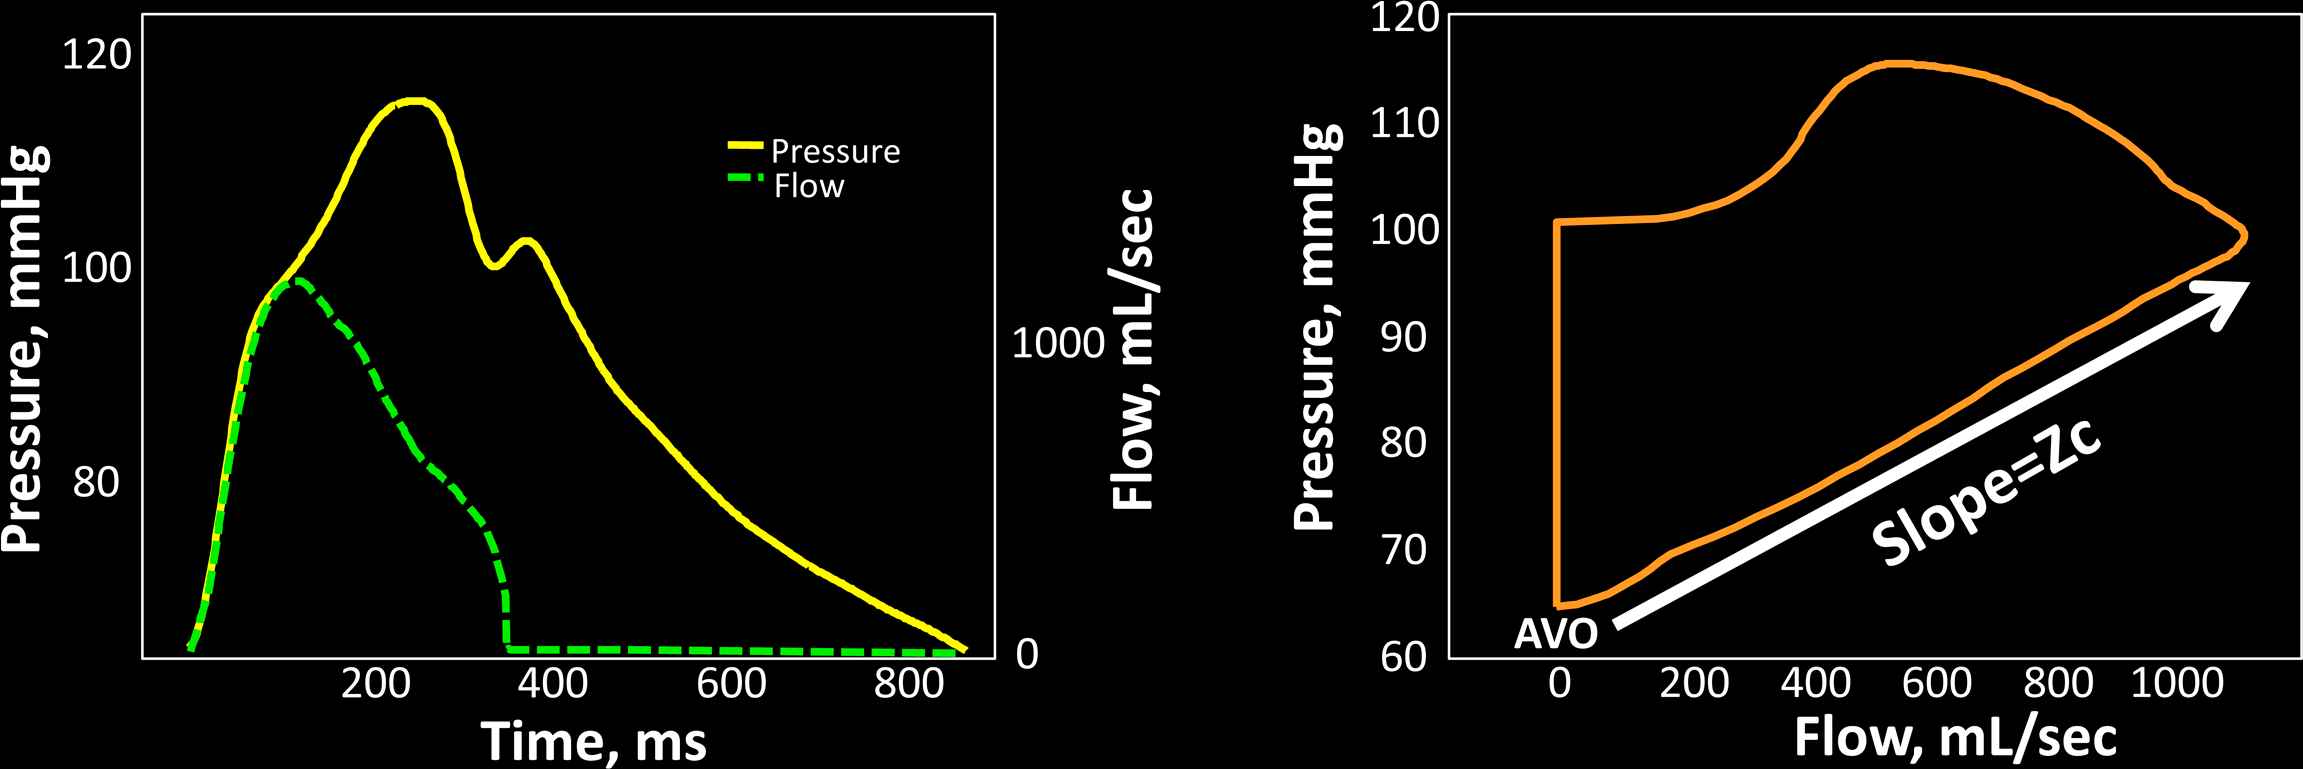
Assessment of aortic characteristic impedance (Zc) in the time domain. The left panel shows a time-aligned pressure–flow pair. Zc can be computed as the ratio of pressure change/flow change in early systole, which is effectively the linear slope of the pressure–flow relation easily identifiably in a flow–pressure loop (right panel). AVO = aortic valve opening.

Wave separation analysis. Once aortic Zc is known, the early systolic pressure–flow relation is characterized and thus pressure and flow can be quantitatively related to each other. One can think of this quantitative relation as one that scales pressure and flow so that their early values are superimposed in a time-resolved pressure and flow plot (left panel). A deviation from the linear relation between pressure and flow occurs upon the arrival of the reflected wave, which increases pressure and reduces flow, thus causing a divergence of the pressure and flow curves. The reflected wave is proportional to the red area in the left panel. The right panel shows separation of the pressure wave into its forward (blue) and reflected (red) components. (For interpretation of the references to colour in this figure legend, the reader is referred to the web version of this article.)
Determinants of pulsatile arterial load
The stiffness of various arterial segments have complex effects on ventricular afterload, through their effects on the early aortic systolic pressure rise, the total compliance of the arterial system and the velocity at which the pulse waves travel forward in the arteries and reflected waves travel backward toward the heart.30,67 In early systole, the forward-traveling energy pulse from ventricular contraction favors an increase in pressure and forward flow in the proximal aorta. If proximal aortic characteristic impedance (Zc) is high due to a stiff wall, a small aortic diameter, or both, the amount of pressure increase is relatively large for any given early systolic flow.25,54–56,58,65 The time of arrival of the reflected wave to the proximal aorta depends on the location of reflection sites and on the pulse wave velocity (PWV) of conduit vessels, particularly the aorta, which transmits both the forward and backward traveling waves.25,55,58,65 Aortic PWV is directly related to the stiffness of the aortic wall (square root of elastic modulus) and inversely proportional to the square root of aortic diameter.25,55,68 Aortic PWV is directly related to the stiffness of the aortic wall (square root of its elastic modulus). Stiffer aortas thus conduct the forward and backward traveling waves at greater velocity and therefore promote an earlier arrival of the reflected wave for any given distance to reflection sites. The distance to the reflection sites is strongly dependent on body height. In the presence of normal LV systolic function, typical effects of the reflected wave on the aortic pressure waveform include a mid-to-late systolic shoulder which determines an increase in peak (systolic) aortic pressure (and pulse pressure) and the area under the pressure curve during systole.58
The total arterial compliance depends on the summed compliance of the various arterial segments. The compliance of individual vessels is linearly proportional to vessel volume (or radius3) and, for any given “relative” vessel geometry (wall volume/lumen volume ratio), linearly and inversely proportional to wall stiffness (Young’s elastic modulus). The interaction between the stiffness and geometry of large and muscular arteries also impacts the magnitude and location of reflection sites. Reflected waves that arrive during LV ejection increase the mid-to-late systolic workload of the LV.
Consequences of pulsatile afterload for the LV myocardium
Several lines of evidence support the importance of the LV loading sequence (and not just “absolute” pulsatile load) in LV remodeling and heart failure.49–51 Late systolic loading has been shown to induce much more pronounced LV hypertrophy and fibrosis in an animal model compared to early systolic loading, at identical peak LV pressure levels.49 In humans, reductions in wave reflection magnitude occurring during antihypertensive therapy predict regression of LV mass independently of blood pressure reduction.51 Similarly, animal26 and human studies45 have demonstrated an adverse effect of late systolic load on diastolic relaxation. A recent study showed that the magnitude of wave reflections, estimated from radial pressure waveforms, strongly predicted incident heart failure in the multiethnic study of atherosclerosis.29
The deleterious effects of wave reflections on the myocardium may be due to intrinsic differences in cellular processes between early and late systole. During early ejection, active development of fiber cross-bridges occurs in the electrically activated myocardium and peak myocardial wall stress occurs (bee below),69 whereas a transition from contraction to relaxation may occur at the myocardial level in mid-to-late systole, during which increases in load may lead to more hypertrophy16 and abnormal diastolic relaxation.43,70 The differential effect of time-varying myocardial afterload on cellular processes taking place in early and late ejection should be a focus of further research.
Myocardial wall stress
Various indices of LV afterload are useful because they are meant to be purely reflective of arterial properties.58 However, arterial load should always be interpreted by considering interactions between arteries and the LV as a pump58,71 and also between myocardial elements and instantaneous LV geometry and the time-varying load imposed by the systemic circulation. Wall stress represents the time-varying mechanical load experienced by the contractile elements in the myocardium (myocardial afterload) and is related to the amount of force and work the muscle does during a contraction.
There are several methods to estimate wall stress using LV geometric and LV pressure measurements. A particularly useful formula, applicable to axisymmetric ventricles for computation of average LV myocardial fiber stress was developed by Arts et al.72 and may be used for calculating time-resolved ejection-phase fiber stress using a central pressure waveform (given that in the absence of aortic stenosis, central arterial pressure during ejection is very similar to ventricular pressure) and time-resolved LV-geometric information (derived from 2D-echocardiography, 3D-echocardiography or magnetic resonance imaging).30,69,72–74 This method does not neglect radially-directed forces or forces generated within the wall that oppose fiber shortening, which vary significantly with cavity and wall thickness and can interfere with direct comparisons of myocardial fiber stress at different times during ejection. The formula is based on LV cavity volume (Vlv), LV wall volume (Vw) and pressure:
It is important to recognize the advantages of assessing time-resolved ejection-phase LV wall stress as opposed to end-systolic wall stress. Throughout systole, myocardial fiber activation results in the development of tension (stress) and shortening of myocardial segments, which results in progressive ejection of blood from the LV cavity and wall thickening. During early ejection, active development of fiber cross-bridges occurs in the electrically activated myocardium and peak myocardial wall stress occurs,69 at a time when systolic pressure co-exists with quasi-diastolic geometry (relatively thin wall and relatively large cavity) (Fig. 8A–D). Myocardial fiber shortening and ejection of blood determine a progressive change in LV geometry, which causes a drop in myocardial stress (despite rising pressure) during mid-to-late systole. This can be quantified as a clear “shift” in the pressure–stress relation (Fig. 8E) and appears to be ideal for the myocardium to handle the additional load imposed by systolic wave reflections, which are “universal” in adults. This shift, however, may be insufficient and/or compromised in the setting of wave reflections of early onset or large magnitude74–76 and in the presence of lower LV ejection fraction.69,75
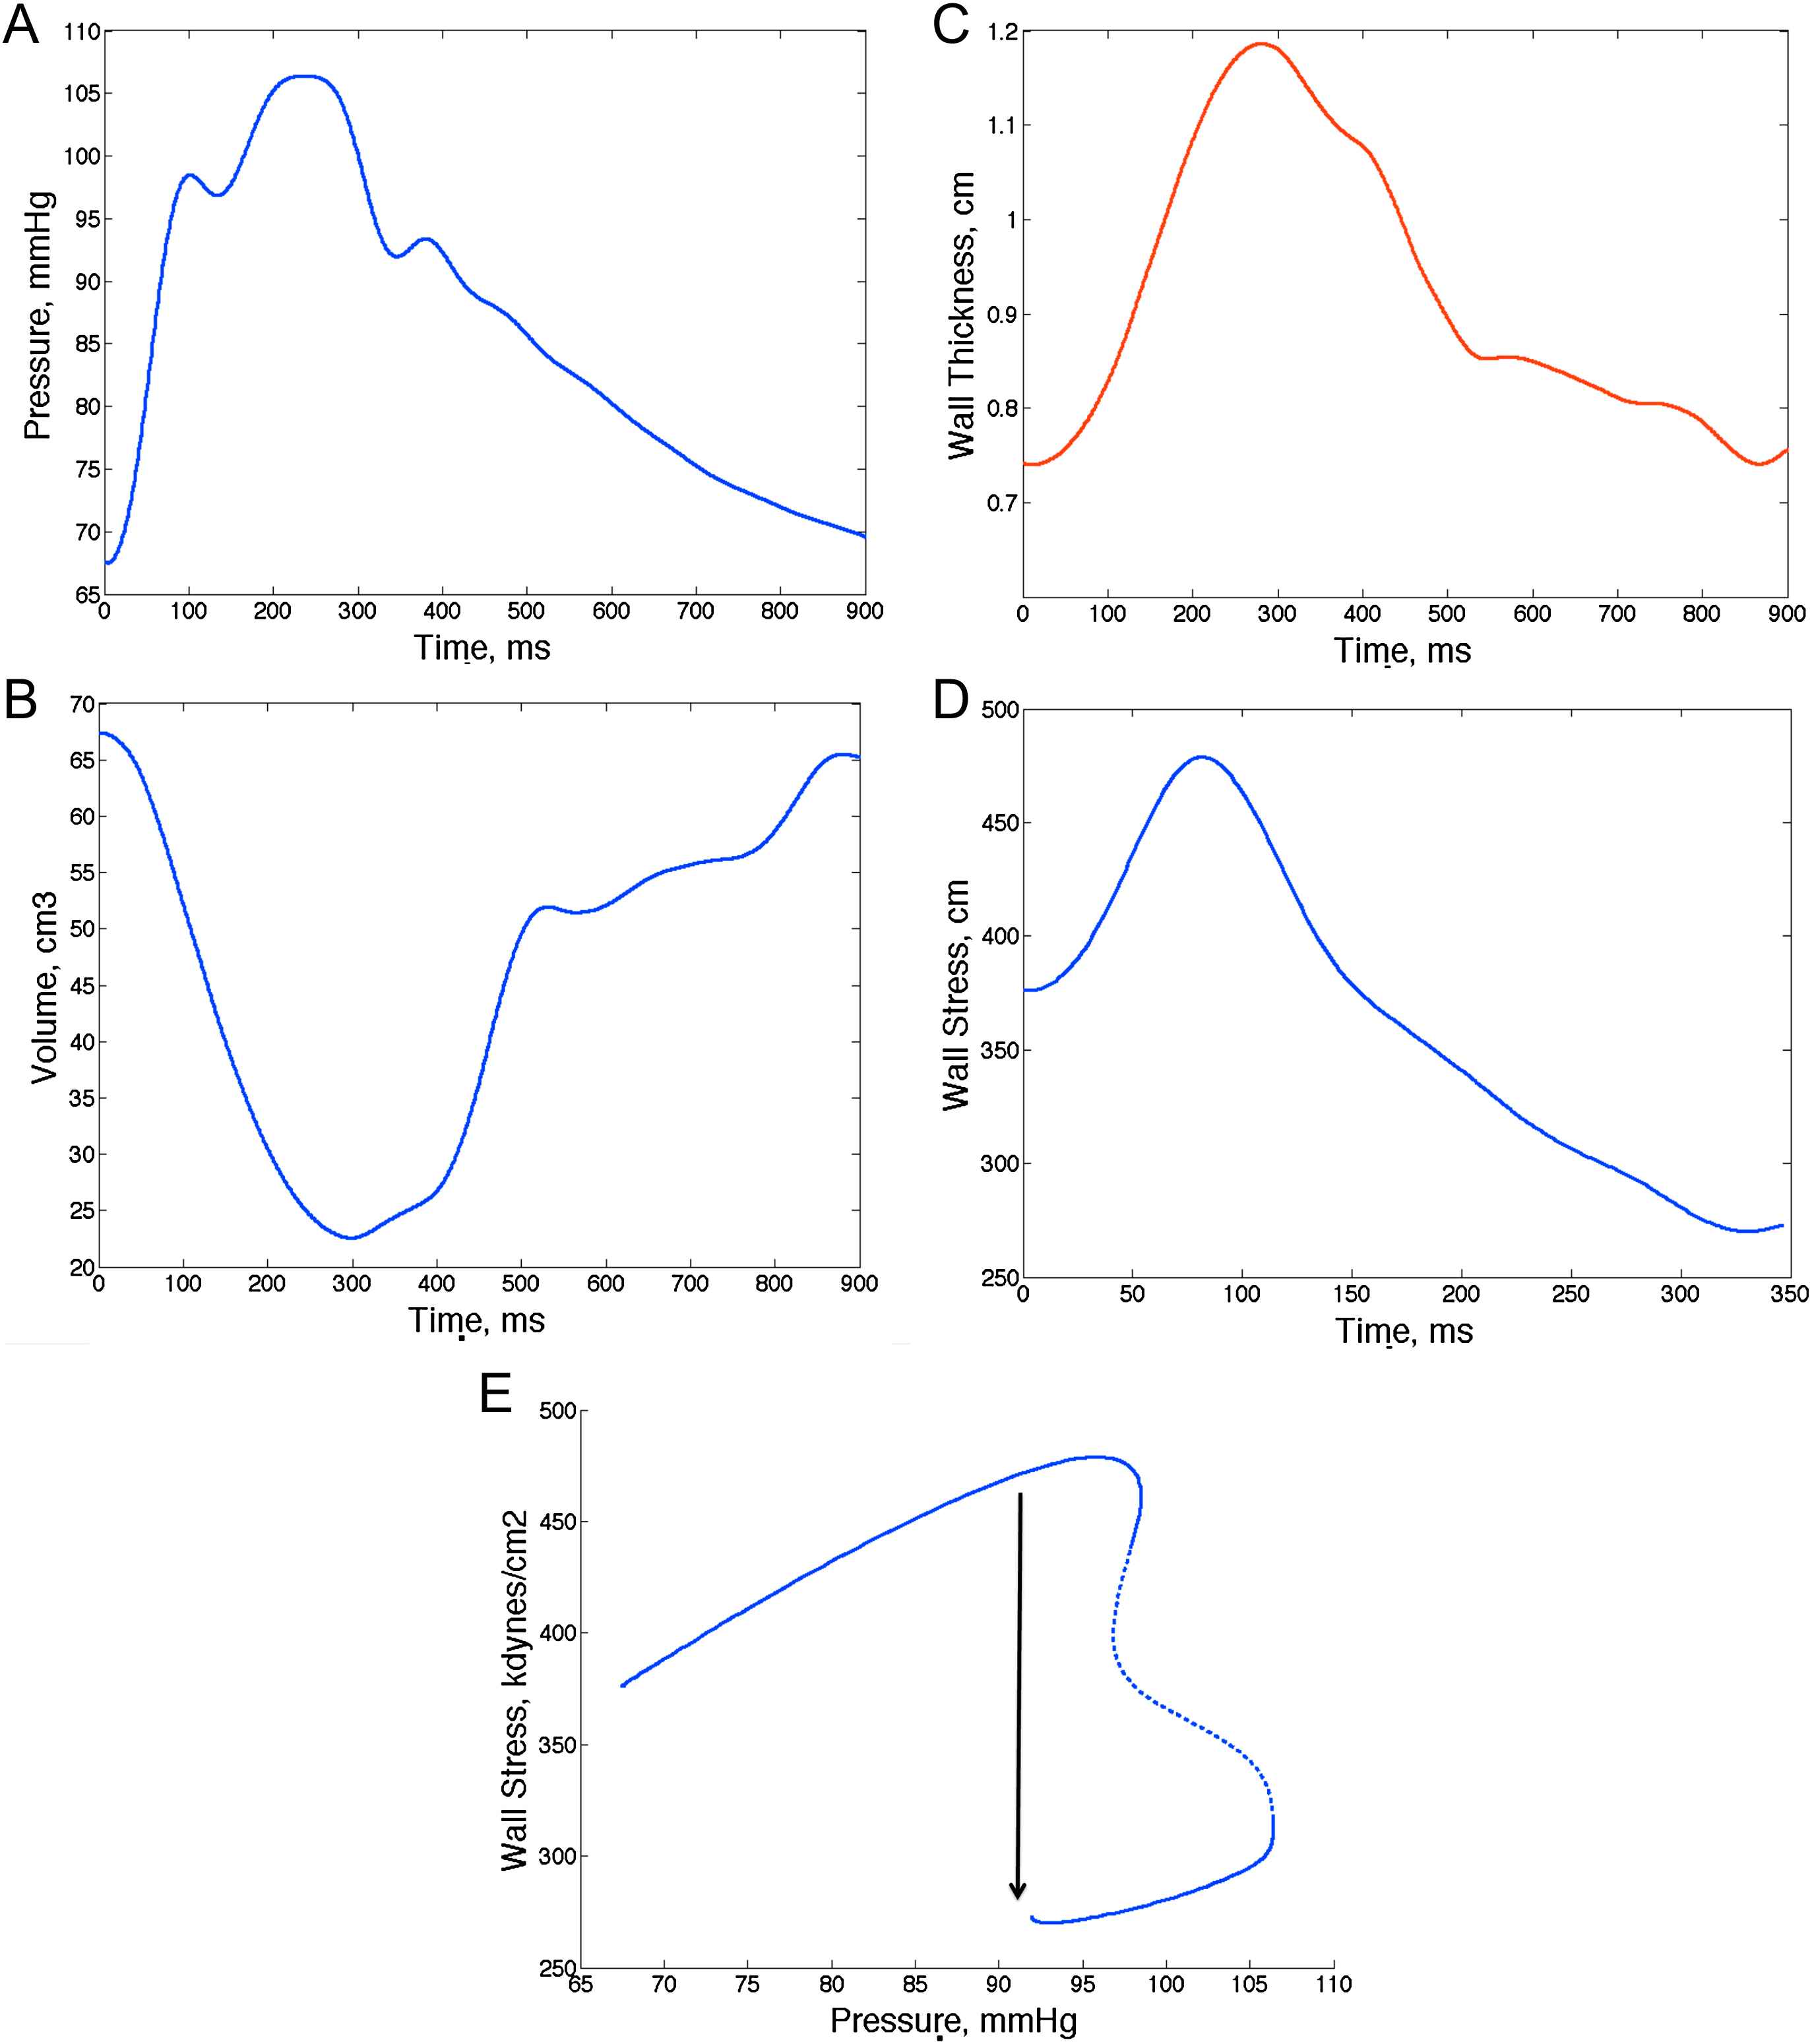
Example of assessments of time-resolved myocardial wall stress. Arterial tonometry can provide a time-resolved pressure curve (A), whereas speckle-tracking echocardiography and other imaging techniques can provide time-resolved LV geometry (B: cavity volume; C: wall thickness). One can thus compute myocardial wall stress at each time point and generate a time-resolved stress curve (D). Notice the early systolic myocardial wall stress peak. E shows a pressure–stress plot, which shows a mid-systolic shift of the pressure–flow relation which favors lower stress values in late systole despite rising pressure. This mechanism may protect the myocardium against wave reflections and may be overcome when there is excessive wave reflection magnitude or intrinsic myocardial dysfunction leading to an abnormal ejection pattern that prevents the mid-systolic shift in the pressure–stress relation.
As expected from physiologic principles, various arterial properties affect time-varying myocardial wall stress differently.74 Whereas SVR is a very important determinant of wall stress throughout systole, Zc selectively affects early systole and peak systolic wall stress, wave reflections and TAC correlate with myocardial stress in mid and late systole and significantly influence the area under the stress-curve generated for any given flow output.74 Interestingly, women seem to demonstrate greater peak and end-systolic wall stress as well as a higher ejection-phase stress–time integral, even after adjustment for arterial properties, which might relate to the differential susceptibility of women to heart failure.74
A time-resolved wall stress curve also allows for characterization of the myocardial loading sequence, which can be expressed as a ratio of the stress–time integral in late versus early systole. A high late-to-early systolic stress time integral ratio has been shown to be associated with reduced indices of myocardial systolic contraction and diastolic relaxation,73 further supporting the role of the myocardial loading sequence in myocardial dysfunction and providing a link between wave reflections and the risk of incident heart failure, as has been reported in the general population.29
Conclusions
The long-enduring problem of adequately assessing ventricular–arterial interactions in clinical populations, normal individuals and pre-clinical stages of the continuum of cardiovascular disease is being facilitated by advances in the non-invasive assessment of central arterial pressure–flow relations and non-invasive cardiac imaging. It is clear that afterload and ventricular–arterial interactions are important and that they can be characterized with non-invasive techniques. It also seems clear that the non-invasive assessment of afterload and ventricular–arterial interactions offers the potential for a greater mechanistic understanding of normal physiology, early stages of heart and vascular disease and established heart disease at various clinical stages, particularly the continuum of LV remodeling associated with prevalent conditions such as hypertension and obesity and its progression to heart failure. Whereas analyses of ventricular–arterial coupling in the pressure–volume plane provide a simple, intuitive and useful framework, other comprehensive non-invasive hemodynamic assessments should be more widely applied in human studies. Given the importance of LV afterload and its impact on the heart, afterload should be carefully considered or ruled out as a potential mediator or confounder in a wide variety of observed relationships or therapeutic and adverse effects of interventions related to LV remodeling, LV function or vasoactive interventions. Importantly, blood pressure or EA should not be taken as adequate surrogates for pulsatile afterload.
Modeling approaches for pressure, flow and geometric data are likely to continue to evolve, allowing for a more accurate assessment of hemodynamic patterns and their effects on cardiac load and function. The same is true for ventricular mechanical modeling. For example, the non-invasive assessment of wall stress in geometrically distorted ventricles remains extremely challenging. Novel techniques such as cardiac MRI elastography may aid in direct measurements of myocardial material properties, whereas diffusion-tensor MRI can provide subject-specific data regarding cardiac fiber orientation, both of which could greatly enhance modeling approaches. Similarly, in arterial hemodynamics, there is still a need to reconcile various paradigms and to do so with an optimal compromise between precision and simplicity, yet achieving meaningful, intuitive and accurate physiologic information that can be ultimately implemented in clinical and epidemiologic research settings. Fluent discussions between population scientists, clinical researchers, bioengineers, physiologists and basic scientists working in this field, facilitated by existing international professional societies such as ARTERY, constitute an important process that should enhance the progress of our understanding of ventricular–vascular coupling and its relationship to human health.
Funding
This work was funded by grant ?5 R01 HL 080076-05.
References
Cite this article
TY  - JOUR
AU  - Julio A. Chirinos
PY  - 2013
DA  - 2013/01/10
TI  - Ventricular–arterial coupling: Invasive and non-invasive assessment
JO  - Artery Research
SP  - 2
EP  - 14
VL  - 7
IS  - 1
SN  - 1876-4401
UR  - https://doi.org/10.1016/j.artres.2012.12.002
DO  - 10.1016/j.artres.2012.12.002
ID  - Chirinos2013
ER  -