
Differences in pulse pressure day variability between the brachial artery and the aorta in healthy subjects
ADP and TGP contributed equally to the manuscript.
- DOI
- 10.1016/j.artres.2011.11.001How to use a DOI?
- Keywords
- Pulse pressure; Variability; Time-dependent variability; Arterial-dependent variability; Aortic blood pressure; Augmentation index; Pulse pressure amplification
- Abstract
Objectives: To search for: (i) potential differences in the within-subject pulse pressure (PP) day time variability between the brachial artery and aorta; (ii) the presence of substantial day time variation in the aortic-to-brachial (AtB) PP disparity.
Background: Brachial blood pressure (BP) variability is a risk factor, but also a source of inaccuracy for the assessment of BP-related cardiovascular risk. PP differs substantially in simultaneous measurements at the brachial artery and the aorta; this is of clinical importance regarding accurate cardiovascular risk assessment and reduction strategies. Whether the brachial and the aortic PP time variability is similar, and whether the AtB PP disparity varies during the day is not known.
Methods: In 13 healthy volunteers hourly assessment of brachial and aortic PP was performed (8:00–19:00) under controlled conditions at home.
Results: Aortic PP day variability was consistently and significantly lower than brachial PP (assessed by: standard deviation, variance and time rate variation index, p < 0.05 for all). Individual AtB PP difference (brachial – aortic PP, mmHg) varied substantially within all the 13 subjects; a significant variation during the day in the AtB PP amplification (defined as brachial/aortic PP) was evident (p = 0.006).
Conclusions: By taking into account both time and arterial space, substantial physiological differences in PP variability between the brachial artery and the aorta were observed. These novel findings suggest that non-invasive 24-h aortic ambulatory BP monitoring is warranted in order to significantly improve CV risk assessment and reduction strategies. This possibility must be tested in future clinical studies.
- Copyright
- © 2011 Association for Research into Arterial Structure and Physiology. Published by Elsevier B.V. All rights reserved.
- Open Access
- This is an open access article distributed under the CC BY-NC license.
Introduction
Arterial blood pressure (BP) exhibits significant within-subject variability in time. In clinical practice this phenomenon is evident in several different occasions or patterns, such as: beat-to-beat, hour-to-hour, circadian, or visit-to-visit BP variation.1–4 Time dependent BP variability is a major source of inaccuracy regarding the individualization of BP associated cardiovascular (CV) risk; multiple office and out of office BP recordings are recommended by the international guidelines in order to assess the “usual” BP that reflects more accurately the individual’s CV risk.5 On the other hand new data substantiate the old concept1 that high time-dependent BP variability – i.e. circadian6 or visit-to-visit7,8 – is associated with increased CV mortality and thus it may represent, independently from the usual BP, a potentially modifiable CV risk factor (9).
Independently from time (i.e. for the same instant) BP varies also substantially from arterial site to site (e.g. along the upper limb).9–11 In terms of biophysics, this could be termed as arterial-dependent BP variability. It is confined to the pulsatile component of the BP (pulse pressure, PP) which is amplified from the aorta to the peripheral arteries, while mean BP remains almost constant within the macrocirculation.9 For example, a subject may have at the very same moment radial PP = 50 mmHg, brachial PP = 42 mmHg and aortic PP = 34 mmHg.
In clinical practice the disparity of BP from arterial site to site can be now easily assessed between the aorta and the brachial artery and can be expressed as the aortic-to-brachial (AtB) ratio of PP (PP amplification) or the absolute difference in mmHg.9 The AtB PP disparity is clinically relevant for three cardinal reasons: (a) aortic PP is more closely associated with target organ damage, and likely with CV mortality, than brachial PP12,13; (b) it is modifiable by antihypertensive drugs and dietary habits independently from brachial PP, i.e. brachial PP cannot reflect aortic PP response to treatment9,14,15; (c) it is itself an independent predictor of CV risk.16–18
The study hypothesis is that differences in local arterial compliance or haemodynamics may lead to differences in local PP variability from arterial site to site. Currently, there is no information indicating whether aortic PP variability and brachial PP variability are similar, or not. Since central BP can be estimated non-invasively only by non-automated methods, it has been very difficult to manually record repeatedly, during the day, central BP under normal conditions. Despite these methodological difficulties, we have previously shown in a study designed to investigate the hourly (from 8:00 to 19:00) variability of wave reflections in healthy subjects under controlled conditions,19 that augmentation index (AIx), i.e., an index of wave reflections and cardinal determinant of the AtB disparity,9 exhibit significant day variation.19 This may have an impact on the AtB day variation which may be substantial and clinically meaningful. In order to test these two hypotheses we performed a post-hoc analysis of the previous study,19 now focussing on the simultaneous variability of brachial and aortic PP within the day.
Methods
Study population
Thirteen healthy (7 females; 6 males) non-smokers volunteers (family members and close friends of the investigators), free of any type of medical drug treatment or nutritional/vitamin supplementation were included in the study. Mean age and body mass index were 40.7 ± 4.6 years and 23.9 ± 1.20 kg/m2, respectively.
Study protocol
All subjects were examined on Sundays at their own home (except from 4 subjects, i.e. close friends who were examined at the investigators’ home) in a quiet, temperature controlled room (22 °C–24 °C). The participants were advised to abstain from consuming alcohol, caffeine as well as all products containing these substances at least 12 h before the day of the study. To ensure dietary compliance 24 h prior to the day of study recalls were reviewed. Twelve sequential assessments of brachial and aortic BP with 1 h intervals were performed beginning at 8:00 and ending at 19:00. The 1st BP assessment was performed within 1 h after the subject’s arousal. During this period the participants (i) consumed a controlled breakfast and a controlled meal after their sixth measurement at 13:00; (ii) they abstained from alcohol, beverages, coffee and soft drinks; (iii) they did not engage in any intensive physical or mental activity or any other type of intense stress. Informed written consent was obtained by all volunteers before entering the study, and the protocol was approved by the local Scientific Committee.
Haemodynamic measurements
Triple brachial BP recordings were performed in the sitting position by a validated automatic oscillometric device (Omron HEM 705-CP, Kyoto, Japan)20 according to the international guidelines.21 The average systolic and diastolic BP of all three readings was used in the analysis. Aortic BP and wave reflections were assessed by the FDA approved Sphygmocor device (AtCor Medical Pty. Ltd. Sydney, Australia) by the use of an invasively validated mathematical model (generalized transfer function) which transforms the radial pressure wave to the aortic wave.22 In brief, immediately after brachial BP recordings, radial tonometry was performed and the obtained pressure waveform was calibrated with the average brachial diastolic and systolic BP. Wave reflections were assessed by AIx adjusted at heart rate 75 b.p.m. (AI@75). AtB PP amplification was assessed according to the previously accepted definition: “brachial PP/aortic PP”.9
Indices of BP variability
In the present study we focused on local (brachial and aortic) PP variability since mean BP remains constant between the aorta and the brachial artery. Within subject BP variability in time (beat-to-beat, minute-to-minute, hour-to-hour or visit-to-visit) can be expressed by various indices, each one providing different information.1–4,6,8 Herein PP variability over time was assessed by:
- (i)
the hour-to-hour change as well as the maximum and minimum values of the repeated measurements (all in mmHg) during the day;
- (ii)
the within subject standard deviation (SD) and variance (Var) of average PP during the day. Variance is defined as Var = SD2;
- (iii)
the coefficient of variation (CVar) which is defined as the ratio of the SD of the multiple measures divided by their mean value;
- (iv)
the intraclass correlation coefficient (ICC). ICC assesses the reproducibility of repeated measurements by comparing the variability of different measurements at the same subject to the total variation across all measurements and all subjects. In general ICC is calculated by the formula:
- (v)
The rate of PP time dependent variability, as previously defined by Time Rate Variation (TRV) index, which is an independent predictor of target organ damage.23
The time rate of PP variation is defined as the first derivative of the PP values against time. Because we have discrete values, the derivatives are approximated by differences. Given 2 PP readings, Si and Si+1 at time indices ti and ti+1 respectively, the rate of PP change is defined as follows: ri = (Si+1 − Si)/(ti+1 − ti). Thus, for each patient with N blood pressure recordings, the following variable, to which we refer as time rate of PP variation (mmHg/min), was calculated by the formula:
- (vi)
The PP variation in the arterial space was expressed by the AtB PP amplification and the AtB PP difference in mmHg which is the ratio of brachial to aortic PP and the brachial minus the aortic PP, respectively.
Statistical analysis
Values are presented as mean value ± standard error (SE), unless otherwise stated. Variables were tested for distribution normality by Shapiro–Wilk test. Analysis of variance (ANOVA) for repeated measures was used to test the null hypothesis for hour-to-hour day variability of brachial PP, aortic PP, PP amplification and AI@75. Paired t-test was used to evaluate differences between brachial and aortic haemodynamic parameters. All tests were two sided and P values <0.05 were considered statistically significant. Statistical analysis was performed by SPSS software version 19.0 (SPSS Inc., Chicago, Illinois).
Results
The day-minimum, day-maximum and day-average values of brachial PP were consistently and significantly higher than aortic PP (Table 1). Day PP amplification fluctuated from 1.29 to 1.63 (average 1.46) and the difference (mmHg) of brachial PP – aortic PP fluctuated from 8.3 to 18.3 mmHg (average 12.8 mmHg).
| Day-minimum | Day-maximum | Day-average | |
|---|---|---|---|
| Brachial PP (mmHg) | 31.9 ± 2.6a | 55.2 ± 3.6a | 43.5 ± 3.1a |
| Aortic PP (mmHg) | 22.3 ± 2.3 | 38.7 ± 3.1 | 30.6 ± 2.8 |
| PP amplification (%) | 1.29 ± 0.04 | 1.63 ± 0.05 | 1.46 ± 0.05 |
| Brachial PP – aortic PP (mmHg) | 8.3 ± 0.8 | 18.3 ± 1.2 | 12.8 ± 1.1 |
p < 0.001 between brachial versus aortic parameters (assessed by paired t-test).
Mean (±standard error) values in the totality (n = 13) of the population of: day-minimum, day-maximum and day-average (brachial and aortic) pulse pressure (PP), as well as of the aortic-to-brachial PP amplification and of the difference brachial – aortic PP.
It was also observed that the brachial and aortic PP hourly change (e.g. from 10:00 to 11:00) showed disagreement (defined as increase of peripheral PP with decrease of central PP, or vice versa) 16 times out of total number of 143 (11 h by hour changes/per subject), that is 11.2% (data not shown).
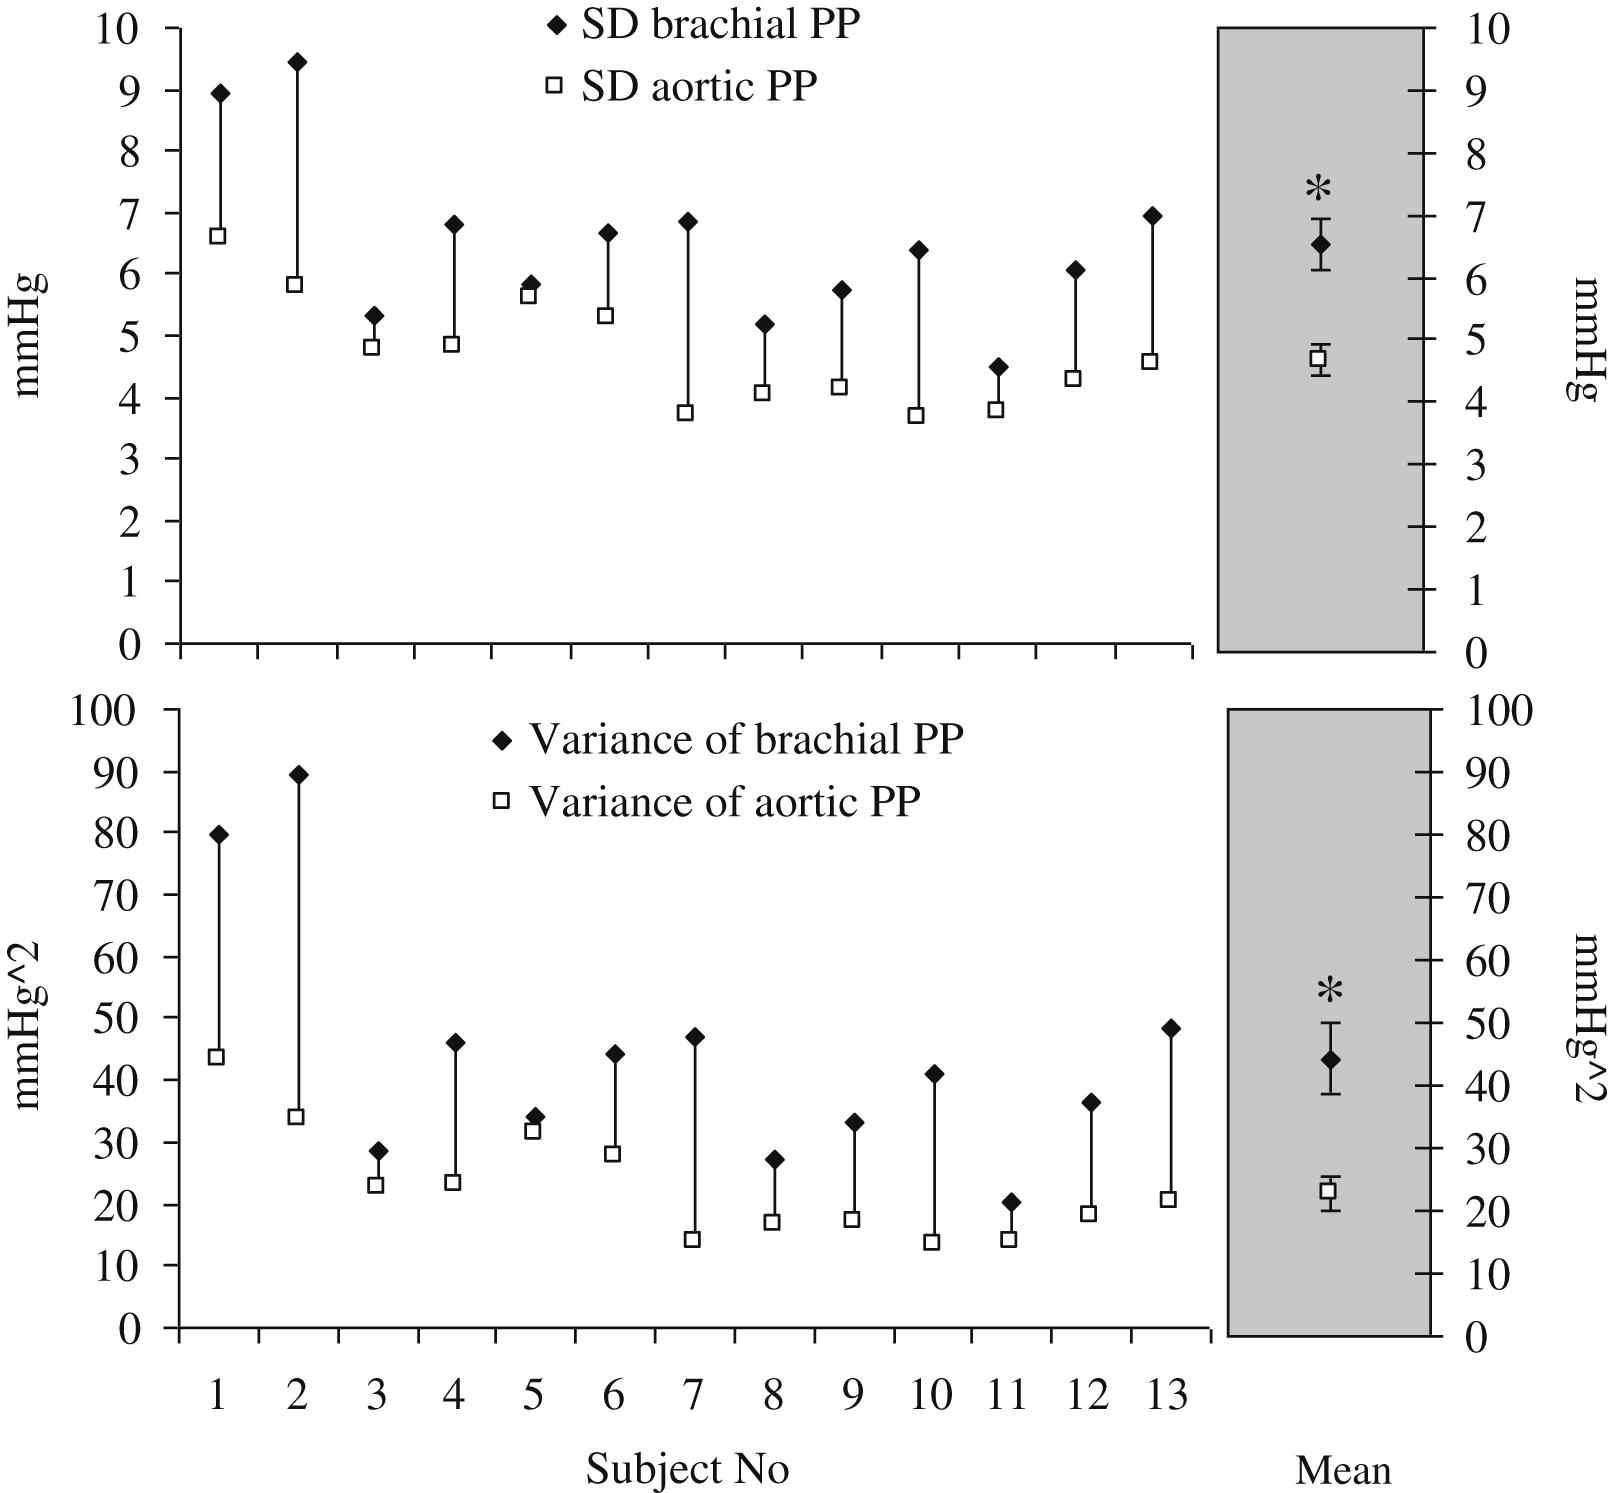
The day variability of brachial and aortic PP was compared by means of their SD and Var as illustrated at Fig. 1. In almost all subjects aortic PP had lower variability than brachial PP. In the totality (right grey panel of Fig. 1) of the population aortic PP had lower variability than brachial PP (p < 0.001 for SD and p < 0.001 for Var). The CVar of brachial and aortic PP was similar (15.5 vs 16.2%, p = 0.304); brachial PP had lower ICC than aortic PP (0.79 vs 0.85, p = 0.001) (data not shown in Fig. 1).
The rate of hour-to-hour change of PP was assessed by time rate variability (TRV) index. In almost all subjects aortic PP time rate variability index was lower than the brachial one (Fig. 2). In the totality of the population (right grey panel of Fig. 2) aortic PP had lower time rate variability than brachial PP (Fig. 2, p < 0.001).
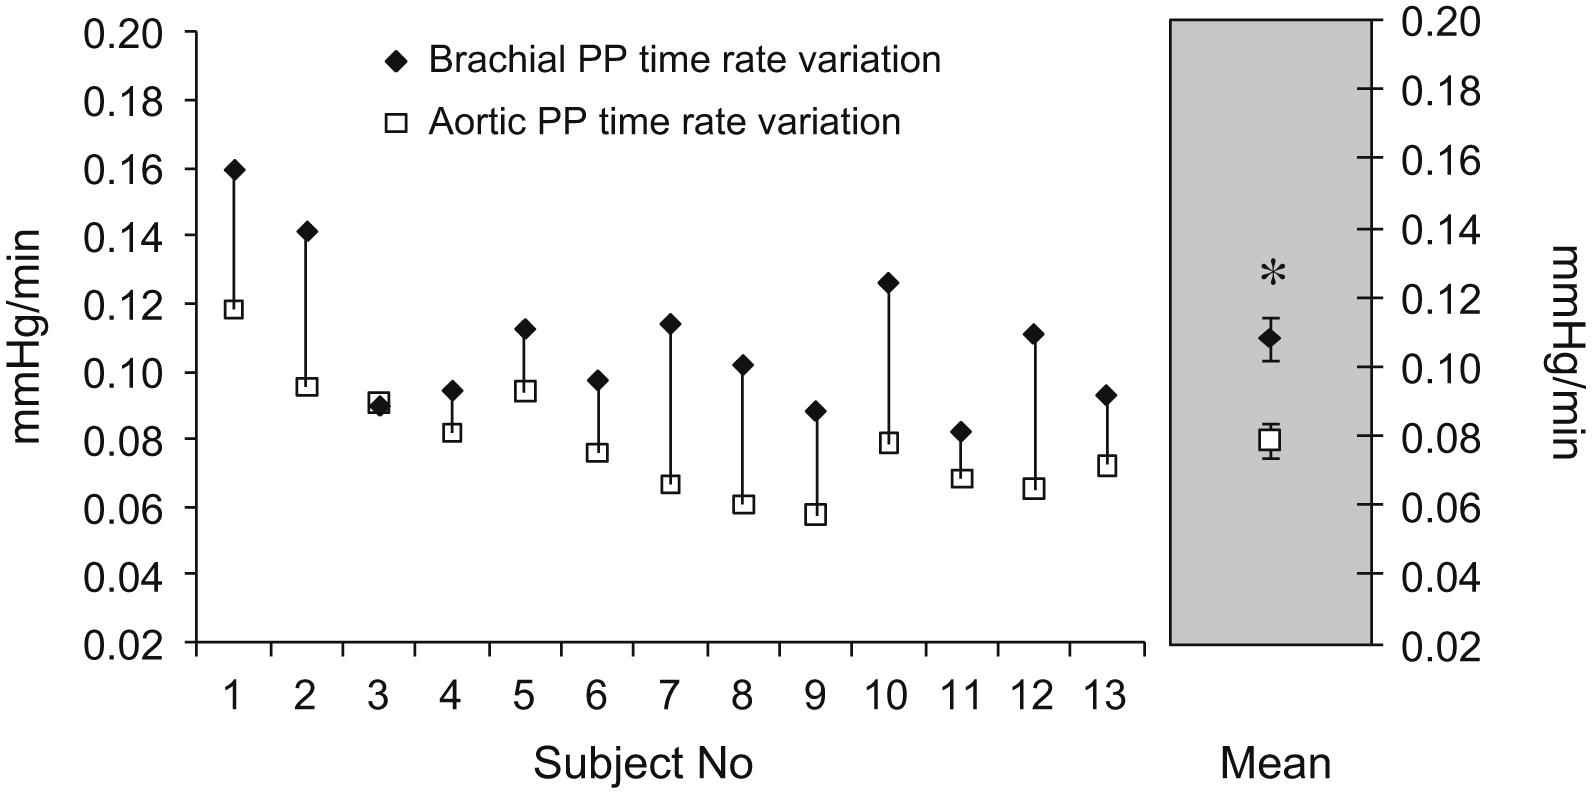
Within each individual subject (left panel) and population average (right grey panel) difference in Time Rate Variation index of pulse pressure (PP) between brachial artery and aorta. ∗p < 0.05 for brachial vs aortic by paired t-test.
Substantial variation of the brachial PP – aortic PP (mmHg) was observed in each individual during the day as shown by the population’s average of day’s maximum “brachial – aortic PP” minus the day’s minimum “brachial – aortic PP” was 10.8 ± 0.9 mmHg (data not shown).
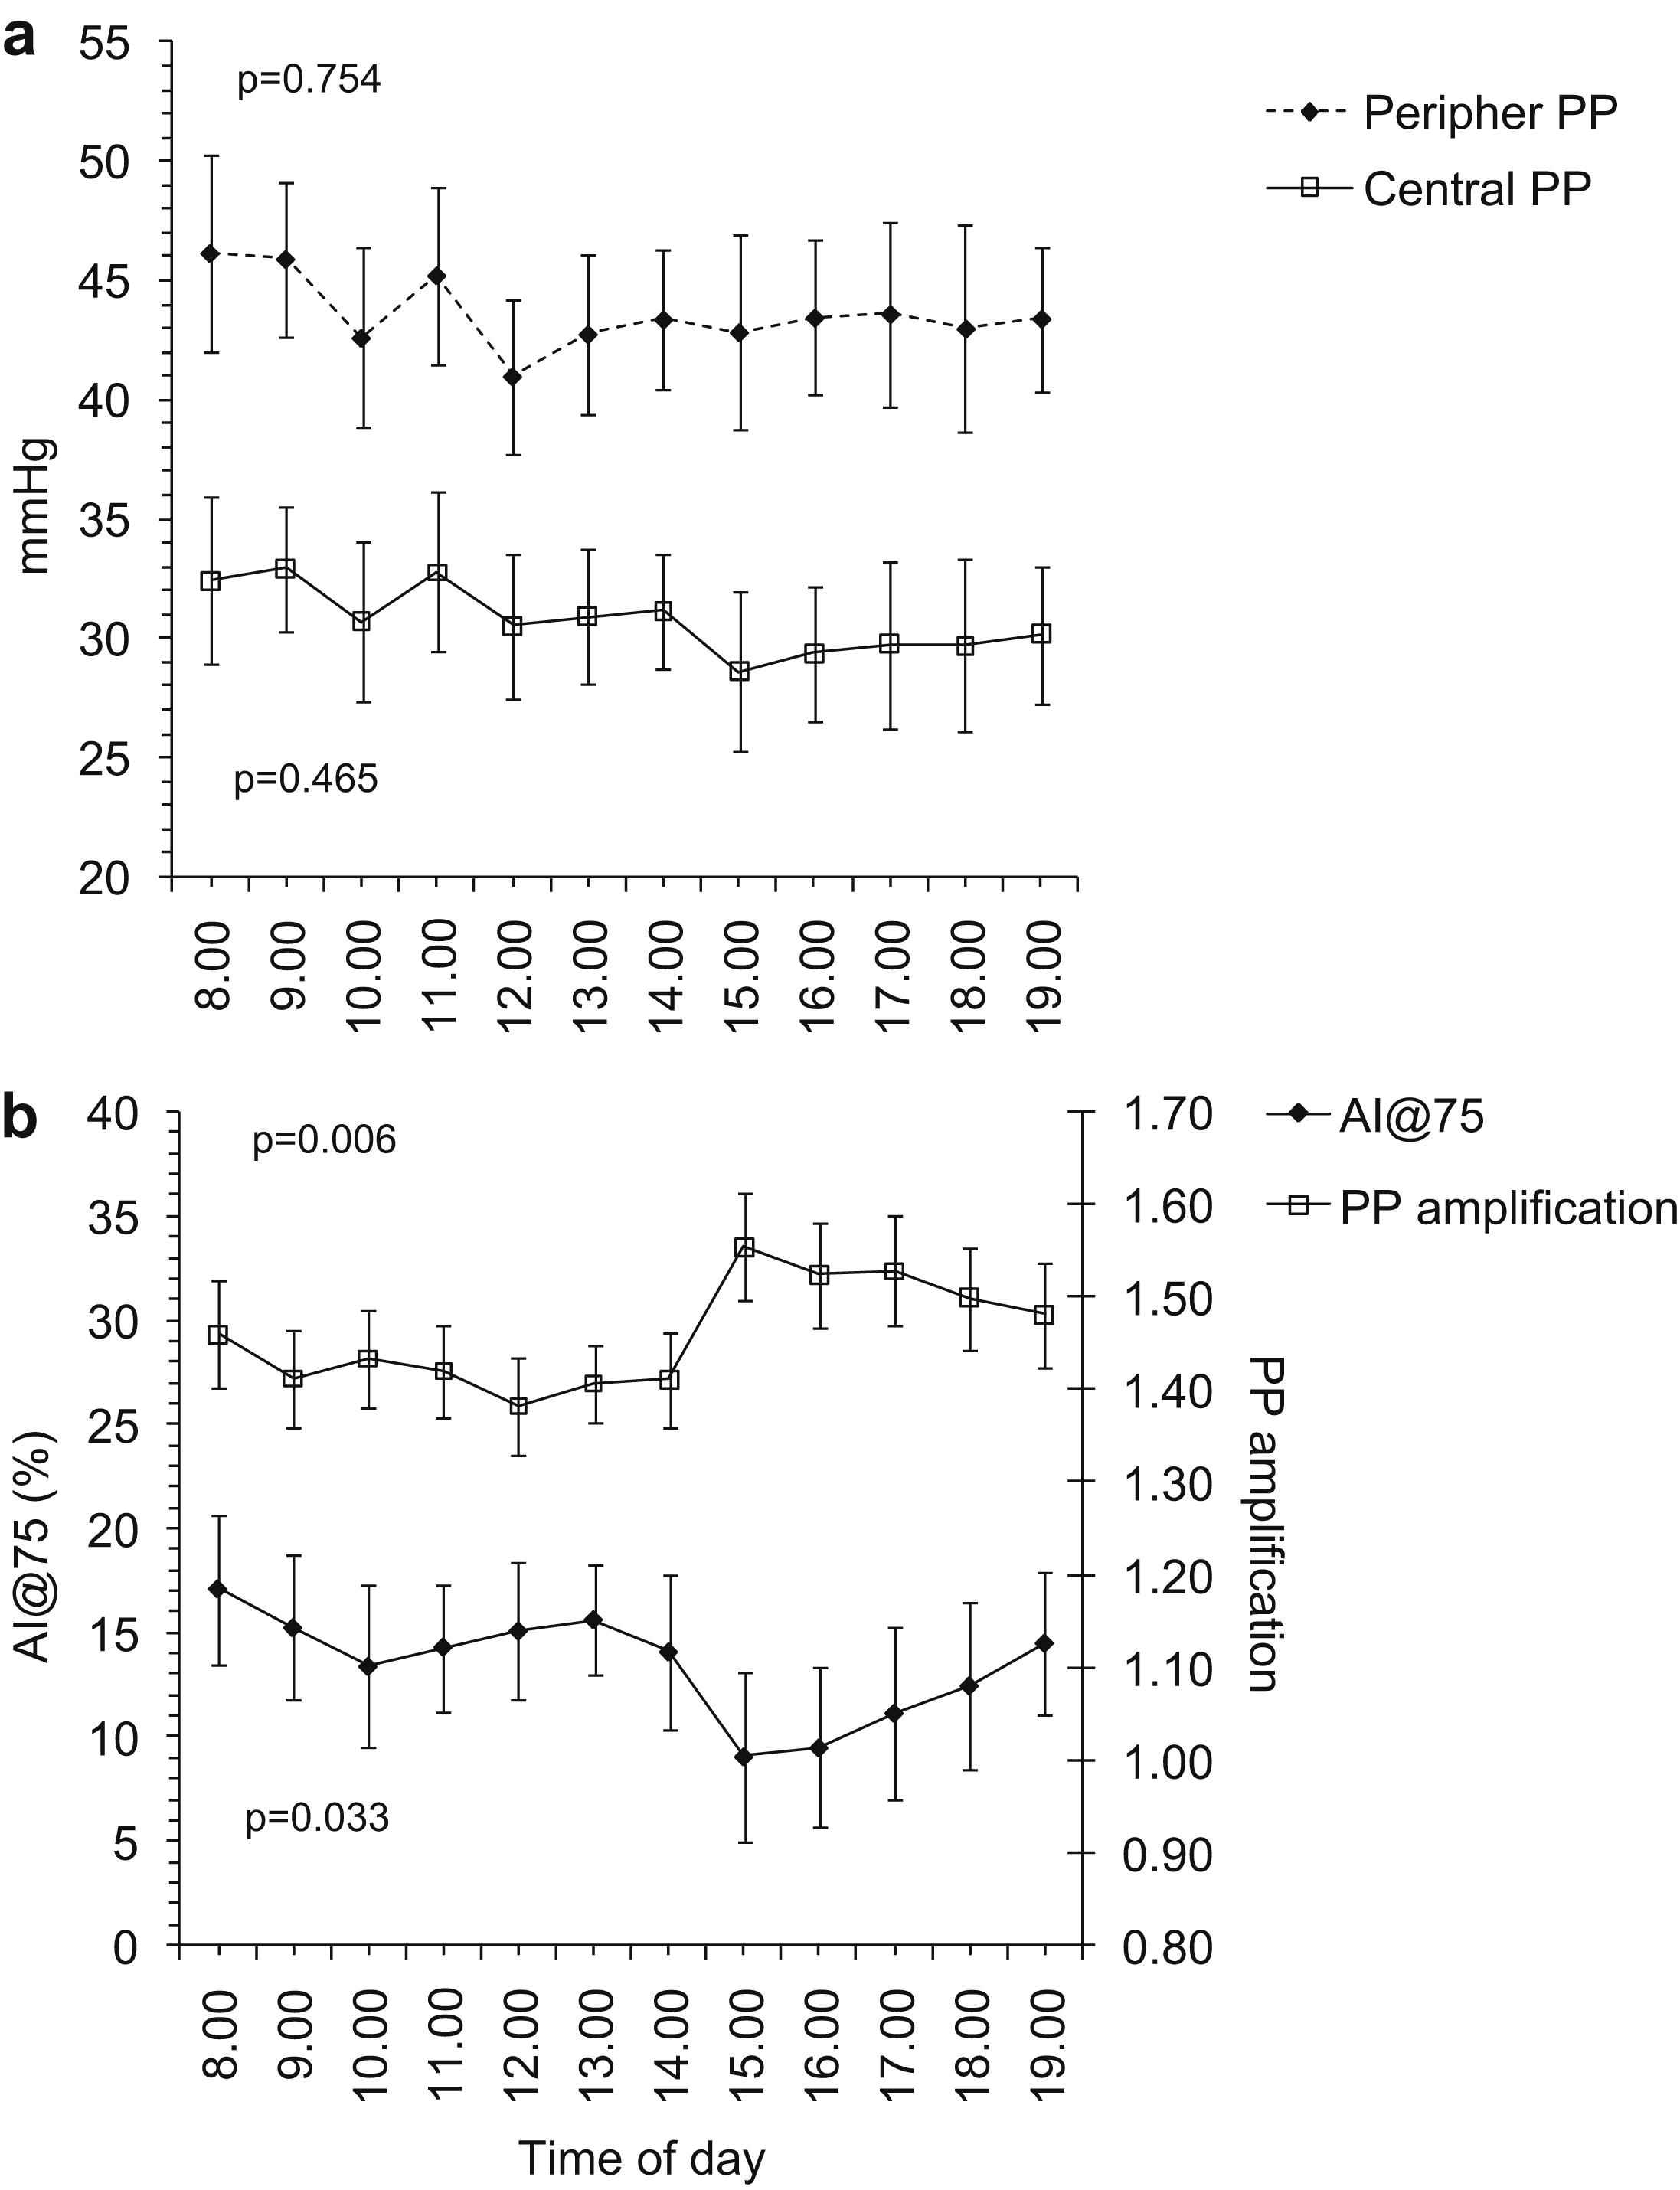
Hour-to-hour analysis of both brachial and aortic PP exhibited non-significant day variability (Fig. 3a). AtB PP amplification and AI@75 exhibited significant hour-to-hour day variation (p = 0.006 and p = 0.033, respectively, Fig. 3b). The lowest values for AtB PP amplification were observed in the morning hours and the highest in the afternoon; the day variation of AI@75 exhibited a “mirror” pattern to PP amplification. Mean BP exhibited non-significant day variation (data not shown in Fig. 3).
Discussion
This is the first study that evaluated the within-subject PP variability taking into account the time (hour-to-hour) and arterial space (AtB PP disparity) factors. Of note, this was evaluated during the day (8:00–19:00) in healthy volunteers in an out of office setting (at home) under controlled (dietary and stress) conditions. The novel findings are two. First, it was found that aortic PP variability during the day is consistently and significantly lower than brachial PP variability, as assessed by SD, Var and the TRV index. Second, it was shown that there is significant and clinically important hourly variation regarding the disparity between the brachial and aortic PP as assessed by: (a) their absolute difference (mmHg) and (b) the AtB PP amplification (i.e. brachial/aortic PP ratio). These findings were observed in the absence of significant mean BP day variation and may have major implications for clinical research and practice in the field of arterial hypertension.
Limitations and strengths of the study
The accuracy of the results on PP disparity between the brachial artery and the aorta in comparison to the actual intra-arterial pressure variability is only partly limited by the fact that non-invasive methods have been applied. Brachial PP recorded by the oscillometric devices is known to be underestimated due to overestimation of the diastolic BP and underestimation of systolic BP.24 The inaccuracy of central haemodynamic parameters may be greater due to the calibrating procedure of the peripheral pressure waveforms and the applied generalized transfer functions which are incorporated within the Sphygmocor device.9,25 For the same reason aortic PP variability may exhibit lower reproducibility, that might explain the lower ICC which was observed in the present study.
In the present study repeated recordings of brachial PP with simultaneous assessment of aortic PP were preformed every 1 h. Smaller time intervals between readings might provide more information on time dependent BP variability and different SD of both brachial and aortic PP.1 Yet this is not likely to have affected the relation between them.
The initial design and aim of this laborious study was to investigate the circadian variation of pressure wave reflections under controlled conditions. These conditions minimize the random effects and favour the experimental aim of the present post-hoc analysis i.e. to reveal the physiological inherent fluctuations of PP at the level of both the brachial artery and the aorta. On the other hand this study limitation is the lack of normal subject’s activity and the lack of night recordings, thus the present data cannot be extrapolated to casual home or ambulatory BP monitoring. For the same reason the present data may have underestimated the magnitude and clinical relevance of PP variability in time and arterial space.
Interpretation of the results
The present data show that, in the absence of classical vasoactive substances, strenuous mental or physical stress, aortic PP day variability (as evidenced by SD, Var and TRV index) was significantly lower than the brachial PP day variability. This observation can be attributed, at least in part, to the different dumping ability between the large elastic arteries and the muscular conduit arteries. Because when evaluating BP variability the mean BP is regarded as a confounder, i.e. local BP variability is influenced by the level of mean BP, we adjusted PP variability for mean BP (i.e. by the CVar). We observed similar CVar values at the level of the brachial artery and the aorta. In our view this is mostly a statistical and not physiological meaningful result. Given the fact that: (i) mean BP is practically equal at the level of the aorta and the brachial artery, and (ii) mean BP had non-significant day variation, the present study provides the first direct evidence independently from MBP, regarding the interaction between local PP variability and local arterial stiffness. This is most likely a two-way interaction that should be further explored in longitudinal studies.
We also showed that aortic and brachial PP do not vary in parallel. In more than 10% of our observations, the hourly change (e.g. from 10:00 to 11:00) showed disagreement (defined as increase of peripheral PP with decrease of central PP, or vice versa). Of note, substantial (e.g. from 6 to 23 mmHg) within subject day variation was observed in the difference: brachial – aortic PP. Similarly, the AtB amplification exhibited significant day variation. These results cannot be attributed to the methodologies applied. They suggest the presence of partly different physiological mechanisms that control central and peripheral pressure pulsatility.
We speculate that this second major finding of the present study, i.e. the fact that there is substantial day variation in the disparity of brachial and aortic PP, is related to and partly explained by the first finding, namely the significant lower day variability of PP at the peripheral than at the central arteries. It seems to be also partly explained by the day (hour-to-hour) variation of AIx, which looked like a “mirror” image of the day hour-to-hour variation of PP amplification. It is currently proposed that pressure wave reflections underlie in part the genesis of PP amplification,9 The present data suggest that the day variation of pressure wave reflections (as assessed by AIx) may be also a dominant factor leading to the day variation of the AtB PP amplification; or alternatively that a common mechanism underlie both phenomena.
Clinical implications
Time dependent BP variability5 and the AtB PP disparity9,10,26 are both confounding factors regarding the accurate stratification of the BP associated CV risk in clinical practice. The present findings show that these two phenomena “interact” and provide evidence on the highly variable degree of inaccurate assessment of aortic PP by the isolated recording of brachial PP. These data strongly support the need to incorporate 24-h aortic PP recordings27,28 in small clinical trials in hypertensive populations in order to test whether such actions will substantially improve the BP associated CV risk stratification in relation to target organ damage prediction.
Moreover, the present data may help in the interpretation of the results obtained from clinical trials regarding the ability brachial BP circadian pattern to predict cardiovascular events on the basis of “interaction” between the variability of PP in time and along the arterial tree (space).29–35
Finally, the recently published data8,36 suggest that the interpretation of clinical trials in hypertension must take into consideration brachial BP time variability as a risk factor in order to predict outcomes. The present study highlights the fact that aortic PP variability differs from brachial PP variability in both magnitude and rate of change, i.e. in two biomarkers related to CV disease,1,6,23 and thus may have different predicting ability or response to drug treatment. These findings may account for the inability of previous studies to demonstrate consistent, strong and independent significant associations between brachial BP time variability and carotid or heart hypertrophy.37
The present evidence and clinical implications need to be confirmed by larger studies applying the now available non-invasive 24-h aortic BP assessment.27,28 If verified, we should rethink not simply on BP variability but also to consider its “interaction” with the AtB amplification in the design of future clinical trials. The ideal method for the assessment of BP associated CV risk should both minimize inaccuracies regarding the assessment of the usual BP level but also be informative regarding the PP time- and arterial-dependent variability.
Conflict of interest
None.
Abbreviations
- BP
blood pressure
- PP
pulse pressure
- CV
cardiovascular
- AtB
aortic-to-brachial
- AIx
augmentation index
- AI@75
AIx adjusted at heart rate 75 b.p.m.
- Var
variance
- CVar
coefficient of variation
- ICC
intraclass correlation coefficient
- TRV
time rate variation
References
Cite this article
TY  - JOUR
AU  - Athanase D. Protogerou
AU  - Theodore G. Papaioannou
AU  - Petros P. Sfikakis
AU  - Jacques Blacher
AU  - Emmanouil Karatzis
AU  - John P. Lekakis
AU  - Dimitris Papadogiannis
AU  - Christodoulos Stefanadis
AU  - Michel E. Safar
PY  - 2011
DA  - 2011/12/21
TI  - Differences in pulse pressure day variability between the brachial artery and the aorta in healthy subjects
JO  - Artery Research
SP  - 34
EP  - 40
VL  - 6
IS  - 1
SN  - 1876-4401
UR  - https://doi.org/10.1016/j.artres.2011.11.001
DO  - 10.1016/j.artres.2011.11.001
ID  - Protogerou2011
ER  -