
Importance of the aortic reservoir in determining the shape of the arterial pressure waveform – The forgotten lessons of Frank
- DOI
- 10.1016/j.artres.2007.08.001How to use a DOI?
- Keywords
- Aortic pressure; Wave reflection; Windkessel; Aortic cushioning; Augmentation index
- Abstract
It has been recognised for nearly 200 years that the human pressure waveform changes in shape with ageing and disease. The shape of the pressure waveform has been explained in terms of two fundamental models: the Windkessel (reservoir) and wave theory. In its simplest form the Windkessel model satisfactorily explains the pressure waveform in diastole but cannot model pressure changes in systole. Wave theory satisfactorily models the pressure waveform but predicts the existence of ‘self-cancelling’ forward and backward waves in diastole which are difficult to explain in biological terms. We propose that a hybrid reservoir–wave model better describes the pressure waveform and may enable assessment of aortic function from pressure measurements made at any large systemic artery.
- Copyright
- © 2007 Published by Elsevier B.V. on behalf of Association for Research into Arterial Structure and Physiology.
- Open Access
- This is an open access article distributed under the CC BY-NC license.
Shortly after Marley (1863) made the first non-invasive measurements of the arterial pulse waveform it was noticed that the shape of the arterial pressure waveform changed markedly with ageing and disease.1 It was Frank, one of the most acclaimed physiologists of the last century, who proposed a model to explain these features, termed the arterial Windkessel.2 Whilst Frank’s model could accurately describe the shape of the pressure waveform during diastole, it could not account for the sharp upslope of the pressure waveform during systole, or the shoulder later in systole. As a result, this technique lost popularity in favour of the newer techniques based on wave theory described by Womersely3 and McDonald4 and further developed by Westerhof et al. This approach has gained wide acceptance and separates pressure into forward- and backward-travelling (or reflected) components.5
One major limitation of these ‘wave-only’ techniques is that they are based on one-dimensional theory and consequently neglect the accumulation of blood due to radial expansion of the elastic arteries in systole: the aortic ‘cushioning’ or ‘reservoir’ effect. Womersely and McDonald were aware of this potential difficulty and cautioned that their theories were based on “two very drastic assumptions” namely that the aorta “be regarded as a rigid tube” and “arterial expansion be neglected”.3,4 Clearly neither is true in the human aorta, however, as there was no other technique to explain all the features of the pressure waveform these assumptions are usually overlooked.
Consequences of failing to account for aortic reservoir
Ignoring the effects of the aortic reservoir has important and, arguably, misleading consequences. A good example of this is in the proximal aorta: in diastole, after closure of the aortic valve, proximal aortic flow rapidly falls to zero, but pressure remains high. The zero flow requires a zero proximal-to-distal pressure gradient and the only way this can be achieved in the ‘wave-only’ approach is to postulate identical pressures originating from both the proximal and distal ends of the artery. In the wave-only analysis total pressure is therefore apportioned to notional forward-travelling waves and notional backward (reflected) waves of equal magnitude; this is an unavoidable consequence of the theory. In fact in diastole while there is no flow into the system from the heart (and hence no flow at the aortic root) there can be flow out of the system as the source of this outflow is the stored volume of blood contained within the reservoir of the elastic arteries; this amounts to approximately 40% of the stroke volume.6 Thus, the self-cancelling forward and backward waves are an artefact of events that occur outside the one-dimensional domain considered by the wave analysis. Indeed it is difficult to envisage a plausible biological mechanism that could account for a continued forward pressure of such magnitude after closure of the aortic valve. Equally implausible is the ‘mirror-image’ matching of the exponential decline in pressure in proximal- and distal-originating waves, a matching that somehow happens in every subject, and continues throughout the entire diastolic period (Fig. 1, upper panel).
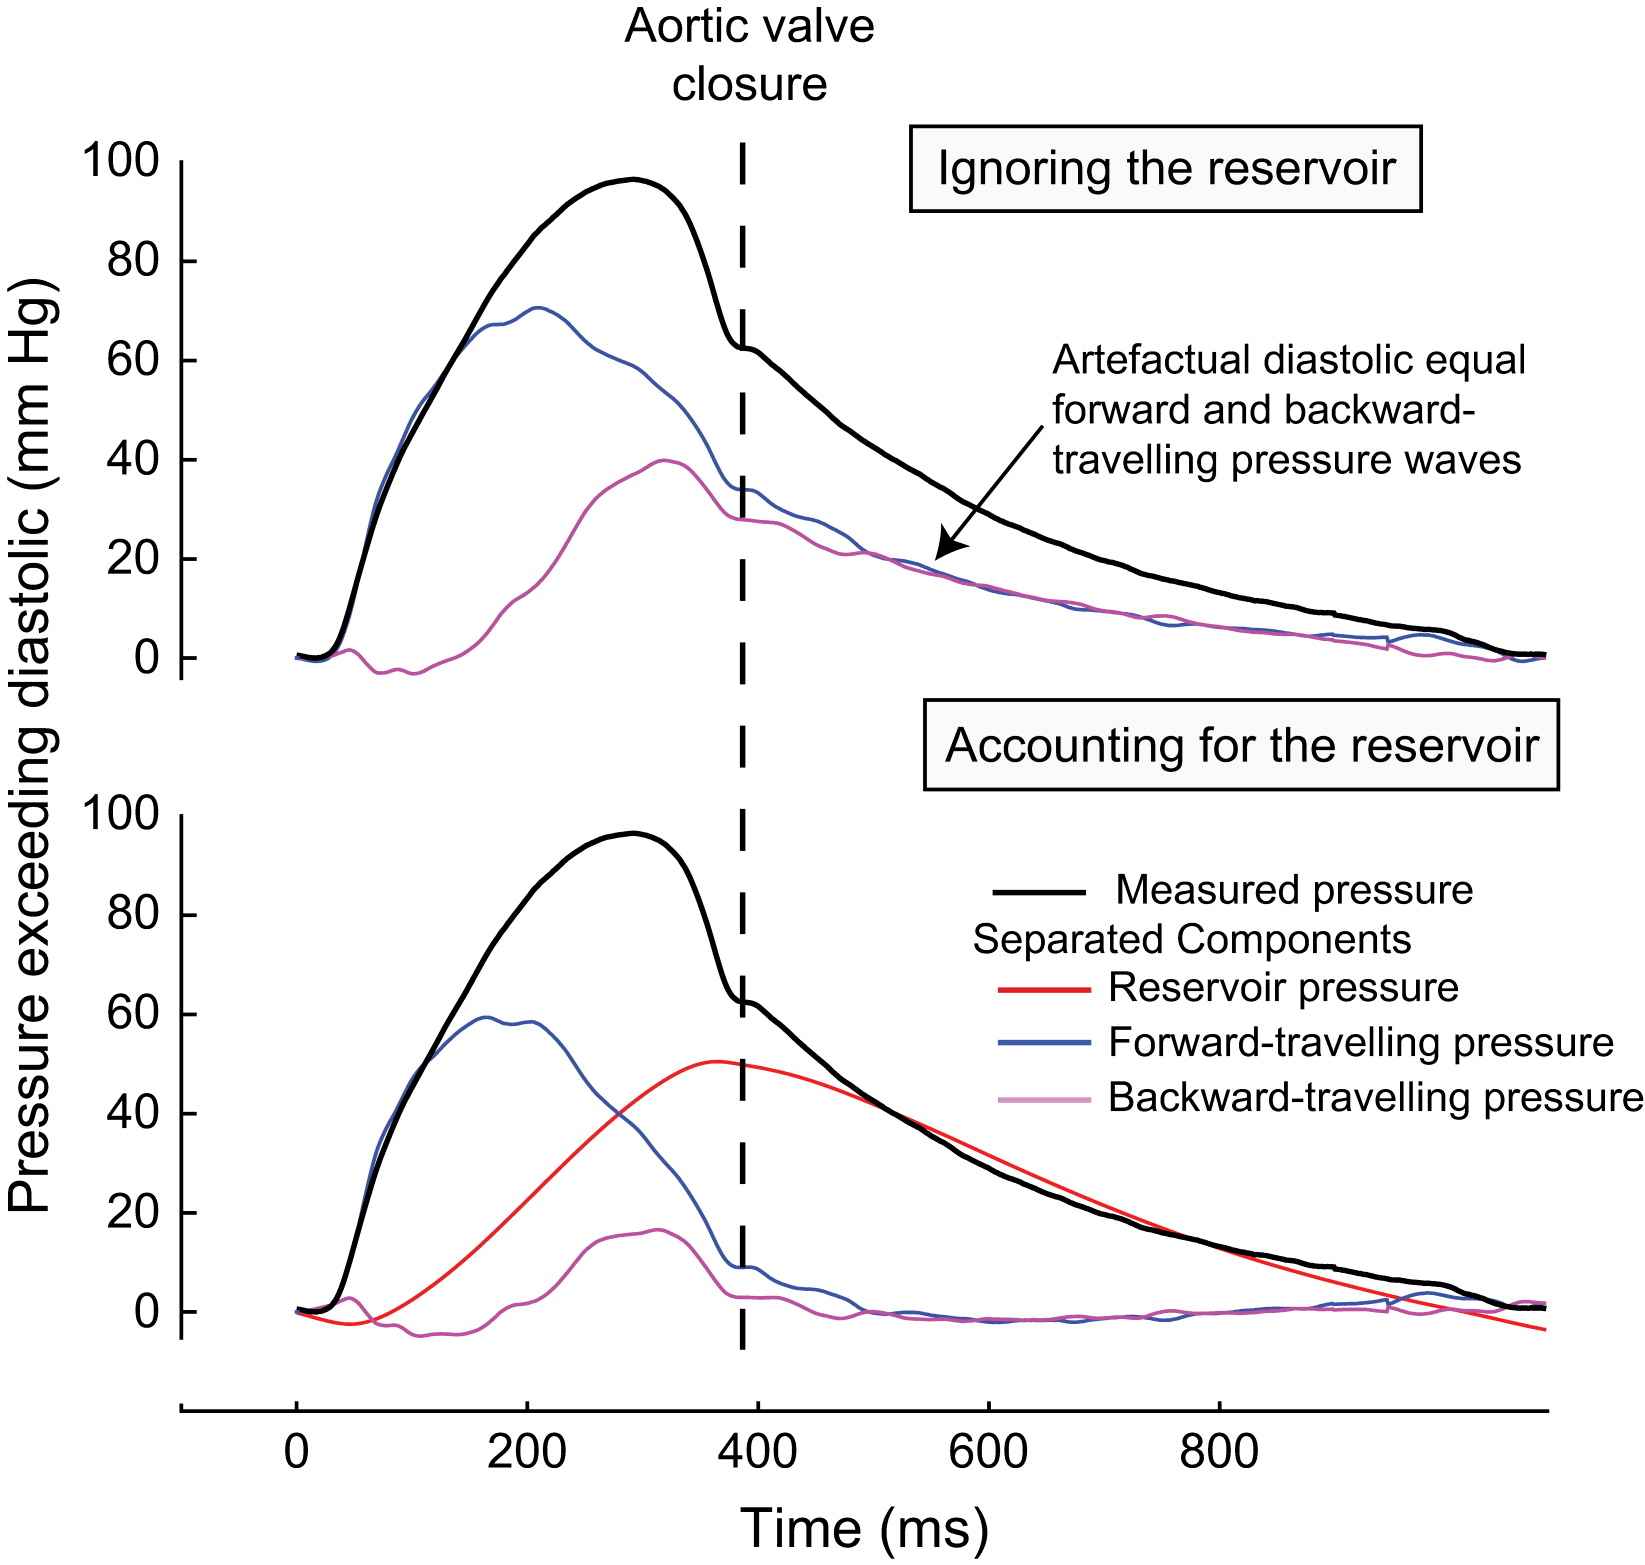
Separation of the pressure waveform into forward- and backward-travelling pressure in the proximal aorta. Pressure and flow velocity were measured using intra-arterial pressure and Doppler velocity sensor-tipped wires (Volcano Therapeutic) 2 cm from the aortic root. The pressure waveform was separated into forward- and backward-travelling pressure using standard techniques.8 The upper panel shows the effect of separation ignoring the aortic reservoir and the lower panel shows the separation after accounting for the aortic reservoir. If the reservoir pressure is ignored (upper panel), the persistent pressure after aortic valve closure in the absence of significant flow must be attributed to two equal components: one a slowly declining forward pressure from the heart, and the other a simultaneous and equal pressure arriving from the distal aorta; these forward- and backward-travelling waves cancel each other out to produce a zero pressure gradient. If the reservoir is accounted for, this biologically implausible phenomenon is no longer evident. Both forward- and backward-travelling waves rapidly fall to zero after closure of the aortic valve. Reservoir pressure is seen to account for almost of all the pressure found in diastole.
This artefact can be easily eradicated if the reservoir or ‘cushioning’ effects of the aorta are incorporated into the analysis (Fig. 1, lower panel)6; corresponding to a space-time one-dimensional model as described by Sherwin et al.7
Our contention that the exponential decay in pressure during diastole is due to the recoil of the aortic reservoir is consistent with the cyclical process of distension and relaxation of the aorta that is clearly apparent during open surgery or during transoesophageal echocardiography. However, until recently there was no mathematical approach that unified the concepts of reservoir pressure (aortic ‘cushioning’ pressure) and the pressure arising from waves.
Wang et al. have recently described6 a mathematical technique that combines the wave-only theory (which explains well the steep systolic upstroke and the shoulder) with the arterial ‘reservoir’ (which elegantly explains the exponential decline in diastole). There are two stages to this mathematical analysis. The aortic reservoir is charged during systole and this change can be calculated from the net rate of change of volume of blood in the aorta (aortic inflow–aortic outflow, Eq. (1)). When aortic inflow exceeds aortic outflow reservoir pressure will increase. During diastole there is no inflow into the system and the outflow is determined by the capacitance (volume compliance) and resistance of the system. After subtraction of the reservoir pressure wave, separation can then be performed using time- or frequency-domain techniques. One methodological limitation of this approach is that it requires measurement of aortic flow to calculate reservoir pressure in systole. More recently we have solved Eq. (1) in terms of pressure alone (Eq. (2)), which enables reservoir pressure to be calculated from any pressure waveform, even when flow is not known.9
Eq. (1) – calculation of the reservoir pressure (Preservoir) using pressure and flow.
Qin is the flow into the aorta, Pd is the diastolic pressure at t = 0, P∞ is the pressure at which flow through the microcirculation falls to zero, C is the compliance of the arteries and RC is the time constant of the diastolic pressure decrease.
Eq. (2) – calculation of the reservoir pressure (Preservoir) using only pressure.
Reservoir pressure is calculated where P∞ is the pressure at which flow through the microcirculation falls to zero, Pd is the measured diastolic pressure at t = 0, b = 1/RC where R = resistance and C = compliance of the system, a is a rate constant that is chosen so that the pressure is continuous at the start of the exponential fall in pressure during diastole.
Why is the cushioning effect of the aorta necessary?
Aortic cushioning has an important role in smoothing the pulsatile pressure and flow of cardiac ejection, to provide nearly steady perfusion at the tissue level. Whilst this effect can be observed in most vascular beds it is perhaps of most significance in the coronary arteries. The coronary arteries are unique in receiving only a quarter of their blood flow during systole, with the remainder in diastole. If there was no aortic ‘cushion’, then aortic pressure would be nearly identical to left ventricular pressure (as in the assumption upon which the wave-only model is founded3,4), and there would be insufficient pressure during diastole to adequately perfuse the coronary microcirculation. The aortic reservoir pressure therefore combines with the ‘suction effect’ arising from the relaxing myocardium (the “intramyocardial muscle pump”) to ensure coronary perfusion.10,11
Cushioning pressure is similar at different arterial sites
The reservoir pressure is determined by the elastic compliance of systemic arteries which is largely due to the proximal 10% of the aorta which is by far the most compliant section of the aorta.12 During systole this vessel is stretched by blood entering the aorta, ‘cushioning’ the rise in pressure. During diastole, following closure of the aortic valve, the elastic reservoir gradually recoils, ‘cushioning’ the pressure from falling immediately to mean circulatory filling pressure.
Whilst the pressure from the elastic recoil is, in the main, determined by a relatively small portion of the aorta (the elastic aorta), its effects are visible throughout the entire arterial system in diastole. This is the reason that the rate of diastolic pressure decay is almost identical in most arteries of the body. A wave-only model cannot account for such similarity between different sites in the arterial tree given the wide variation in local arterial impedance. We propose that the concordant decline in pressure in diastole is due the widespread transmission of the effects of the central elastic reservoir.
We tested this hypothesis in a series of experiments. The first experiment (18 subjects, mean age 54 years) involved making invasive measurements of pressure and flow velocity using intra-arterial sensor-tipped wires at 10 cm intervals along the course of the aorta, starting at the aortic root, using a technique previously described.13 The reservoir and wave pressures were calculated (Eq. (2)) at each measurement site.
In each subject the shape of the measured pressure waveforms changed markedly along the length of the aorta (Fig. 2, left panel). However, within each subject, the calculated reservoir pressure was almost identical at each measurement site (Fig. 2, right panel). When the reservoir pressures are aligned, they are almost completely superimposable. The difference between the measured pressure waveform is due to differences in wave pressure (e.g. reflections) between sites.
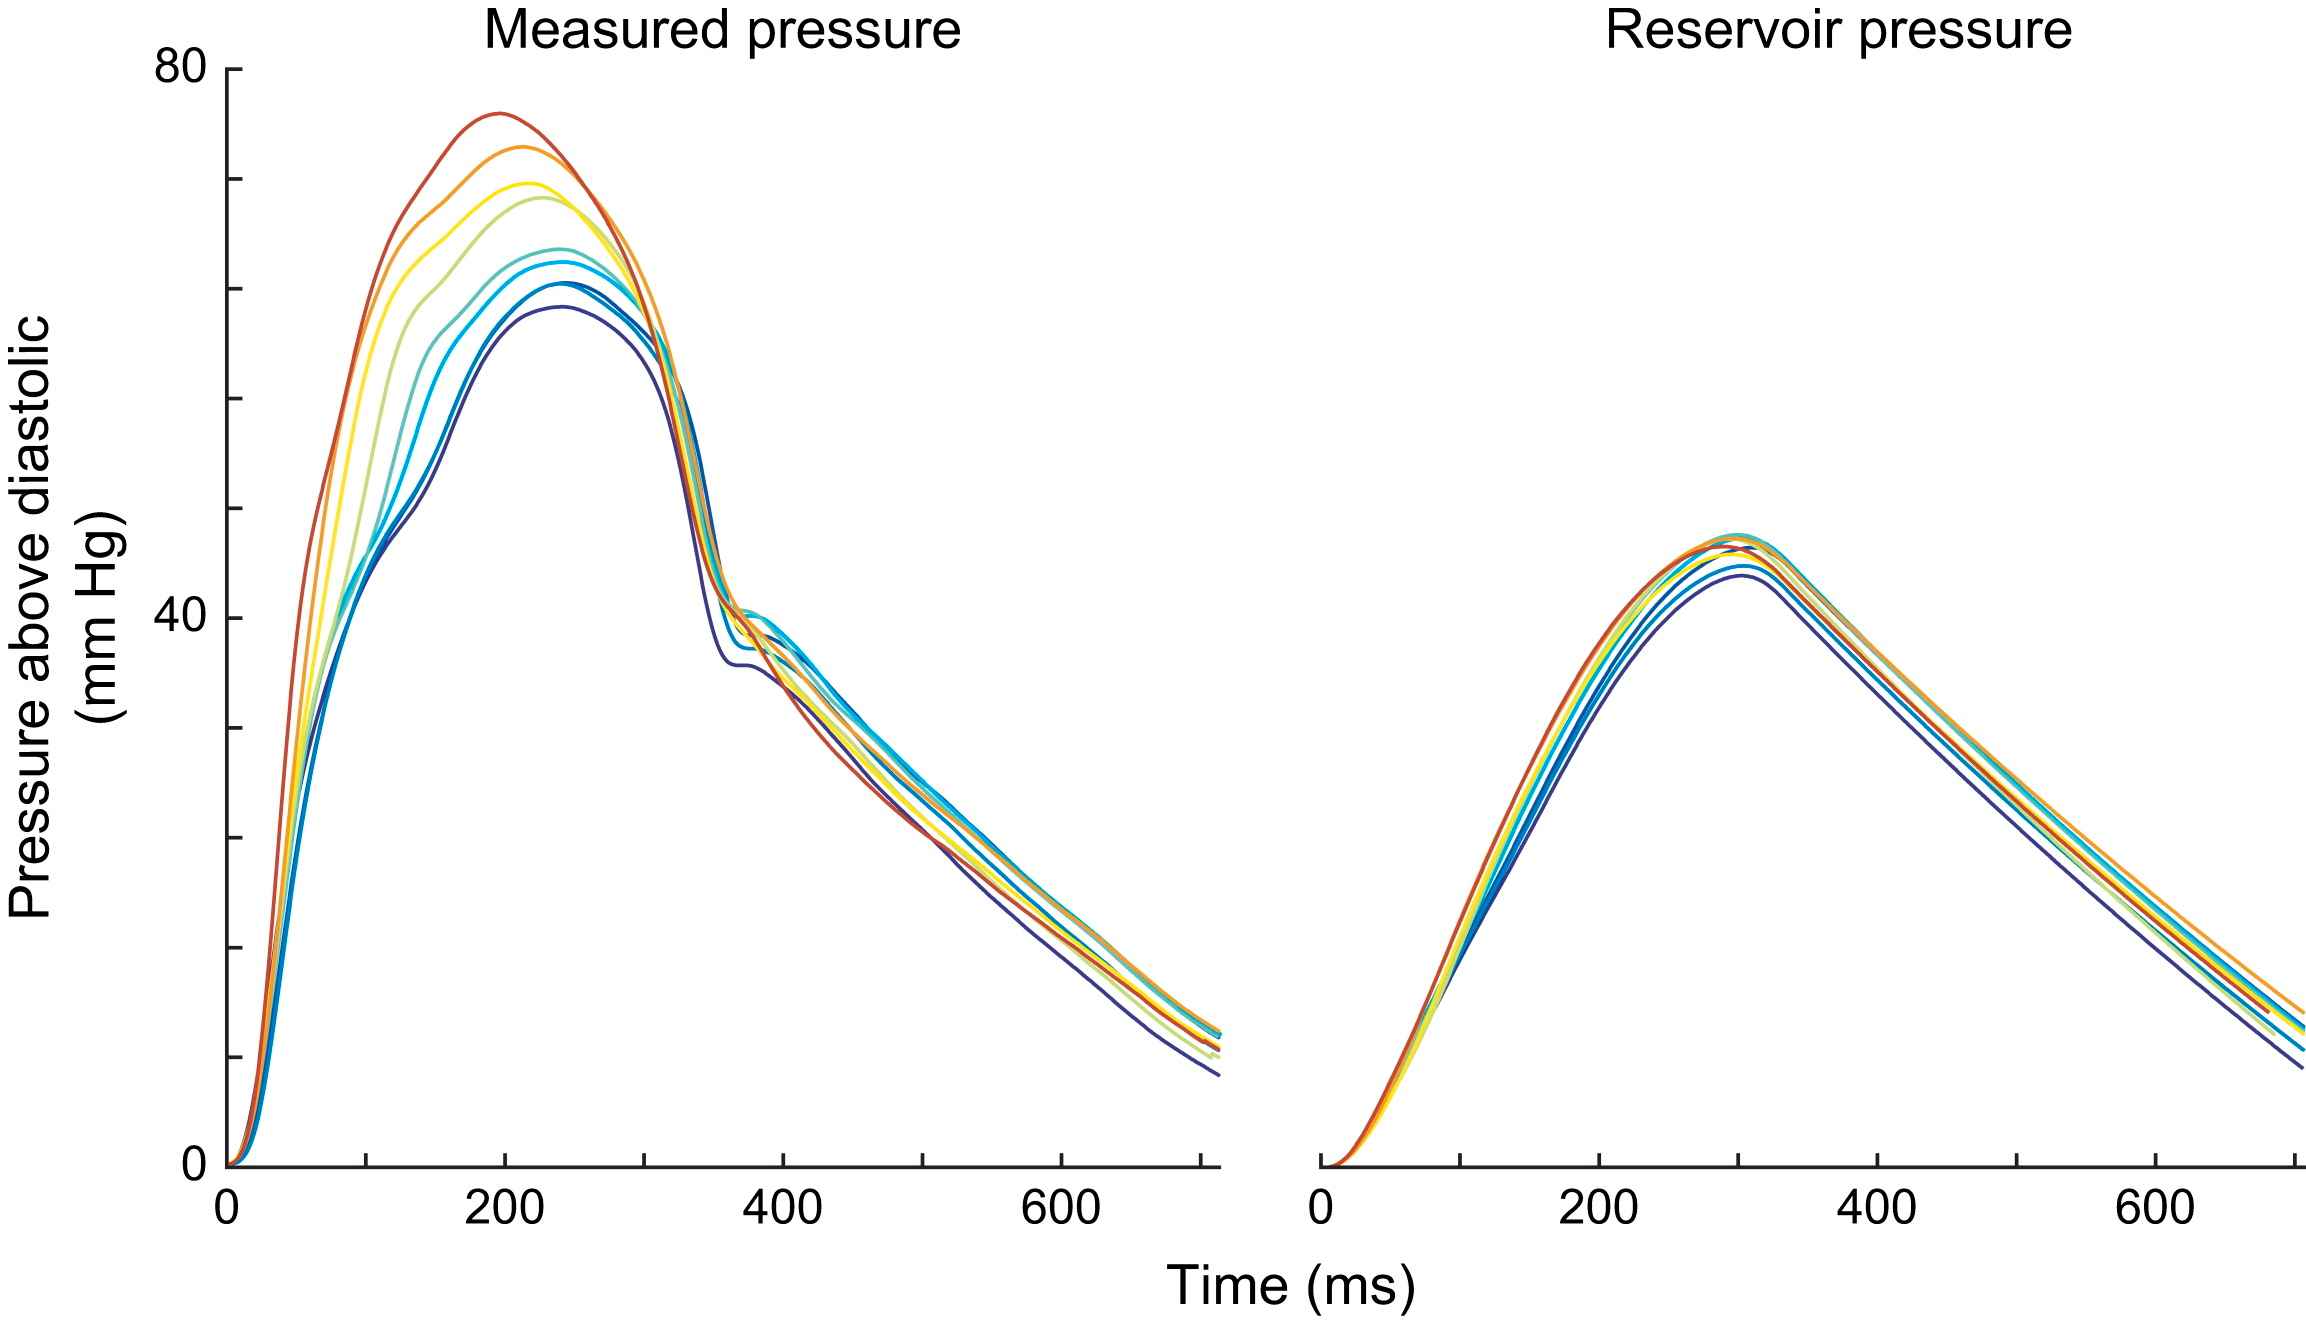
Similarity of the reservoir pressure at different measurement sites in the human aorta. Pressure and flow velocity were measured using intra-arterial wires at 5 cm intervals in the human aorta starting at the aortic root. Pressure was found to vary considerably along the length of the aorta (left panel). However, the aortic reservoir was found to be almost identical at each site within the aorta. This similarity was both in the systolic portion (cushioning of the aortic reservoir) and in the diastolic (recoil of the aortic reservoir). The difference between the measured pressure in systole is due to wave pressure. In both measured and reservoir pressure, the traces have been time aligned to the start of the pressure waveform.
In a second experiment, pressure and flow velocity were measured non-invasively at the carotid and brachial artery in 11 subjects, using applanation tonometry and pulsed Doppler as previously described.14 The reservoir and wave pressures were calculated as described above. The carotid and brachial arteries were chosen as they both have very different local resistance and compliance. Despite there being significant variation in both the estimated resistance and the local compliance at these arterial sites, reservoir pressures were almost identical (Fig. 3). Thus the differences in the measured pressure waveform between locations in a patient is due to differences in wave pressure and not reservoir pressure.
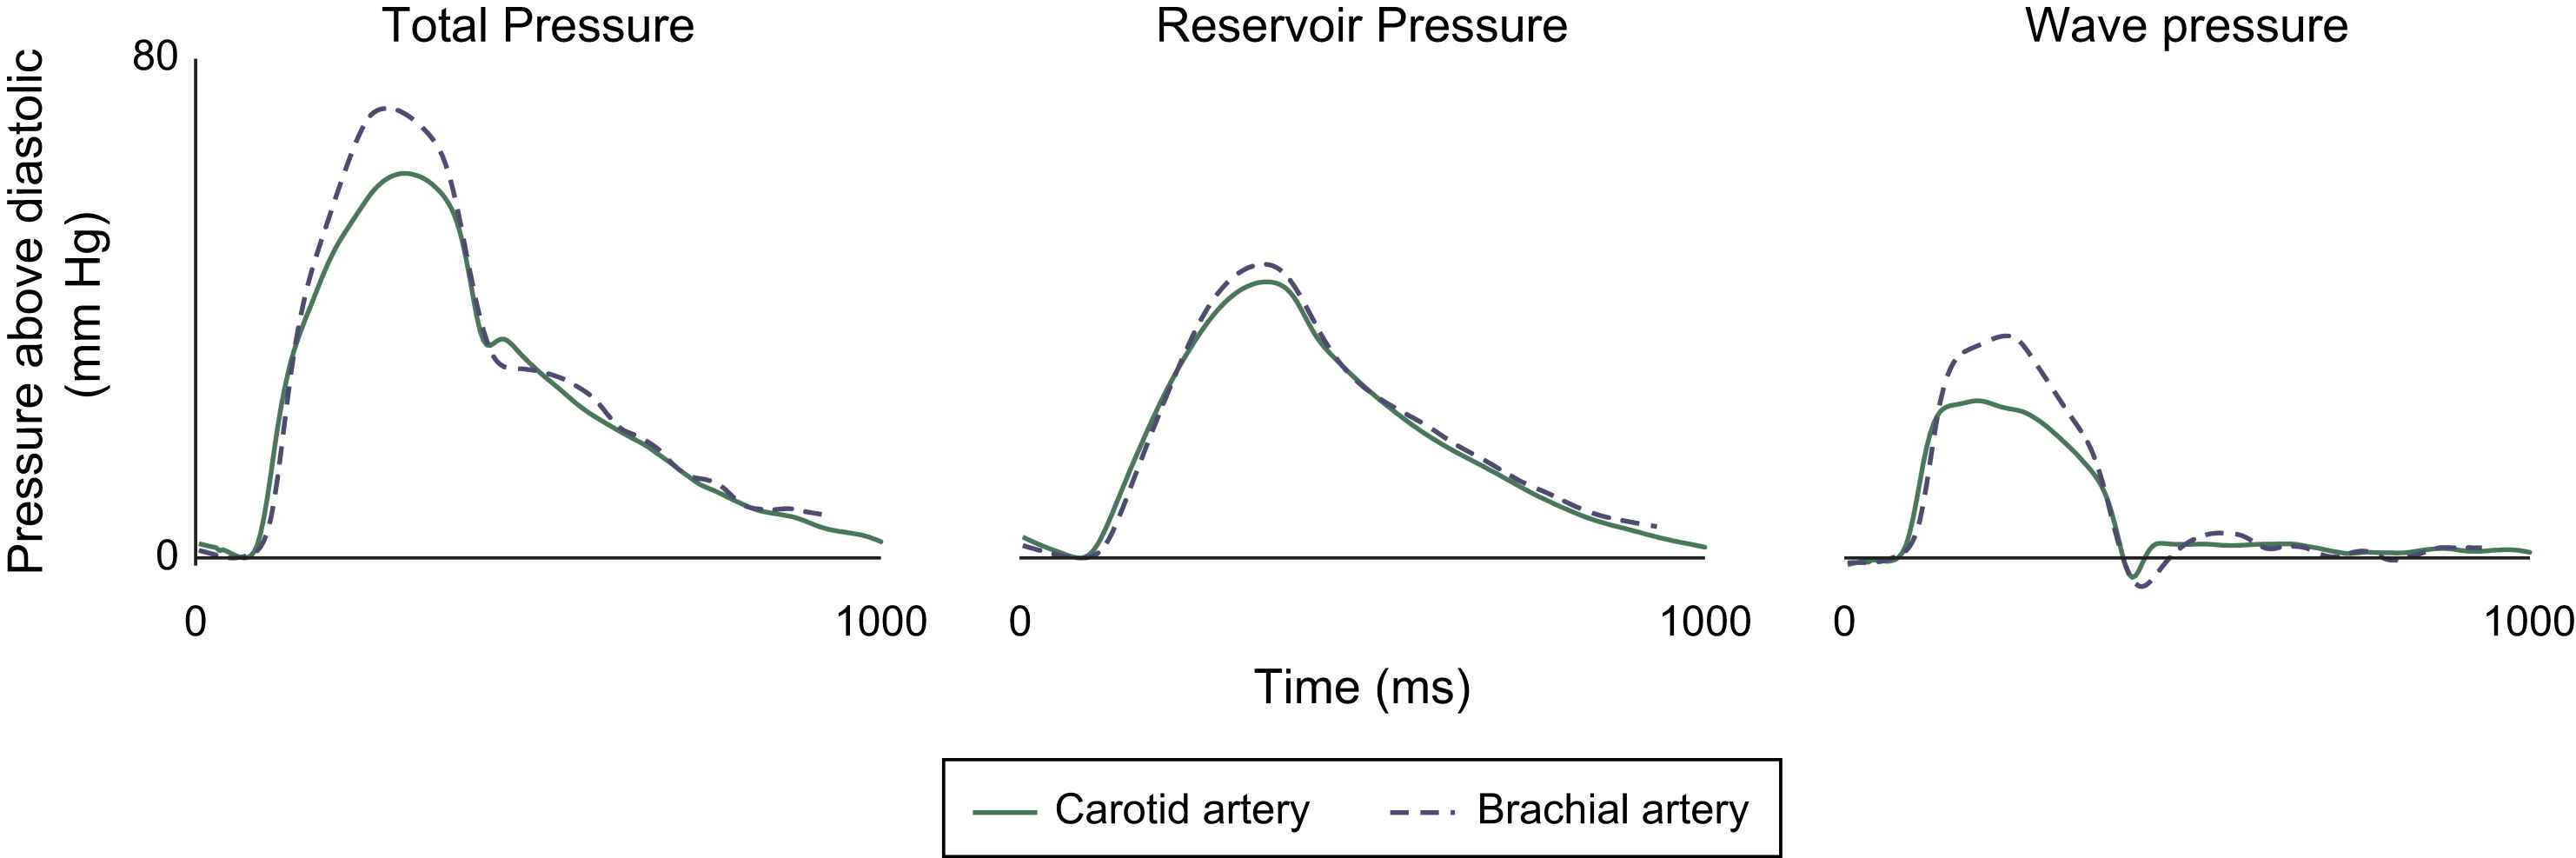
Similarity between reservoir pressure measured in the carotid and brachial arteries. Reservoir pressure was calculated using Eq. (2) and using calibrated tonometry and Doppler velocity in the carotid and brachial arteries. Wave pressure was calculated by subtracting the reservoir pressure from total pressure. Despite the local arterial resistance and compliance being markedly different for each artery the reservoir pressure was almost identical, unlike the wave pressure which differed markedly between the two arteries. This suggests that the reservoir pressure is a property of the central aorta, and is largely independent of differences in local compliance and resistance. Whereas wave pressure is influenced more by more local properties of the arteries. Carotid pressures are shown in a solid line, and brachial pressures in dotted line.
The findings of these experiments suggest that the pressure waveforms in large arteries are composed of two components:
- •
First, a reservoir component, independent of local arterial properties, common throughout all large arteries, which originates from the charge and recoil of the aortic ‘cushioning’.
- •
Second, an overlying travelling wave pressure, consisting of forward- and backward-travelling waves, which varies markedly according to the site and characteristics of arterial location. This wave pressure is entirely responsible for the differential waveforms seen at different arterial sites.
Striking relationship between wave pressure and flow
In our analysis we have shown how the reservoir pressure waveform appears to be common throughout the arteries. We hypothesize that this reservoir pressure makes a large contribution to the overall pressure waveform and is almost completely responsible for the slow fall in pressure during diastole. Subtraction of the reservoir pressure from the total pressure resolves a number of anomalous findings arising from simple analysis of waves. For example, when the reservoir component is subtracted from the aortic pressure waveform measured in man, then the remainder (i.e. wave pressure) is found to correspond extremely closely to the flow velocity waveform (Fig. 4, right panel).9 The two curves are only seen to deviate from one another when flow velocity starts to fall as wave pressure is augmented by reflected waves (shaded grey, Fig. 4, right panel). The close relationship between wave pressure and flow velocity indicates that in this subject the influence of wave reflection, though present, is small and that reservoir pressure contributes extensively to apparent pressure augmentation. This finding is similar to the observations made by Wang et al. in dogs.6
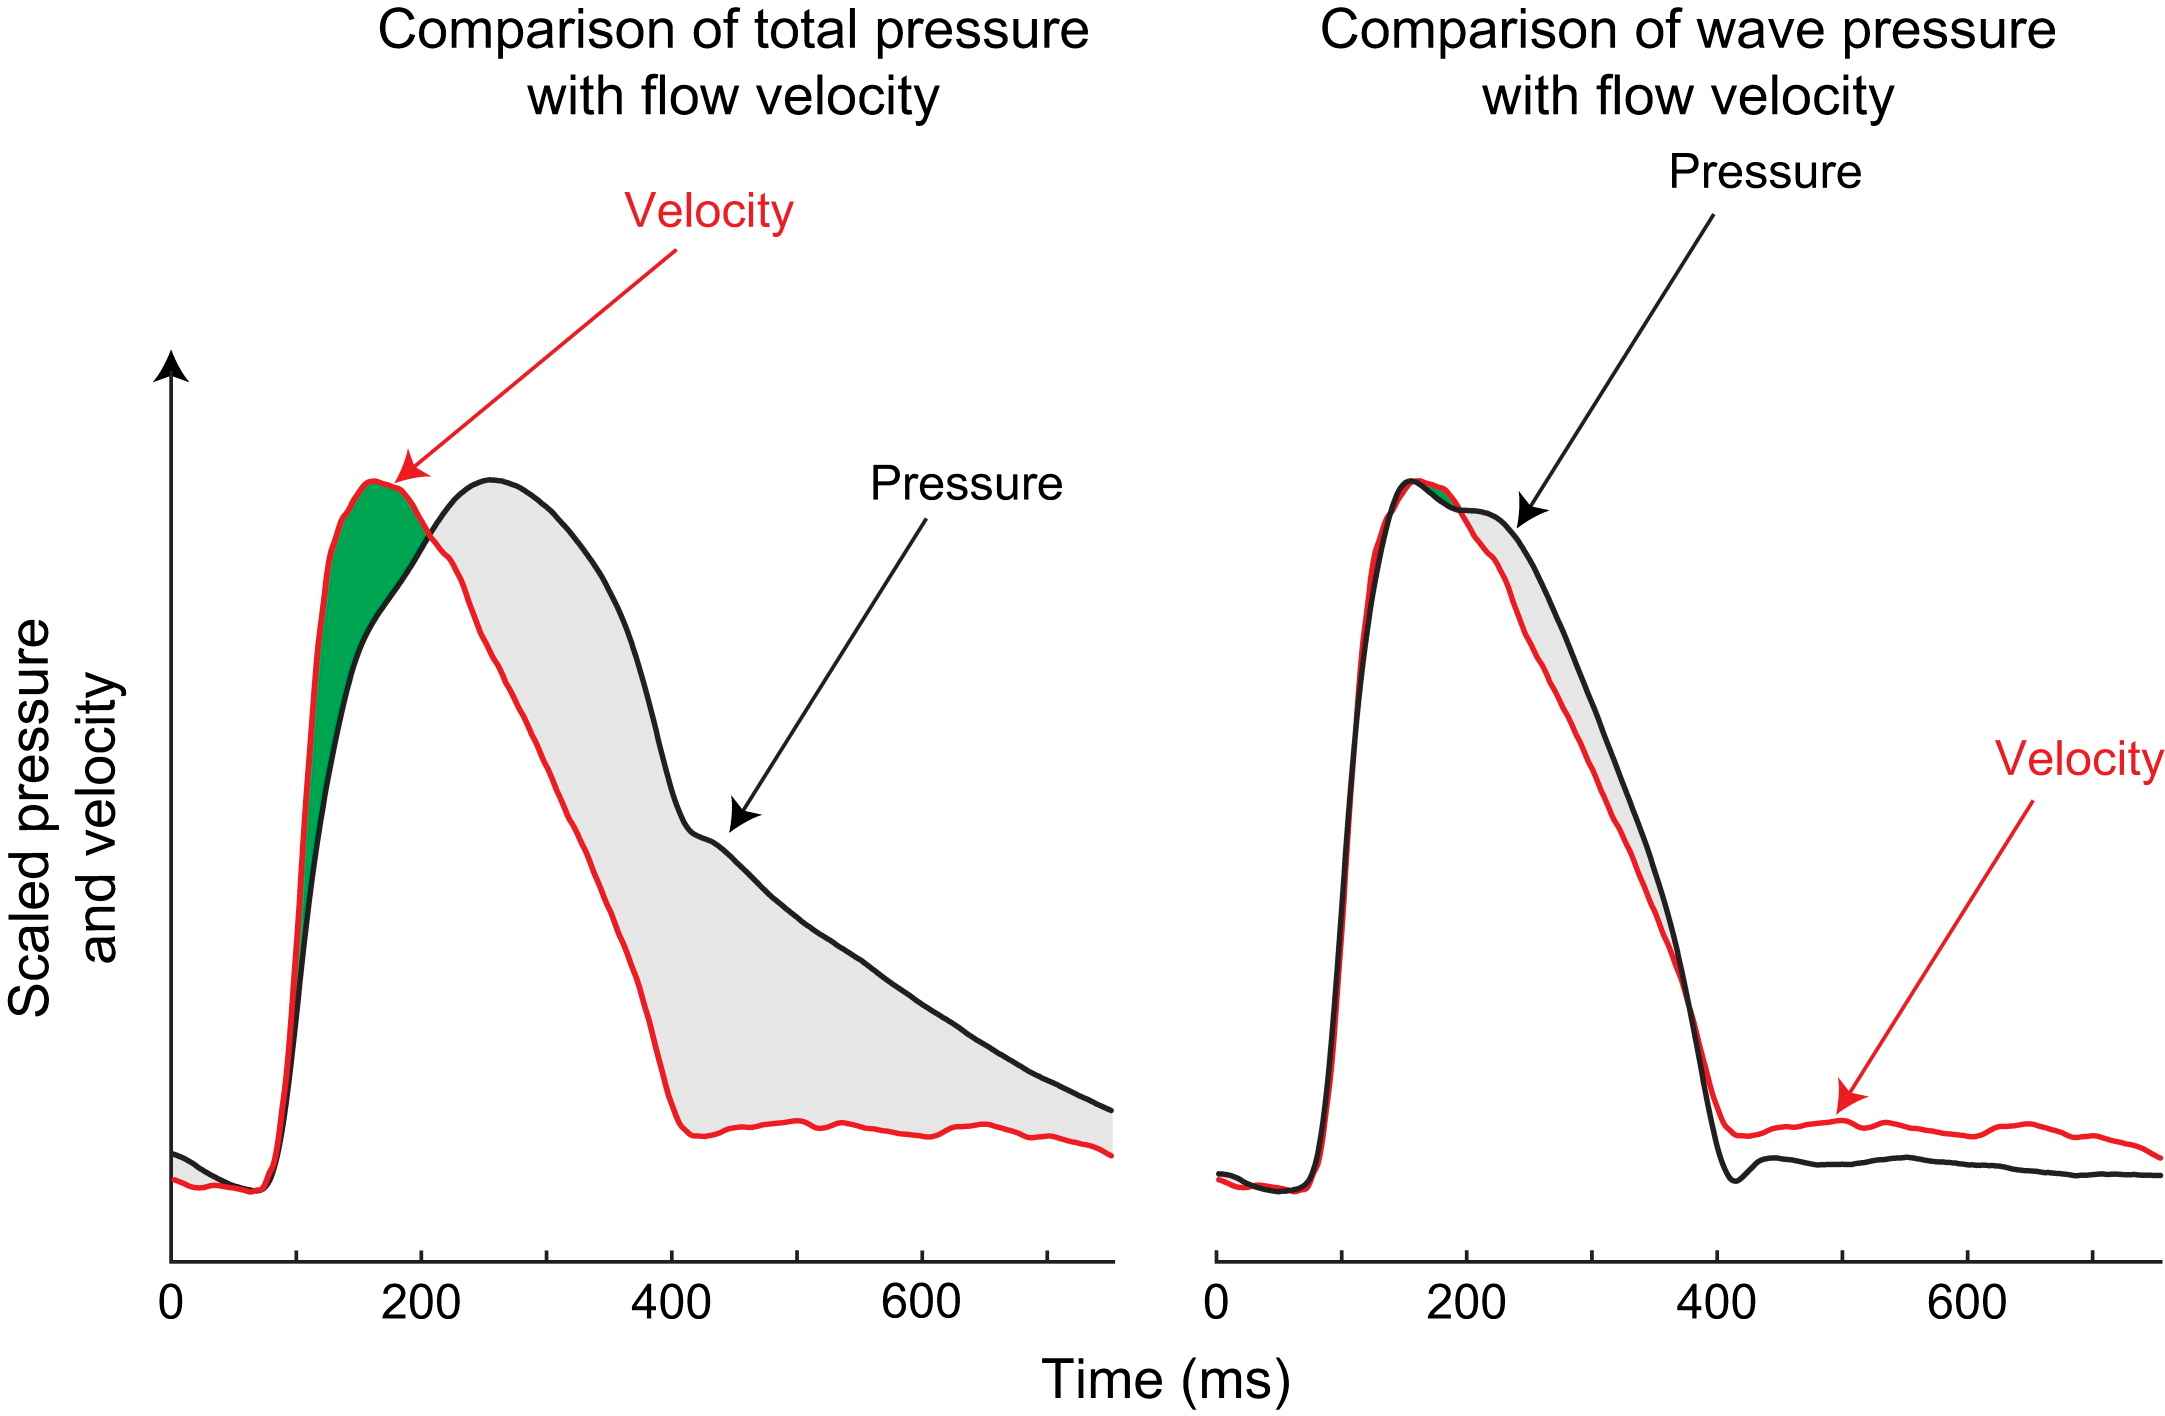
Total pressure and wave pressure plotted against flow velocity in the proximal aorta. Pressure and flow velocity were measured in the proximal aorta of a 50-year-old male subject using intra-arterial sensor-tipped pressure and Doppler flow wires. The left panel shows concurrent flow velocity and total pressure scaled so that their peak values coincided; right panel shows scaled flow velocity and wave pressure after reservoir pressure is subtracted. Total pressure corresponds poorly with flow velocity. However, wave pressure and flow velocity are in close agreement. This suggests only minor wave reflections in the aorta.
Conclusions
The findings of this work suggest that the pressure waveform has two constituents: reservoir pressure generated by the expansion and recoil of the aorta, and a superimposed wave pressure generated by forward- and backward-travelling waves. When the pressure waveform is separated using this reservoir–wave technique it is possible to explain all the features of the pressure waveform in terms of wave and reservoir pressure.
The magnitude and time course of reservoir pressure is almost exactly identical in all the studied large arteries of a subject and is predominately determined by the ‘cushioning’ effects of the elastic portion of the aorta. Measurement of the reservoir pressure may prove to be a good method for assessing the compliance of the central aorta.
Conflict of interest
The authors have no conflict of interest to disclose.
Acknowledgements
This work was funded by a grant from the Coronary Flow Trust. Dr Davies (FS/05/006), Dr Francis (FS/04/079), Dr Whinnett (FS/05/068) and Dr Hadjiloizou (FS/05/034) are British Heart Foundation fellows. Dr Manisty (077049/Z/05/Z) is funded by the Wellcome Trust. The authors have made all of the Matlab algorithms used in this manuscript open source and freely available for non-commercial use. The algorithms can be applied to any measured pressure waveform, and can be used with data recorded using a variety commercial devices).
References
Cite this article
TY  - JOUR
AU  - Justin E. Davies
AU  - Nearchos Hadjiloizou
AU  - Debora Leibovich
AU  - Anura Malaweera
AU  - Jordi Alastruey-Arimon
AU  - Zachary I. Whinnett
AU  - Charlotte H. Manisty
AU  - Darrel P. Francis
AU  - Jazmin Aguado-Sierra
AU  - Rodney A. Foale
AU  - Iqbal S. Malik
AU  - Kim H. Parker
AU  - Jamil Mayet
AU  - Alun D. Hughes
PY  - 2007
DA  - 2007/08/30
TI  - Importance of the aortic reservoir in determining the shape of the arterial pressure waveform – The forgotten lessons of Frank
JO  - Artery Research
SP  - 40
EP  - 45
VL  - 1
IS  - 2
SN  - 1876-4401
UR  - https://doi.org/10.1016/j.artres.2007.08.001
DO  - 10.1016/j.artres.2007.08.001
ID  - Davies2007
ER  -