
Assessment of arterial pressure wave reflection: Methodological considerations
- DOI
- 10.1016/j.artres.2008.05.001How to use a DOI?
- Keywords
- Wave reflection; Augmentation index; Impedance analysis; Wave intensity analysis; Arterial function; Blood pressure
- Abstract
Cardiovascular risk assessment more and more makes use of the diagnostic information hidden in the arterial waves propagating in the cardiovascular system. An important factor determining the morphology of the arterial waves is wave reflection which becomes more significant with increasing age and can be related to an augmented risk for cardiovascular disease. This paper describes three currently existing techniques to analyze wave reflections with their pros and cons to give the reader more insight into this still debated field. The first method is the augmentation index which only requires information on the pressure wave but although commonly used, hasn’t yet revealed any strong prognostic value in the general population, possibly due to the composite character of the index. More advanced and unequivocal methods exist, requiring information on both pressure and flow waves and thus having added value from a patho-physiological point of view: impedance analysis and wave intensity analysis. The former consists of decomposing the waves in the frequency domain, and has the disadvantage that the analysis is only valid in a linear system and requires the complex Fourier analysis. A more intuitive approach executed in the time domain is wave intensity analysis which doesn’t have the previously mentioned restrictions but is highly susceptible to noise. We will further discuss how according to our experience both the time and frequency domain methods can stand along each other and can be used in a complementary way.
- Copyright
- © 2008 Association for Research into Arterial Structure and Physiology. Published by Elsevier B.V. All rights reserved.
- Open Access
- This is an open access article distributed under the CC BY-NC license.
Introduction
It has become common knowledge that arterial pressure wave reflection contributes to the increase in systolic and pulse pressure as seen with ageing and in patients with hypertension.1,2 When the heart ejects, a forward running pressure wave is generated, which reflects in the periphery and returns as a backward running wave towards the heart. Although the precise origin of “the” reflected wave is not directly identifiable, Latham et al.3 and Greenwald et al.4 have suggested that central sites such as the aorta iliac bifurcation and aortic branches near the level of the diaphragm, such as the renal arteries, contribute to the pattern of wave reflection. The pressure as measured at any location in the arterial tree will therefore consist of the superposition of these forward and backward pressure waves,5,6 and it is their magnitude and relative timing that determine both the morphology as well as the amplitude (the pulse pressure) of the measured pressure wave.1,7
When the arteries stiffen due to increasing age or cardiovascular disease, the speed with which the waves propagate in the arteries (the pulse wave velocity) increases, often concomitant with an increase in the magnitude of wave reflection.6,8 A direct consequence is that the more important reflected wave adds to the forward wave in early systole, rather than in late systole or diastole as in young subjects. This causes the morphology of the central pressure waveform to evolve from a so-called C-type in young subjects to an A-type wave in older subjects (characterized by an early systolic shoulder; see Fig. 1). Furthermore, it boosts systolic blood pressure and increases the peak load on the heart.2,7
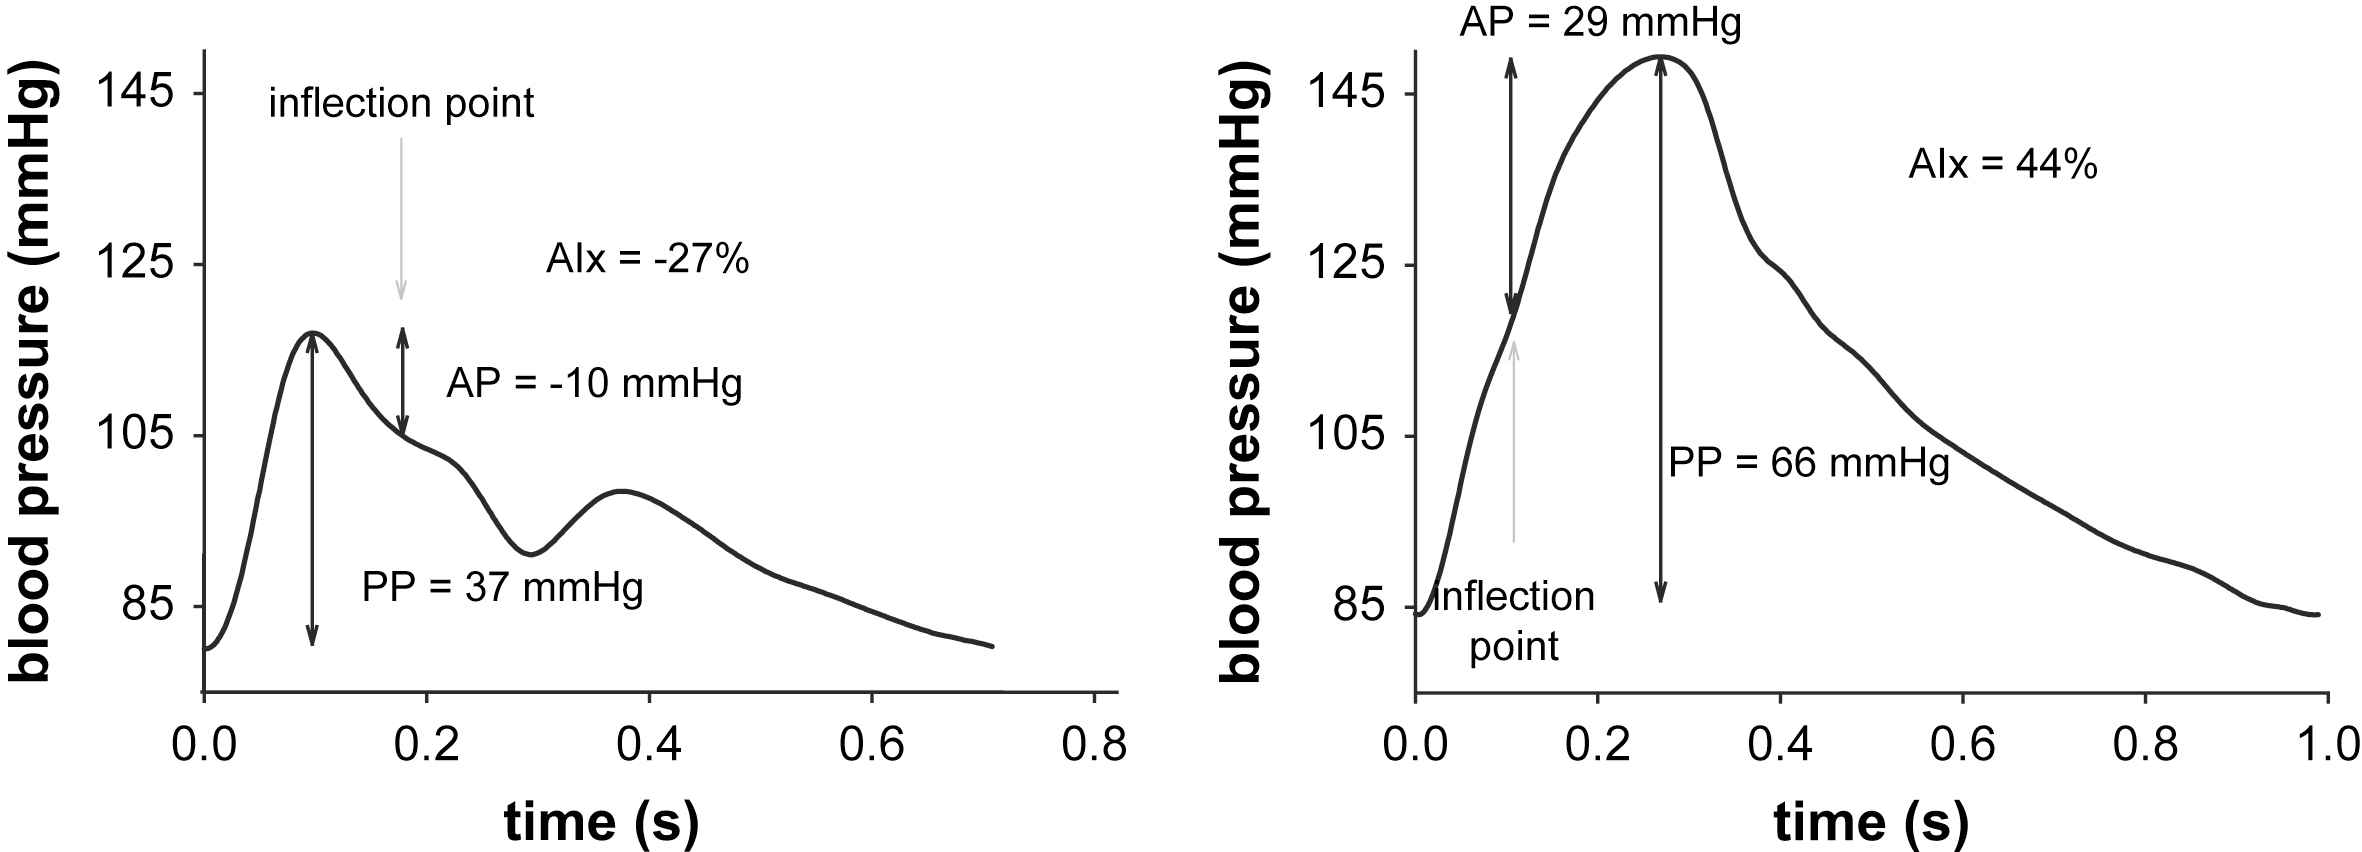
Left: Example of a C-type pressure waveform as encountered in young subjects, with a late inflection point, negative augmented pressure and augmentation index. Right: A-type pressure waveform, with early systolic pressure augmentation and positive augmentation index.
Given this mechanistic principle underlying high blood pressure, quantification of pressure wave reflection should provide a better understanding of the pathophysiology of cardiovascular disease and, potentially, a better assessment of cardiovascular risk in these patients. In present clinical literature, wave reflection is often addressed in terms of the augmentation index (AIx), which expresses the ratio of the “augmented pressure” – attributed to the reflected wave – to the pulse pressure.9,10 AIx is basically a quantification of Murgo’s wave classification scheme.7 The attractiveness of AIx is the fact that its assessment requires measurement of the pressure wave morphology only. The major drawback of AIx is that it is a composite measure depending on the magnitude of wave reflection, but also on the timing of wave reflection and hence to all physical and physiological parameters affecting this timing, such as the subjects’ height, heart rate, aortic stiffness.
To truly assess the magnitude of wave reflection, one actually needs to measure both the pressure and the flow wave, preferably simultaneously and at the same location. Subsequent processing of these signals then allows decomposing the measured pressure waveform into the forward (Pf) and the backward (Pb) component, as first demonstrated by Westerhof et al.11 Wave separation analysis is considered as a gold standard method to assess wave reflection.5,6,12 As common in those days, Westerhof et al. applied their analysis in the so-called frequency domain, making it a fairly complicated method, necessitating the use of advanced mathematical software. In the past few years, an alternative method of analysing wave reflection, based on a time domain (and hence more intuitive and accessible) approach, has emerged. The concept of wave intensity analysis, introduced by Parker and Jones,13 has gained interest in the cardiovascular research domain.14,15
The aim of the present study is to provide an overview of the aforementioned methods of quantifying wave reflection, with their strengths and weaknesses. With the increasing use of the augmentation index and the advent of the time domain method, the “classical” frequency domain method is more and more under oppression. The emphasis of this contribution is therefore on the classic frequency-domain approach, of which we wish to demonstrate its attractiveness and complementarity to the augmentation index and the wave intensity analysis.
Acquiring the basic (pressure and flow) signals
All of the methods described in this work can, of course, be applied to data measured invasively using pressure catheters and flow catheters. In clinical practice, however, the opportunities where high-fidelity invasive data are available are scarce. Also, measurement of wave reflection is thought to provide measures that may help identifying subjects at increased risk of cardiovascular disease. As such, the focus is here on non-invasive techniques, applicable in a pre-clinical setting.
Standardization of the measuring conditions16,17 and accurate recording of the data are critical when assessing wave reflection, irrespective of the method used to quantify the wave reflection. Basically, the general rule “garbage in, garbage out” is highly applicable to wave reflection assessment. The patient should be at rest (allow 10–15 min rest before the recordings) and measurements are preferably taken in a quiet, acclimatized room.16,17 A stable heart rate and blood pressure are vital for arterial function measurements, as the waveform is highly sensitive to changes in these parameters. Using applanation tonometry (especially the hand-held systems), remains difficult and operators should have had enough training before using the technique in clinical practice or for research purposes. The guidelines provided by the manufacturer should be followed to optimize the quality of the signals. The radial artery is a relatively good location to acquire high quality signals, thanks to the presence of the radial bone that stabilizes the artery and allows applanation. The major drawback is its peripheral location, while central waveforms are required to analyze wave reflection. This can be resolved by using a transfer function, which still has the limitation of its generalized nature. We therefore advocate the use of applanation tonometry at a site closer to heart, such as the carotid or subclavian artery, despite the fact that it is somewhat more challenging to acquire high quality signals.
For the methods based on pressure and flow, a stable hemodynamic condition is twice as important when data are obtained in a successive order. It is pointless to combine a pressure tracing measured at a heart rate of 70 beats/min with a flow wave at 90 beats/min. In our Asklepios study, we allowed for a maximal difference in heart rate of 5 beats/min between the pressure and flow signals. Flow velocities are best acquired using cardiac ultrasound in the left ventricular outflow tract (LVOT) using pulsed wave Doppler in the apical 5-chamber view, while the internal diameter of the LVOT can be measured in the parasternal long-axis view at the valve annulus.
We refer to the methodological description of the Asklepios study where we elaborate on our protocol and describe in depth the details of how arterial pressure and aortic flow were non-invasively acquired.18 Furthermore, standard hemodynamic textbooks should be consulted to get familiar with the morphology and general characteristics of the waveforms at the different vascular territories.5,6 Some examples of typical pressure and flow waveforms are also displayed in the figures accompanying this text.
Wave reflection quantification from the pressure waveform: AIx
The augmentation index, AIx, is commonly defined as the ratio of the augmented pressure (AP), attributed to wave reflection, and the amplitude of the pulse (the pulse pressure; PP), often expressed as a percentage:
In early literature, the inflection point was visually identified on the waveform,7 as we did for the examples given in Fig. 1. Visual identification is however susceptible to subjective interpretation, which is why automated procedures have been developed, the most well known described by Takazawa et al. based on 4th order derivatives.19 The exact procedures embedded in commercial systems as the Sphygmocor (Atcor, Sydney, Australia) are not disclosed, but it is likely that they are equally based on higher order derivatives.
We recently studied different automated algorithms and compared the estimated time of arrival of the reflected wave with the outcome of wave separation analysis.20 We found substantial differences between the different methods, and none corresponded with what we considered as the reference value of arrival of the reflected wave. In that same study we also explained a recent finding of Mitchell et al. who claimed that reflection sites shift away from the heart with age because of better matching of central and peripheral impedance due to progressive stiffening of the central aorta.21 We demonstrated that this is probably due to the poor definition of the timing of wave reflection using visual landmarks on the waveform.22 In the same work, we also had a closer look to the systematic finding that AIx is higher in women than in men, even after adjusting for physiological parameters such as height and heart rate. We speculated that this is also attributable to the poor definition of the time of arrival of the reflected wave,20 although more research is needed to further unravel this finding.
The drawback of AIx is that it is a composite measure which is sensitive to the magnitude of wave reflection, but also by many other factors affecting the timing of the reflected wave, such as the height of the subject, the heart rate (duration of systole), and the stiffness of the vessels.23 It has been suggested that, in order to eliminate the heart rate effect, one could calculate AIx at a given heart rate, e.g. at 75 beats/min (also termed AIx@75). A linear regression equation has been derived within a population of 22 subjects with an implanted pacemaker, where it was shown that AIx (calculated from the Sphygmocor device) decreases by 3.9% for an increase in HR by 10 beats/min.24 An AIx of 32% for a heart rate of 62 bpm would translate into an AIx@75 of 32–3.9 · (75–62)/10 = 26.9%. It is, however, always risky to apply a regression equation from one particular study to data measured in subjects which might be quite different from that population, with a different operator, potentially different equipment, etc. It is therefore probably safer to account for confounding factors by statistical means, i.e., by incorporating them into the statistical models as covariates.
At the same time, however, these confounding factors could also be seen as advantageous, because the net result of the reflected wave is largely determined by these timing factors and AIx quantifies the net result of wave reflection. The major problem with AIx was probably reported by McEneiry et al., who demonstrated that AIx tends to reach a plateau value of 50% around the age of 60, after which it does not further increase.25 As the amplitude of the reflected wave can never become more important than the amplitude of the forward wave, there is some logic in the levelling-off of AIx, but it is a bad feature of an index intended for clinical purposes that it loses its sensitivity beyond a certain age. Use of augmented pressure instead of augmentation index might resolve this problem. Finally, it can be mentioned that AIx can be derived from pressure curves measured at any location in the arterial tree. In recent years, people have shown the feasibility of assessing AIx from radial pressure tracings. Moreover, acceptable correlations have been shown between AIx measured at the radial and at the carotid artery. AIx measured on the radial artery and on synthesized central aortic pressure waveforms also show good comparison.26,27 These results are, to some extent, trivial since the aortic pressure waveforms were calculated from the radial pressure waves by means of a generalized transfer function (as with the Sphygmocor system). As such, correlations reach extremely high values (r = 0.94–0.96) and, as also stressed by Millasseau et al., it can be doubted whether using a transfer function to calculate central pressure waveforms has any added value at all (with respect to assessment of AIx).26 Perhaps even more important is that changes in AIx induced by nitroglycerine and norepinephrine, also induced parallel changes in radial and central AIx.26
| Pros |
|
| Cons |
|
Summary:
Wave reflection from pressure and flow – frequency domain method
Why wave reflection is often analysed in the “frequency domain”
The wave generated by the “regularly beating” heart is periodic and pulsatile but it is not a sinusoidal wave. Yet, in reference works,5,6 hemodynamics are often analysed in terms of so-called “harmonics”, i.e., pure sinusoidal waves (with a given frequency f, period T (T = 1/f) and wavelength l = PWV.T, with PWV the pulse wave velocity). Thanks to the Fourier theorem, it is indeed possible to decompose a periodic signal into a series of sine waves with frequencies that are multiples of the heart frequency and when summed up make the original signal (Fig. 2). These sine waves are called the harmonics, and 10–15 harmonics are generally sufficient to adequately reconstruct the waveforms in cardiovascular applications.

A (pressure) waveform can be regarded as a series of simultaneously present sine waves (harmonics), each with its own amplitude and phase, period, frequency and wavelength, but all travelling at the same speed (pulse wave velocity).
Instead of studying the waveform as measured, each individual harmonic is studied separately as if only sinusoidal waves of that specific frequency were present, hence the terminology of a frequency domain approach. Note that the “zeroth” harmonic (also called steady or DC component), which is the mean value of the original signal (e.g. mean arterial pressure), is a special case. Wave reflection only pertains to dynamic signals, and the reflection analysis should not be applied to this component. Although it is fairly straightforward to obtain the harmonics from a pressure or a flow wave signal, one does require dedicated software, such as Matlab (The Mathworks, Natick, MA).
The reflection coefficient and reflection magnitude
The procedure to calculate the reflection coefficient, Γ, is outlined in Fig. 3 and starts with measurement of the pressure and flow waveform. Ideally, pressure and flow are measured simultaneously at the exact same location (immediately distal to the aortic valve). This is rarely the case, and can virtually only be achieved in invasive studies. In our Asklepios study, we used carotid pressure as a substitute for aortic pressure, and combined it with aortic flow. Before starting the calculations, it is important that both signals are well aligned in time. One can use visual characteristics on the pressure and flow waveform to do this (e.g., the onset of flow will coincide with the steep rise in blood pressure in early systole; the dicrotic notch will coincide with the cessation of flow).
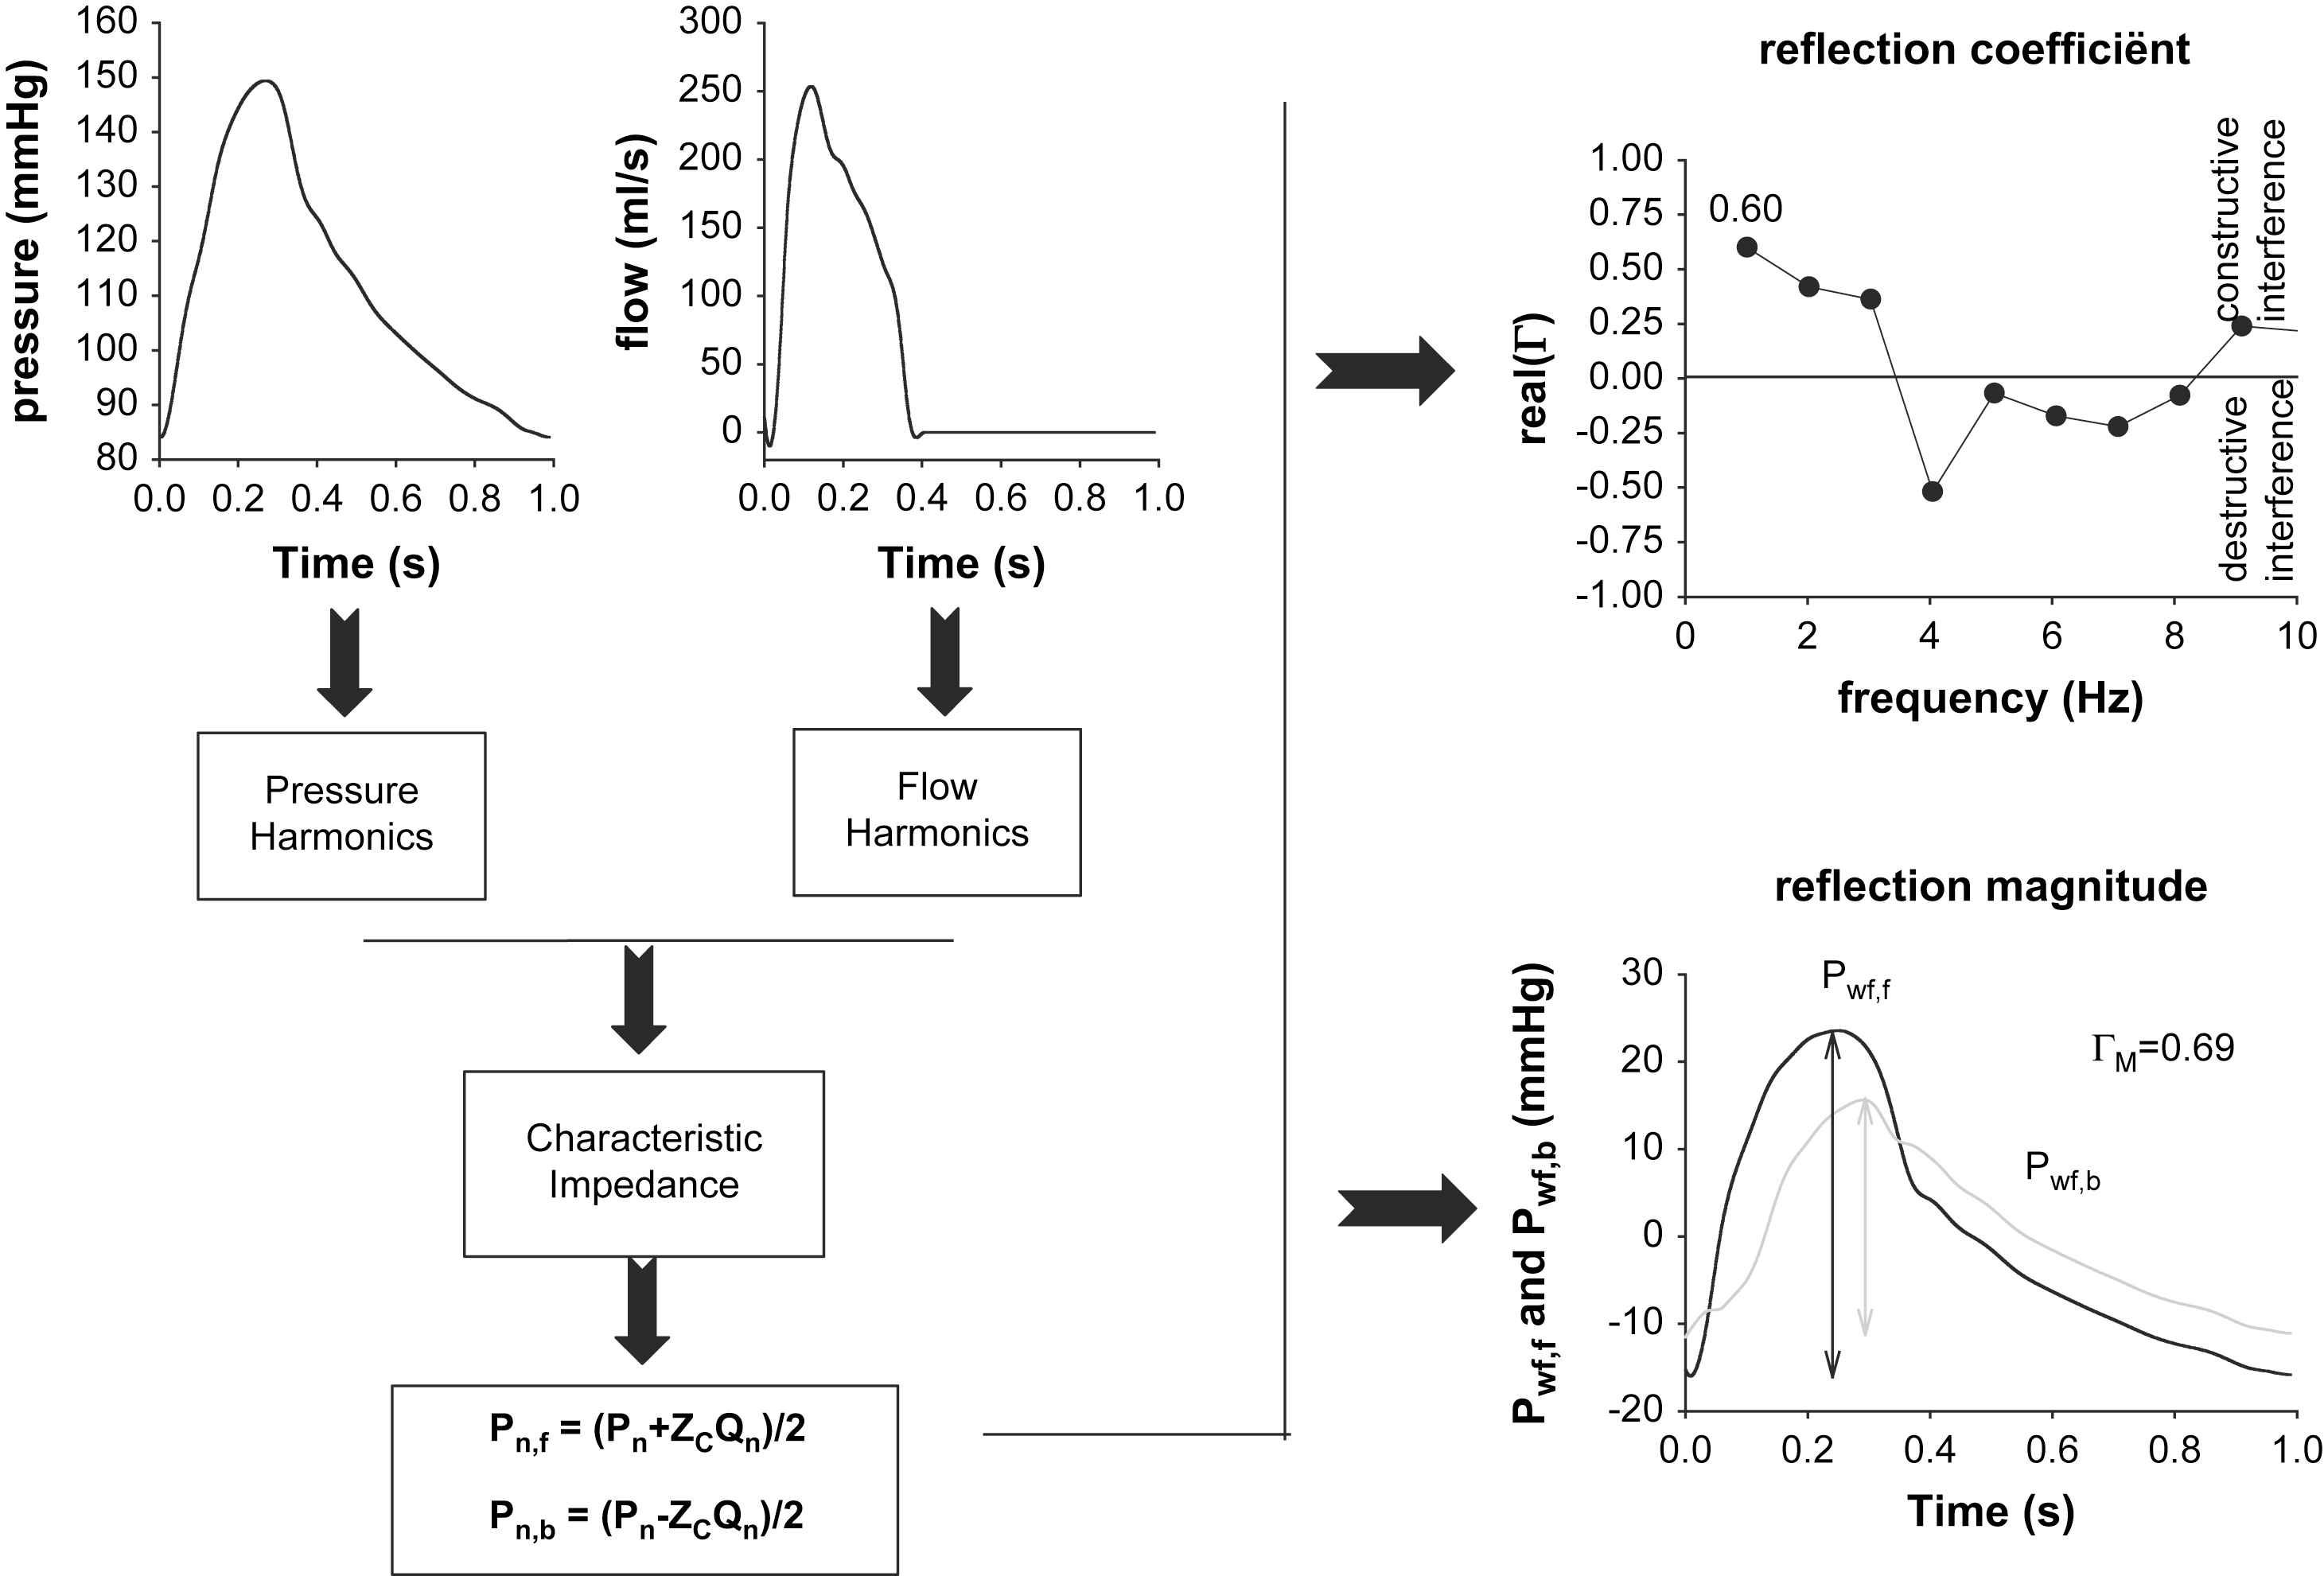
Schematic representation of the frequency domain method. The measured pressure and flow wave are decomposed into a series of harmonics, from which characteristic impedance (ZC) is estimated. Using Westerhof’s formulas, for each harmonic, the forward and backward component is calculated. The final result of the analysis can then be a display of the (real part of) the reflection coefficient as a function of frequency. Alternatively, one can make a summation of all forward and backward harmonics to obtain the forward and backward pressure wave. The ratio of their amplitudes yields the reflection magnitude.
After alignment, both are decomposed into a series of pressure (Pn) and flow (Qn) harmonics, with n denoting the harmonic number (ignoring the 0th harmonic, n typically taking values from one to 10). Because of the presence of wave reflection, each of these harmonics will, in itself, be composed of a forward running sine wave (Pn,f for the pressure harmonic), and a backward running, reflected sine wave (Pn,b). It has then been shown by Westerhof et al.11 that for each harmonic n, these forward and backward components can be found by applying the following formulas:
Now that one has the forward and backward running components for each harmonic, it is straightforward to define – for each harmonic – the reflection coefficient Γn as Pn,b/Pn,f.
As Γn is the ratio of two sine waves, it is a complex number with an amplitude and phase angle. An elegant way to immediately grasp the nature of the reflection at a given location and a given frequency is to express the real part of Γn. Since reflections can increase the total pressure due to constructive interference of the waves, or decrease it because of destructive interference, the net-effect of the reflections is important. When positive, wave reflection is constructive; when negative, destructive interference occurs for that frequency at that location. We have calculated the real part of Γ for the pressure and flow waves shown in Fig. 3. It can be seen that up to the 3rd harmonic, reflection coefficient is positive, while it switches to negative values for the fourth harmonic. For that frequency, the “effective length” of the arterial tree (the distance from the aortic valve to the global reflection site) is close to one quarter of the wavelength. A pressure sine wave of that frequency traveling down the aorta creates a reflected wave, reaching the entrance of the aorta 180° out of phase with the incident wave. As such, destructive interference will occur between the incident and reflected wave, yielding the negative reflection coefficient. As the first harmonics make up most of the amplitude of the pressure waves, it is common to report the real part of Γ at the fundamental (heart) frequency only, which is about 0.6 in this example. As characteristic impedance generally increases along the arterial tree, wave reflections are generally of the closed type, and the value of the reflection coefficient for the first harmonic is generally positive. Negative values might occur in case of abdominal aortic aneurysms, as we will also further address.
Obviously, once one has calculated all forward and backward harmonics, one can add them to construct one global forward (Pwf,f) and backward (Pwf,b) waveform. It is then straightforward to quantify the magnitude of wave reflection as the ratio of the amplitude of Pwf,b and Pwf,f:12
| Pros |
|
| Cons |
|
Summary:
Wave intensity analysis: a newer and better time domain approach?
The Fourier analysis we previously discussed has some important limitations. Strictly speaking it is only applicable in linear systems with periodic signal changes and the analysis is quite complex due to the necessity of Fourier decomposition. A newer approach to analyzing wave reflections is wave intensity analysis which is more intuitively comprehensible due to its execution in the time domain. As for the more ‘classic’ impedance analysis, this technique also requires that pressure and flow are measured at the exact same location and preferably at the same time.
Fourier analysis implied that a wave is considered to be composed of sinusoidal wave trains. On the other hand, in the context of wave intensity analysis, an arterial waveform is considered as consisting of the summation of sequential infinitesimal wavefronts.28 These wavefronts can be interpreted as follows. A disturbance to the flow causes temporal changes in pressure dP and flow velocity dU over one sampling interval. These elemental wavefronts dP and dU propagate with a wave velocity c and can be located in time and space, unlike the sinusoidal waveforms which only have a phase and frequency. They represent elemental units of energy transmitted within and between the blood vessels and the heart. Similar to the splitting of the sinusoidal harmonics in a forward and backward component, one can also separate the infinitesimal wavefronts dP and dU in a forward (subscript +) and backward (subscript −) propagating component:
Using the same pressure and flow profile as in the Fourier analysis examples, we calculated a reflection magnitude of 0.65, which compares well to the 0.69 obtained in the Fourier analysis.
After calculation of the infinitesimal wavefronts dP and dU, the wave intensity (dI) can be computed and this is an easy way to analyze and represent the nature of waves (cf. Fig. 4):
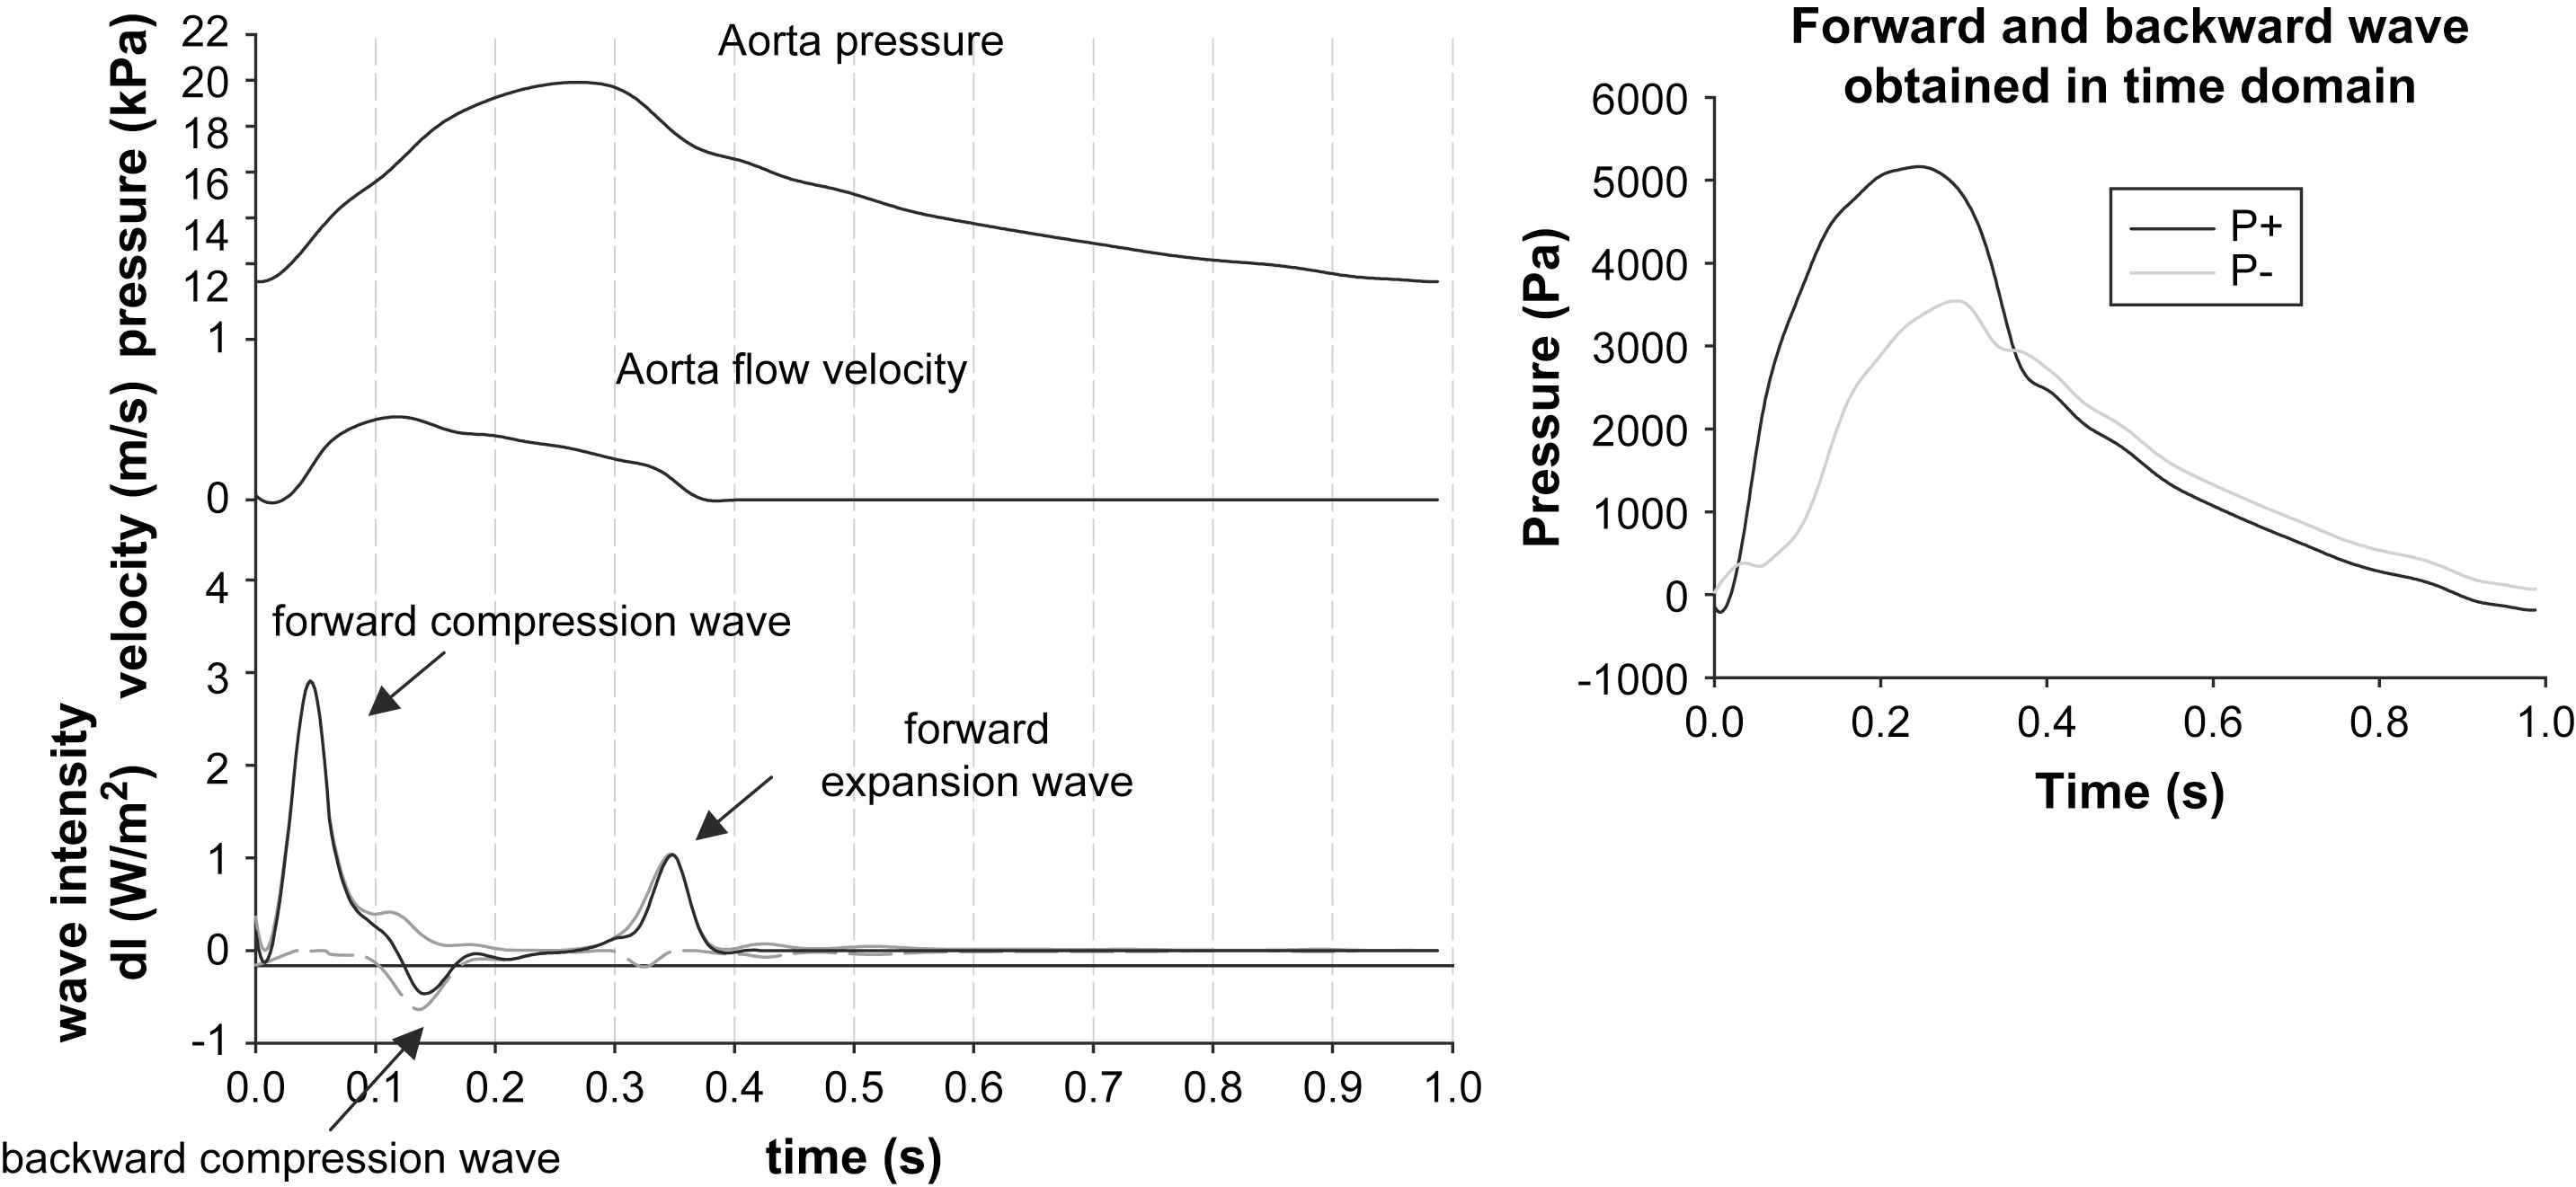
Left: Illustration of the principle of wave intensity analysis, with the three wave intensity peaks, typical for the ascending aorta. Right: We used the time domain analysis to assess the forward and backward component and the reflection magnitude. Note the similarity in the reflection magnitude and the patterns of the forward and backward waveforms with the data displayed in Fig. 3.
The wave intensity is the energy flux carried by the wavefronts passing the measurement site and has the dimensions W/m2. An elegant feature is that forward running waves have positive intensity and backward waves have negative intensity. As such, computation of dI directly allows assessing whether forward or backward waves are dominant at a given moment during the cardiac cycle. The theory further discerns compression waves, which are characterized by dP > 0, i.e. there is a rise in pressure, and expansion waves where dP < 0. Note that this terminology still reflects the origin of the theory in gas dynamics. There are thus four possible types of waves, forward compression and expansion waves, and backward compression and expansion waves. We refer to the work of Parker and Jones for more details.13
When applying wave intensity analysis to pressure and flow data measured in the ascending aorta, a typical pattern is characterized by three major peaks and this is illustrated with the same data we used for the impedance analysis (cf. Fig. 4). The first peak is a forward compression wave, associated with the ejection of blood from the ventricle. The second positive peak is observed during diastole and is a forward running wave with dP < 0, thus a forward running expansion wave. This wave is believed to be caused by the ventricular relaxation which is slowing down the ejection from the heart. The only peak resulting in negative wave intensity occurs during systole when reflected waves are dominant. In this case however, the backward running wave is associated with positive dP and is thus a backward compression wave resulting from the peripheral wave reflections.
Wave intensity analysis represents an elegant paradigm that has only recently been applied to hemodynamic data. As such, its practical use and clinical value still needs to be demonstrated. It does, however, provide intuitive insight into wave reflection patterns. Its major drawback is, perhaps, the fact that computation of wave intensity implies multiplying two derivatives of the measured signals, which causes a higher sensitivity to measuring noise compared to Fourier analysis. The basic signals and derivatives should therefore be filtered adequately before applying the method. Another limitation is the dependence of the results on the choice of the sampling interval dt, which is of course limited by the sampling rate of the measuring system. The sampling rate should be high enough to capture details and rapid changes in the waveforms. In general, 200 Hz is sufficient to measure pressure and flow waveforms in humans. The smaller the sampling interval, the smaller the amplitude of the increments dP and dU, and the smaller the amplitude of the wave intensity. A normalized wave intensity using dP/dt and dU/dt has been proposed to solve this.14
| Pros |
|
| Cons |
|
Summary:
Some considerations and conclusions
In this paper, we have elaborated on some methods to assess arterial pressure wave reflection.
It is clear that, from a clinical viewpoint, the ideal method is non-invasive, fast, repeatable, sensitive and specific. Many of these conditions are fulfilled for the augmentation index, which can be derived from non-invasive applanation tonometry or, perhaps even more appealing, from ultrasound diameter distension waveforms. And yet, despite the many large studies where AIx is measured, there is still no consensus on the prognostic value of AIx in the general population. One explanation is that the presumably negative effect of wave reflection on cardiovascular function is too small to be significant or already largely represented by the classical risk factors. This is likely the case given the link with pulse pressure and consequently it is difficult to demonstrate the additional prognostic power beyond and above these classical risk factors. Another explanation is that AIx is not sensitive enough to accurately represent the effect of wave reflection. As mentioned before, AIx tends to level off around the age of 60,25 and it has many confounding factors that preclude its use as a pure marker of wave reflection.8,23
The methods based on pressure and flow can certainly provide a deeper insight in arterial pressure wave reflection, and thus have added value from a (patho-)physiological point of view. Fig. 5, for instance, illustrates how the exact contribution of the reflected wave to the total pressure wave can be calculated using wave separation techniques. Whether they are useful in the clinical perspective remains to be assessed. To the best of our knowledge, the only large scale study reporting reflection magnitude based on wave separation analysis is the Asklepios study.18 Up to date however, only cross-sectional baseline data are available in an apparently healthy population of 35–55 year old subjects (>2500 participants). This database is thus most valuable and can provide normal values of wave reflection in the general population, but it cannot provide the added value of this more complex approach in terms of predicting outcome or identifying subjects at risk. Nevertheless, we have shown that non-invasive assessment of wave reflection is feasible also in large scale studies. Our data have shown that the reflection magnitude is not different between men and women (in contrast to AIx), and that it increases from about 0.45 at the age of 38 to 0.51 at the age of 53.8 Over the same age range, AIx increased by about 12%. The correlation coefficient between reflection magnitude and AIx was 0.59.8
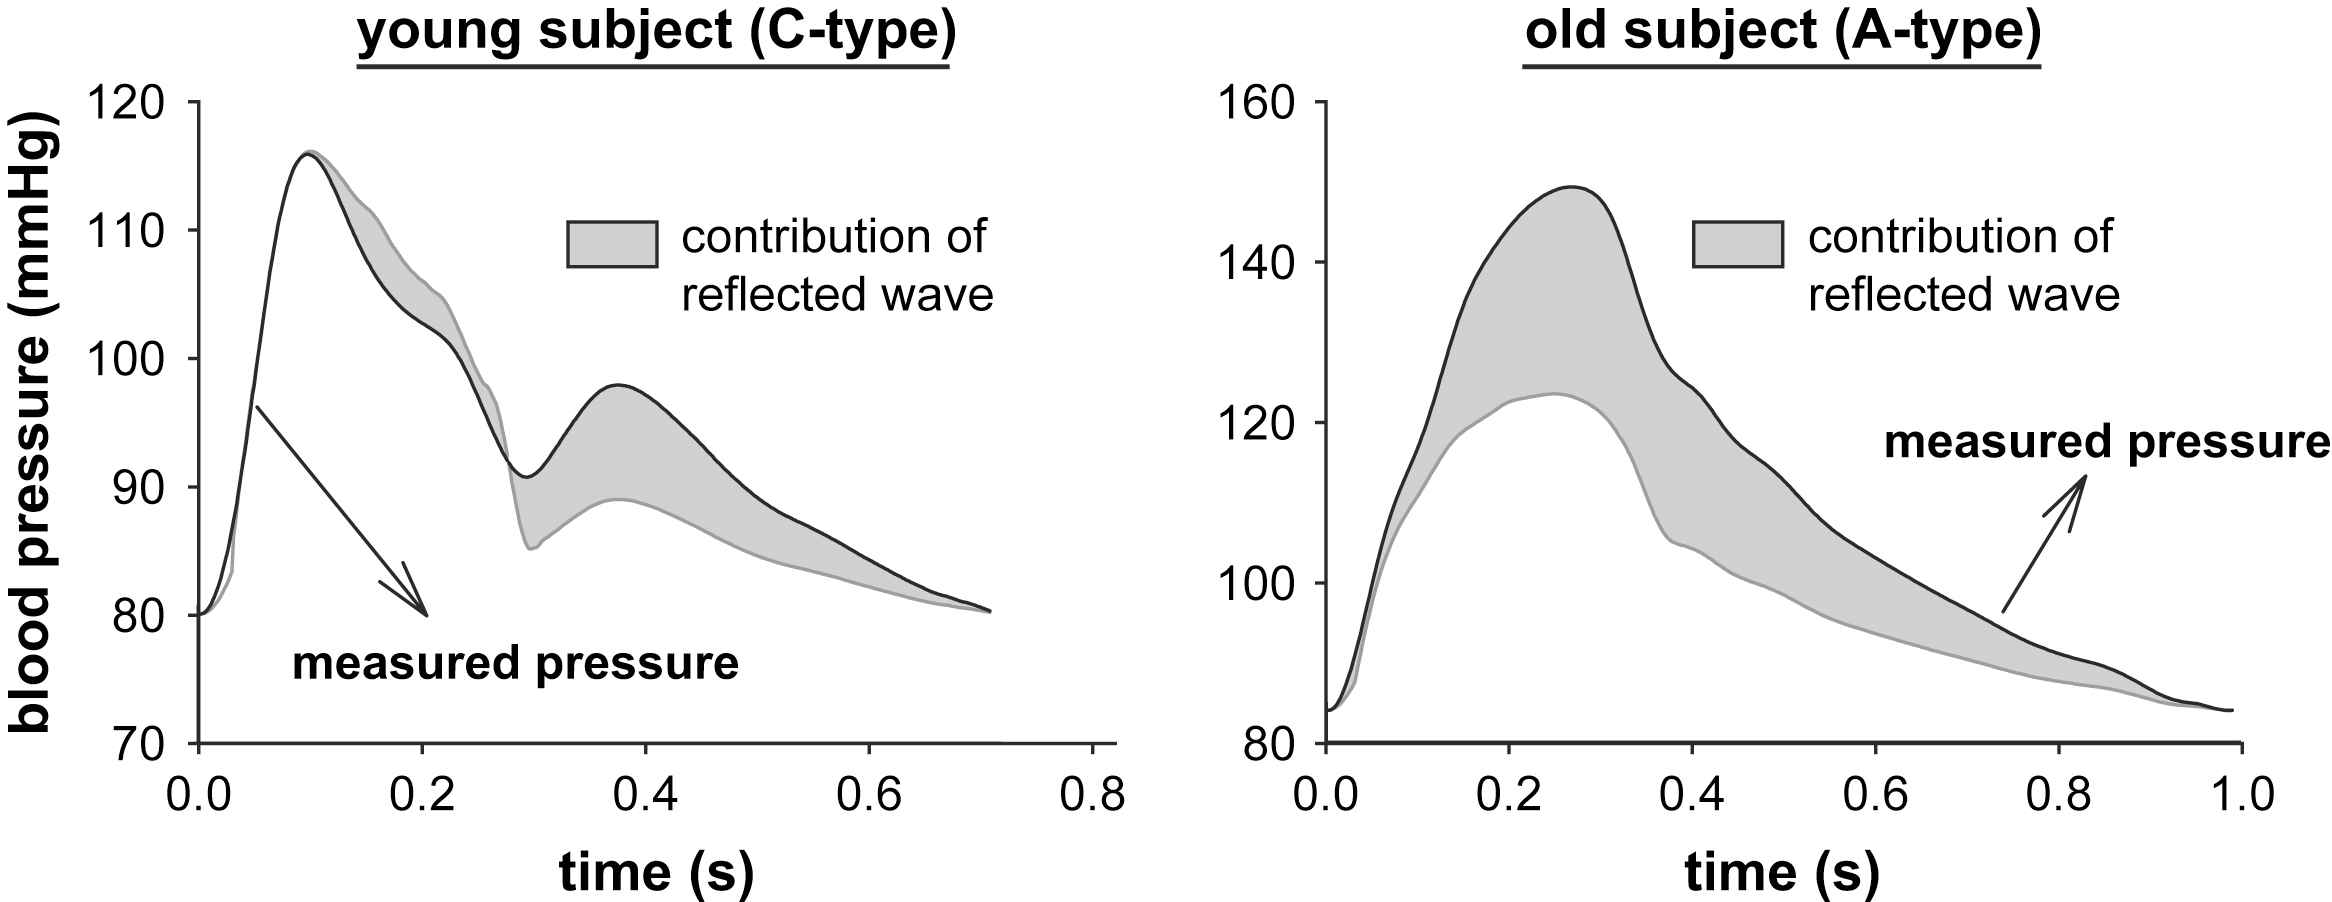
Contribution of the reflected pressure wave in young and old subjects, obtained using the principles of wave separation analysis. As well known, the reflected wave arrives in late systole and diastole in young (and tall) subjects, generating the typical “C-type” wave with late systolic inflection and adding little to the systolic blood pressure. In older subjects, increased pulse wave velocity causes the (more important) reflection to arrive at the central aorta in early systole, generating an early systolic inflection point (A-type wave) and boosting systolic blood pressure.
The third method that we addressed is wave intensity analysis, also making use of pressure and flow. The method has many appealing features, and does not rely on some of the assumptions made in the frequency domain method. The major drawback which possibly hampers a breakthrough in a clinical setting, is the fact that the method is based on the multiplication of the derivatives of the pressure and flow wave. This makes the method highly susceptible to noise and adequate signal filtering and processing is mandatory. In practice, a Savitzky–Golay filter30 can be used which smoothes the signal, yet better preserves features of the waveforms such as relative maxima, minima and width of peaks than most other filters (e.g. FIR filter). This is in contrast with the frequency domain method: as one commonly only uses the first 10 harmonics in the signals, one explicitly ignores and eliminates the higher frequency contents, hereby implicitly applying signal filtering.
In our experience, both the time and frequency domain method can stand alongside each other, and can be used in a complementary way. We recently applied both methods to gain insight into the wave reflection patterns generated by the presence of a large abdominal aortic aneurysm.31 The consequence of the sudden expansion in the abdominal aorta is a negative reflection coefficient at the fundamental frequency, generated by a dominant backward expansion wave. In our opinion, the frequency domain method has the advantage that one single number (real value of the reflection coefficient at the fundamental frequency) can quantify the dominant effect of the reflected wave, while the time domain method has the advantage of providing more (intuitive) insight into the physics of wave reflection, and allows one to unravel the contribution of all forward and backward waves, and not only the global effect of the predominant waves. On the other hand, wave intensity patterns might show spurious wobbles, which are not always easy to explain in a straightforward way (in particular when they are introduced via noisy signals).
Nevertheless, both methods definitely meet when they are used up to the level of the assembly of the forward and backward pressure wave. As we have shown with the example, the reflection magnitude calculated through the time and frequency domain analysis was close, and the patterns of the decomposed waves were very similar, underlining the fact that in a sufficiently linear system (as the arterial tree appears to be) and with a regularly beating heart, both methods actually lead to the same final result. As such, when the final goal is to decompose the pressure wave, the choice of method largely depends on the preference of the operator, and whether there is an interest in intermediate results such as the wave intensity patterns.
Acknowledgements
We are grateful to the members of the Ghent Artery research group (Sebastian Vermeersch, Jan Kips, Dries Mahieu and Luc Van Bortel) and the Asklepios investigators, and in particular to Dr. Ernst Rietzschel, Marc De Buyzere and Frida Brusselmans. Abigail Swillens is funded by a grant of the Special Fund for Scientific Research of the Ghent University (BOF).
References
Cite this article
TY  - JOUR
AU  - Abigail Swillens
AU  - Patrick Segers
PY  - 2008
DA  - 2008/06/16
TI  - Assessment of arterial pressure wave reflection: Methodological considerations
JO  - Artery Research
SP  - 122
EP  - 131
VL  - 2
IS  - 4
SN  - 1876-4401
UR  - https://doi.org/10.1016/j.artres.2008.05.001
DO  - 10.1016/j.artres.2008.05.001
ID  - Swillens2008
ER  -