
Role of aortic calcification, stiffness and wave reflections in cardiovascular risk in dialysis patients: Baseline data from the CORD study
See appendix section.
- DOI
- 10.1016/j.artres.2010.06.004How to use a DOI?
- Keywords
- Calcification; Pulse wave velocity; Stiffness; Augmentation index; Dialysis
- Abstract
Background: Accurate cardiovascular risk estimation in dialysis patients remains challenging because different pathogenetic mechanisms act simultaneously in this heterogeneous population. Radiographic calcification, aortic stiffness and wave reflection, have each individually been proven to be reliable surrogate markers for outcome. We aimed to explore to what extent these parameters intermutually provide complementary or overlapping information.
Methods: Abdominal aortic calcification scoring of a plain lateral abdominal X-ray, carotid-femoral pulse wave velocity (PWV), and central augmentation index (AIx) were measured in 1084 dialysis patients, recruited from 47 European dialysis centers.
Results: Abdominal calcification correlated well with PWV (R = 0.44, P < 0.001) but poorly with AIx (R = 0.07, P = 0.04). Next to abdominal calcification, tertiles of PWV were associated with a stepwise increase age, blood pressure, and cardiovascular history, and tertiles of AIx with age, heart rate, and anthropometric factors. In multivariate analysis, only PWV remained significantly associated with calcification score. In addition to age and blood pressure, stiffness was mainly related to diabetes and calcification score (R2 = 0.39, P < 0.001), whereas AIx was more dependent on anthropometry, gender and heart rate (R2 = 0.36, P < 0.001).
Conclusions: Information on aortic calcification and arterial abnormalities can be obtained by simple and inexpensive methodologies. Variation in wave reflections was mainly explained by anthropometric parameters. Stiffness and calcification partly provided complementary information, particularly in low-risk patients. In this group, likely to benefit most from preventive strategies and commonly considered for renal transplantation, evaluation of cardiovascular risk could be made more accurate by the assessment of both aortic calcification and arterial stiffness.
- Copyright
- © 2010 Association for Research into Arterial Structure and Physiology. Published by Elsevier B.V. All rights reserved.
- Open Access
- This is an open access article distributed under the CC BY-NC license.
Introduction
Two distinct features of cardiovascular disease (CVD) in patients with impaired renal function are the extensive and accelerated vascular calcification, occurring most frequently in the medial wall (in addition to classical intimal atheromatous calcification), and stiffening of the central elastic-type arteries, resulting in a decreased dampening capacity of pressure and flow oscillations. Mechanisms by which stiffness contributes to an increased CVD risk involve the generation of a high pressure wave by the ejection of a given blood volume into a stiff central arterial system, and its earlier reflection (wave reflection) back from the periphery due to faster wave propagation (pulse wave velocity [PWV]). The resulting mismatch between the higher systolic workload and decreased diastolic perfusion leads to a decreased coronary reserve and may cause myocardial ischemia, irrespective of pre-existing stenotic or thrombotic lesions. Recent evidence suggests that medial calcification results from an active cell-mediated process involving osteogenic transdifferentiation of smooth muscle cells,1,2 which in turn may be responsible, at least in part, for the increased stiffening of the medial wall.
The Calcification Outcome in Renal Disease (CORD) study is the first prospective epidemiological multinational study that integrates information on arterial calcification, stiffness and wave reflections in prevalent dialysis patients. The study was designed to reflect daily clinical practice and therefore used low-cost resources, such as plain X-ray, with a minimal burden for patients and physicians.
The aim of the present analysis was to describe the baseline values of abdominal aortic calcification (AAC), carotid-femoral PWV and central augmentation index (AIx), and then to correlate them with potential factors that might affect them, as well as established CVD risk factors. In addition, the aim was to evaluate the extent to which these three parameters rendered complementary or redundant information in the discrimination of CVD risk, with specific focus on the lowest risk patient group. The latter patients are likely to benefit most from potential interventions and are commonly considered for renal transplantation, making adequate estimation of CVD risk of particular importance in this subgroup.
Patients and methods
Scope
The target population was a representative sample of prevalent European dialysis patients, treated by hemo- (HD) or peritoneal dialysis (PD) at inclusion. Based on previous studies and because of the expected fast decline in number of patients remaining on dialysis due to mortality or transplantation, it was estimated that an initial cohort of at least 500 patients was needed to have a reasonable power for a longitudinal analysis after 2 years. The study was conducted in Belgium, The Netherlands, Denmark, Sweden, Norway, and Finland.
Patients
During initial screening, all patients on dialysis were registered in an online electronic database with information on age, gender, diabetes, time on dialysis, and smoking status. Eligibility for participation was determined by an automated computer algorithm to ensure that the final study population would be representative of the total group of screened patients with respect to these factors. Selection continued until 20% of dialysis patients (in larger centers) or 20 patients (in smaller centers), had been included.
Inclusion and exclusion criteria
Patients aged 18 years and over treated by maintenance HD or PD for at least 3 months could enter the study after selection by the automated computer algorithm. Exclusion criteria were conditions making arterial measurements technically impossible or unreliable, such as cardiac arrhythmias, amputations or severe peripheral vascular lesions, and an anticipated life expectancy of less than 6 months. The study was approved by the ethics committee at each participating center, and all patients gave written informed consent.
Assessment of arterial calcification
AAC was assessed by semi-quantitative scoring (AAC score) of a plain lateral lumbar radiograph according to a previously validated method.3 This scoring correlates well with findings on electron beam computed tomography of the coronary arteries,4 but is considerably less expensive and more widely available. All radiographs were collected for central reading and scored by two investigators (one for the Nordic countries and one for Belgium and The Netherlands) who were blinded to the patient data. Interobserver agreement based on a cross-reading of 64 radiographs was excellent (kappa with linear weighting = 0.82). A repeat radiograph after 2 years was recommended but optional.
Since optimal cut-off values of AAC scores for predicting outcome in dialysis patients were unknown, the scores were categorized into tertiles, consistent with the approach used by Wilson and co-workers.5 In the present cohort, this corresponded to scores of ≤4 (no or minor calcification), 5–15 (moderate calcification), or ≥16 (heavy calcification). Scores were analyzed as a continuous variable in non-parametric tests or in tertiles for other analyses. Missing values of AAC scores (10.7%) were tested for patterns in age, gender, diabetes, smoking, and history of cardiovascular disease (all missing <5%), none of which were significant. Additionally, the assumption of data Missing Completely At Random could not be rejected (Little’s Chi-square = 5.2, df = 4, P = 0.27). Therefore subsequent complete case analyses could be performed without a risk for biased estimates.
Assessment of arterial stiffness and wave reflection
PWV and AIx were measured at baseline and after 12 and 24 months of follow-up by trained research nurses or study physicians according to local regulations of the individual centers, again to ensure that practices matched daily clinical routine. Measurements were performed in the supine position, before a HD session or after drainage of the abdominal cavity in PD patients. Upper limb arterial measurements were recorded in the dominant or non-fistula arm. Brachial artery blood pressure was measured with a validated oscillometric device or a mercury sphygmomanometer, using phases I and V of the Korotkoff sounds, respectively, as the systolic and diastolic blood pressure.
Radial artery pressure waves were obtained from applanation tonometry with a high-fidelity micromanometer (SPC-301, Millar Instruments), calibrated on the brachial systolic and diastolic blood pressure. From these radial waveforms, a corresponding central wave was reconstructed by the application of a validated generalized transfer function6 (SphygmoCor software version 7, AtCor Medical). The integral system software calculated the central augmentation pressure as the difference between the second and first systolic peaks, and AIx as the ratio of augmentation to central pulse pressure, expressed as a percentage. AIx was mathematically corrected for the confounding effect of heart rate when analyzed univariately or as a summary measure for groups of cases, and statistically when analyzed as a continuous variable. Mean arterial pressure (MAP) was derived from the time-integration of the central waveform.
Aortic PWV was measured by sequentially recording ECG-gated carotid and femoral artery pressure waves using the same device. The path length was calculated by subtracting the distance between sternal notch and carotid recording site from the distance between sternal notch and femoral site. PWV was calculated as the path length divided by transit time (m/s). Quality control of the tonometric waves (PWV) was performed by visual inspection of the curves by a blinded reader (F.V.), in addition to the internal quality control checks of the SphygmoCor software (AIx). Because of its skewed distribution, PWV was log-transformed (ln[PWV]) where inferences assumed a normal distribution.
Patient characteristics, laboratory values and medication
Details on demographics, medication use and routine biochemistry at baseline have been published elsewhere.7 Body surface area was calculated according to the formula of DuBois and DuBois. Hematocrit, serum calcium, phosphorus, parathyroid hormone, albumin, C-reactive protein, total cholesterol, high density lipoprotein (HDL) cholesterol, and triglycerides were determined at each center using standard methodology, consistent with the study design aimed to reflect routine clinical practice. Presence of clinical CVD was defined according to the modified Charlson score.8 All data were entered into a dedicated online web-database (AAIPharma Clinical Trials Services, Spain), which allowed continuous update and verification.
Statistical analysis
Data are presented as means, medians, or percentages as appropriate. Patient characteristics are presented according to tertiles of PWV and AIx, which allows an appreciation of the data in terms of stiffness and wave reflection. The obtained cut-off values for PWV (8.8 m/s and 12.0 m/s) and AIx (25% and 34%) were similar to those reported previously in outcome studies by Blacher et al.9 and London et al.10 In this way, the tertiles reflected an increasing risk for mortality based on PWV and AIx according to the existing evidence.
Between group differences were tested using ANOVA for continuous variables, or their non-parametric equivalents, where appropriate. In addition, we also analyzed separately patients with low, intermediate or high prior probability of CVD based on age ≤65 or >65 years and absence or presence of CVD history (CVD history −/+). Patients were defined as low-risk (age <65 years/CVD history −), intermediate-risk (age ≤65 years/CVD history +; or age >65 years/CVD history −), and high-risk (age >65 years/CVD history +). An age of 65 years corresponded to the median of our population and is also used by regulatory agencies (Food and Drug Administration [FDA], European Medicines Agency [EMEA]) to define an elderly population. A positive CVD history indicates established disease and is included in most risk-scores and guidelines to determine thresholds for treatment decisions. It was deemed relevant to explore surrogate markers like AAC, PWV and AIx in the low-risk group because these patients are often considered for renal transplantation or for preventive strategies.
Univariate relationships between AAC scores, PWV and AIx, were assessed by Spearman-rank correlation. Independent relationships of patient characteristics with the outcome variables ln(PWV) and AIx, were explored using multiple linear regression analysis. The selection of covariates was based on known associations from literature and from significant (biologically meaningful) univariate relationships. Non-linear relationships with age, as reported previously,11,12 were tested using quadratic age. Models generated by the stepwise procedure, backward elimination and forward selection were compared. The final model was based on the set of variables that consistently explained the variance in the most parsimonious way. Model assumptions were verified by analysis of residuals. All analyses were performed with SPSS software (version 15, SPSS Inc., Chicago). Tests were two-tailed and a P value <0.05 was considered significant.
Results
Cohort selection
From January 1st 2004 to June 30th 2005, 3932 patients were screened, of whom 1084 (28%) were eventually selected for inclusion by the software algorithm. Due to incomplete data, 17 selected patients (1.6%) were excluded, leaving 1076 patients in the present analysis. The proportions of males, current smokers, as well as time on dialysis were not different from those of the originally screened cohort. There was a small but statistically significant difference in age (61.5 vs. 63.1 years, included vs. non-included patients, P = 0.004) and in percentage of diabetics (23.3% vs. 27.3%, included vs. non-included patients, P = 0.012), despite the stratified inclusion software algorithm. Mean values of the studied parameters for the overall cohort are shown in Table 1.
| Measure | Value |
|---|---|
| PWV (m/s) | 11.2 ± 0.2 |
| AIx (%) | 29.0 ± 0.4 |
| AAC (points) | 10 (2–18) |
| BA SP (mmHg) | 148 ± 0.8 |
| BA DP (mmHg) | 79 ± 0.4 |
| MAP (mmHg) | 103 ± 0.5 |
| HR (sec−1) | 71 ± 0.4 |
Data are mean ± S.E.M. or median (interquartile range).
PWV, Pulse Wave Velocity; AIx, Augmentation Index; AAC, abdominal aortic calcification score; BA SP, brachial artery systolic blood pressure; BA DP, brachial artery diastolic blood pressure; MAP, mean arterial pressure; HR, heart rate.
Baseline values of aortic calcification en hemodynamic measures for the total population.
Aortic calcification, PWV and central AIx according to CVD risk
Fig. 1 shows the distribution of z-scores of AAC, PWV and AIx according to prior probability of CVD based on median age and CVD history. Although a stepwise increase in all three parameters is observed with increasing risk categories, the standard deviations show considerable overlap indicating that calcification, stiffness and/or increased wave reflections can be present in low-risk patients. Indeed, in the low-risk group (n = 375), moderate to severe calcification was detected in 22% and 12%, and modest to pronounced stiffness in 27% and 12%. Low-risk patients were almost evenly distributed across tertiles of AIx (39%, 28% and 33% in the lowest, middle and upper thirds, respectively).
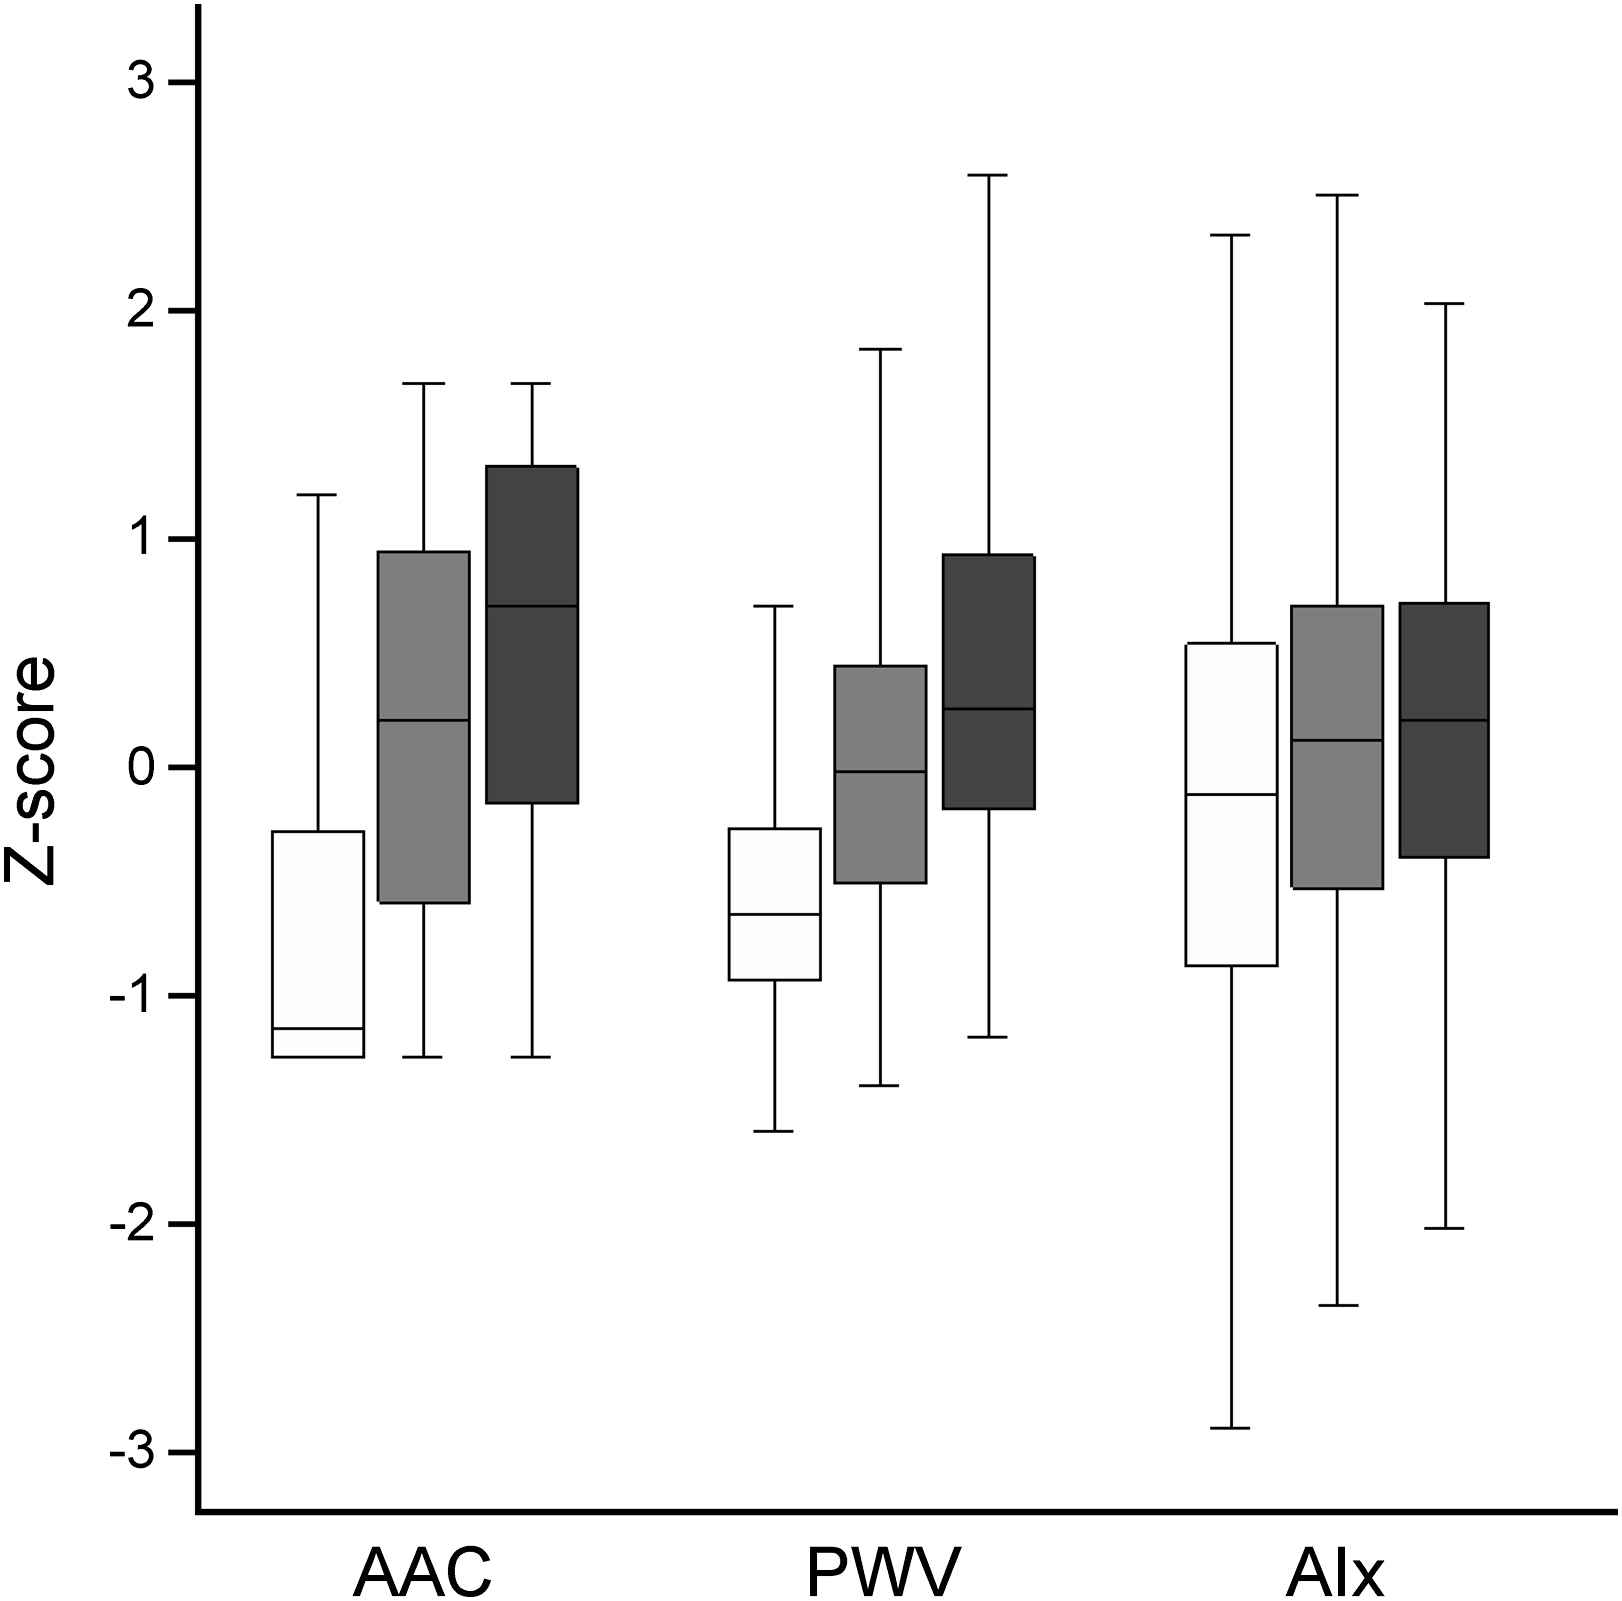
Distribution of PWV, AAC and AIx in patients with low (white bars), intermediate (gray bars) and high (black bars) risk according to age and history of cardiovascular disease.
Univariate relationships between PWV, AIx, and AAC scores
AAC scores correlated well with PWV (R = 0.44, P < 0.001) but very weakly with AIx (R = 0.07, P = 0.04). AIx correlated only weakly with PWV (R = 0.14, P < 0.001), despite the fact that AIx is pathophysiologically dependent on PWV. Table 2 shows the patient characteristics according to tertiles of PWV (panel A) and AIx (panel B). Median AAC scores according to tertiles of PWV (Fig. 2A) and AIx (Fig. 2B) are displayed for patients at low (white bars), intermediate (gray bars), and high-risk (black bars). Patients aged ≥65 years and/or those with known CVD (intermediate- and high-risk groups) had a considerably higher burden of calcification than those aged <65 years and without previous CVD events (low-risk group). Differences in calcification among levels of AIx and PWV were mainly present in low- and intermediate-risk patients. PWV was much stronger associated with calcification than AIx, especially in low-risk patients.

Median abdominal aortic calcification (AAC) score according to tertiles of PWV (panel A) and tertiles of AIx (panel B) in patients with low (white bars), intermediate (gray bars) and high (black bars) risk based on age and history of cardiovascular disease.
| PWV (tertiles) | P value | |||
|---|---|---|---|---|
| <8.8 m/s | 8.8–12.0 m/s | >12.0 m/s | (ANOVA) | |
| Age (years) | 50.0 | 65.0 | 69.9 | <0.001 |
| Male gender (%) | 58.1 | 62.3 | 60.9 | NS |
| Non caucasian (%) | 7.7 | 3.4 | 4.1 | 0.025 |
| Diabetes (%) | 8.3 | 20.6 | 31.5 | <0.001 |
| Smoking (%) | 23.9 | 16.9 | 16.2 | 0.017 |
| Pos. CVD history (%) | 23.0 | 48.0 | 58.5 | <0.001 |
| Peritoneal dialysis (%) | 17.7 | 16.6 | 12.6 | NS |
| Dialysis vintage (months)a | 28.0 | 30.3 | 27.8 | NS |
| Length (m) | 1.70 | 1.70 | 1.68 | 0.003 |
| Weight (kg) | 70.7 | 71.9 | 71.2 | NS |
| Body mass index (kg/m2) | 24.4 | 24.9 | 25.3 | 0.037 |
| Body surface area (m2) | 1.81 | 1.82 | 1.80 | NS |
| Hemoglobin (g/dL) | 12.1 | 11.9 | 12.1 | NS |
| Albumin (mg/L) | 37.8 | 36.4 | 36.9 | <0.001 |
| Calciumalb (mg/dL) | 9.7 | 9.7 | 9.7 | NS |
| Phosphate (mg/dL) | 5.4 | 5.1 | 5.1 | 0.029 |
| CaxP (mg2/dL2) | 52.0 | 49.6 | 49.2 | 0.041 |
| PTH (pg/dL)a | 180 | 166 | 180 | NS |
| Total cholesterol (mg/dL) | 163 | 165 | 163 | NS |
| HDL cholesterol (mg/dL) | 48 | 50 | 49 | NS |
| LDL cholesterol (mg/dL) | 84 | 87 | 85 | NS |
| Triglycerides (mg/dL)a | 139 | 133 | 136 | NS |
| C-Reactive Protein (mg/L)a | 5 | 5 | 6 | 0.004 |
| AIx (%) | 26.9 | 28.7 | 30.4 | 0.001 |
| PWV (m/s)a | 7.4 | 10.2 | 14.6 | <0.001 |
| SBP (mmHg) | 138 | 147 | 157 | <0.001 |
| DBP (mmHg) | 80 | 78 | 79 | NS |
| BPP (mmHg) | 58 | 68 | 78 | <0.001 |
| MAP (mmHg) | 100 | 102 | 105 | <0.001 |
| Heart rate (min−1) | 73 | 71 | 72 | NS |
| Ejection duration (ms) | 308 | 313 | 317 | 0.007 |
| AAC scorea | 2 | 11 | 15 | <0.001 |
PWV, Pulse Wave Velocity; AIx, Augmentation Index; CVD, cardiovascular disease; Calciumalb, serum calcium corrected for albumin; CaxP, calcium-phosphorus product; PTH, parathyroid hormone; HDL, high density lipoprotein; LDL, low density lipoprotein; SBP, systolic blood pressure; DBP, diastolic blood pressure; BPP, brachial pulse pressure; MAP, mean arterial pressure; AAC, abdominal aortic calcification.
median value.
Baseline characteristics according to tertiles of pulse wave velocity.
| AIx (tertiles) | P value | |||
|---|---|---|---|---|
| <25% | 25–34% | >34% | (ANOVA) | |
| Age (years) | 58.9 | 63.3 | 64.5 | <0.001 |
| Male gender (%) | 68.5 | 61.6 | 47.4 | <0.001 |
| Non caucasian (%) | 4.9 | 4.3 | 5.5 | NS |
| Diabetes (%) | 21.7 | 20.5 | 21.4 | NS |
| Smoking (%) | 15.9 | 21.4 | 18.8 | NS |
| Pos. CVD history (%) | 39.6 | 44.2 | 47.4 | NS |
| Peritoneal dialysis (%) | 19.9 | 18.8 | 9.8 | <0.001 |
| Dialysis vintage (months)a | 27.6 | 29.3 | 28.2 | NS |
| Length (m) | 1.71 | 1.69 | 1.66 | <0.001 |
| Weight (kg) | 75.5 | 71.4 | 67.3 | <0.001 |
| Body mass index (kg/m2) | 25.7 | 25.0 | 24.3 | <0.001 |
| Body surface area (m2) | 1.87 | 1.81 | 1.75 | <0.001 |
| Hemoglobin (g/dL) | 12.0 | 12.1 | 12.1 | NS |
| Albumin (mg/L) | 37.2 | 36.8 | 37.1 | NS |
| Calciumalb (mg/dL) | 9.7 | 9.7 | 9.6 | NS |
| Phosphate (mg/dL) | 5.2 | 5.1 | 5.2 | NS |
| CaxP (mg2/dL2) | 51.0 | 50.1 | 49.6 | NS |
| PTH (pg/dL)a | 177 | 162 | 184 | NS |
| Total cholesterol (mg/dL) | 162 | 165 | 165 | NS |
| HDL cholesterol (mg/dL) | 46 | 50 | 51 | <0.001 |
| LDL cholesterol (mg/dL) | 84 | 84 | 87 | NS |
| Triglycerides (mg/dL)a | 145 | 136 | 129 | 0.014 |
| C-Reactive Protein (mg/L)a | 5 | 5 | 5 | NS |
| AIx (%) | 15.6 | 29.4 | 41.0 | <0.001 |
| PWV (m/s)a | 10.0 | 10.2 | 10.9 | 0.024 |
| SBP (mmHg) | 139 | 147 | 156 | <0.001 |
| DBP (mmHg) | 77 | 79 | 81 | 0.001 |
| BPP (mmHg) | 62 | 68 | 75 | <0.001 |
| MAP (mmHg) | 97 | 102 | 109 | <0.001 |
| Heart rate (min−1) | 77 | 71 | 67 | <0.001 |
| Ejection duration (ms) | 296 | 313 | 331 | <0.001 |
| AAC scorea | 8 | 10 | 11 | 0.002 |
PWV, Pulse Wave Velocity; AIx, Augmentation Index; CVD, cardiovascular disease; Calciumalb, serum calcium corrected for albumin; CaxP, calcium-phosphorus product; PTH, parathyroid hormone; HDL, high density lipoprotein; LDL, low density lipoprotein; SBP, systolic blood pressure; DBP, diastolic blood pressure; BPP, brachial pulse pressure; MAP, mean arterial pressure; AAC, abdominal aortic calcification.
median value.
Baseline characteristics according to tertiles of augmentation index.
Multivariate models of independent determinants of PWV and AIx
The relationships between calcification and PWV, and between calcification and AIx, are shown in Table 3A and Table 3B, respectively. Models without (model 1) and with adjustment for covariates (model 2) are presented. The final model includes the variables that explained the variance in the most parsimonious way (Model 3). For reasons of comparability, AAC score was forced into the model of AIx (despite being not significant). The total variance explained by the models was 36% for AIx and 39% for ln(PWV). After including age, the relationship between calcification and AIx lost statistical significance while for PWV, AAC score remained a significant predictor but its coefficient was decreased by more than 50%, indicating that age was an important confounder in these relationships. Including quadratic age significantly improved the model fit for AIx due to a steeper increase at young age, but not for PWV. We confirmed the association of AIx with gender, heart rate and anthropometric factors. Forcing PWV into the model, in order to adjust for the known dependence of AIx on stiffness, did not yield different results (data not shown).
| Variable | Coefficient | Standard error | Beta | P value | Incremental adj. R2 |
|---|---|---|---|---|---|
| Model 1 | |||||
| (Constant) | 1.994 | 0.028 | <0.001 | ||
| AAC (tertile) | 0.175 | 0.013 | 0.4 | <0.001 | 0.159 |
| Model 2 | |||||
| (Constant) | 1.099 | 0.075 | <0.001 | ||
| Age (years) | 0.01 | 0.001 | 0.462 | <0.001 | 0.285 |
| MAP (mmHg) | 0.004 | 0.001 | 0.197 | <0.001 | 0.324 |
| AAC (tertile) | 0.078 | 0.013 | 0.178 | <0.001 | 0.348 |
| Model 3 | |||||
| (Constant) | 1.089 | 0.072 | <0.001 | ||
| Age (years) | 0.010 | 0.001 | 0.464 | <0.001 | 0.284 |
| Diabetes | 0.190 | 0.023 | 0.214 | <0.001 | 0.336 |
| MAP (mmHg) | 0.004 | 0.001 | 0.189 | <0.001 | 0.372 |
| AAC (tertile) | 0.070 | 0.013 | 0.160 | <0.001 | 0.391 |
Model 1: unadjusted; Model 2: adjusted for age and MAP; Model 3: final model.
PWV, Pulse Wave Velocity; MAP, mean arterial pressure; AAC, abdominal aortic calcification.
Regression models for Ln(PWV) (m/s).
| Variable | Coefficient | Standard error | Beta | P value | Incremental adj. R2 |
|---|---|---|---|---|---|
| Model 1 (Constant) | 25.994 | 1.014 | <0.001 | ||
| AAC (tertile) | 1.491 | 0.471 | 0.103 | 0.002 | 0.010 |
| Model 2 (Constant) | 77.507 | 4.098 | <0.001 | ||
| HR (sec−1) | −0.367 | 0.030 | −0.364 | <0.001 | 0.146 |
| BSA (m2) | −15.199 | 1.591 | −0.275 | <0.001 | 0.223 |
| Age (years) | 0.077 | 0.025 | 0.101 | 0.003 | 0.233 |
| AAC (tertile) | 0.236 | 0.474 | 0.016 | 0.619 | 0.233 |
| Model 3 (Constant) | 40.544 | 5.310 | <0.001 | ||
| HR (sec−1) | −0.401 | 0.027 | −0.397 | <0.001 | 0.146 |
| MAP (mmHg) | 0.239 | 0.020 | 0.323 | <0.001 | 0.243 |
| BSA (m2) | −13.868 | 1.762 | −0.251 | <0.001 | 0.324 |
| Age (years) | 0.565 | 0.148 | 0.742 | <0.001 | 0.341 |
| Age2 (years2) | −0.004 | 0.001 | −0.609 | 0.002 | 0.349 |
| Male gender | −2.060 | 0.745 | −0.087 | 0.006 | 0.354 |
| (AAC (tertile) | −0.008 | 0.437 | −0.001 | 0.985 | 0.354 |
Model 1: unadjusted; Model 2: adjusted for HR, BSA and age; Model 3: final model.
AIx, Augmentation Index; MAP, mean arterial pressure; AAC, abdominal aortic calcification; HR, heart rate; BSA, body surface area.
Regression models for AIx (%).
Discussion
The CORD study is the first large scale clinical study to assess in dialysis patients at the same time aortic calcification (AAC), arterial stiffness (PWV) and wave reflections (AIx) using widely available and relatively low-cost methodology. The baseline characteristics reported here compare well with those of the Euro-DOPPS registry,13 indicating that the studied population is representative of the average European dialysis situation. The current analysis of the CORD data looked at the inter-relationships between AAC, PWV and AIx, to evaluate whether these surrogate measures for CVD risk provide complementary or rather overlapping information. The differences in factors influencing PWV and AIx and their different relationship with AAC suggest that the three markers are complementary rather than redundant to each other. The prevalence of some traditional CVD risk factors was increased in the higher risk groups as determined by PWV and AIx. Nevertheless, in the group of younger patients without established CVD, considered at low-risk according to traditional risk factors, a substantial proportion had increased values of AAC, PWV and/or AIx. The detection of increased values of these surrogate markers may be of importance in these patients if they are to be considered for transplantation. Also, in interventional trials, these parameters may be measured at baseline in order to avoid the potential confounding effect of differences in baseline risk not identified by traditional risk factors. This study is the first to concomitantly describe three surrogate markers of CVD that have so far only been evaluated in smaller monocentric studies focusing on only one of these three parameters. It has been demonstrated that AAC, PWV and AIx cannot be used interchangeably to evaluate risk, since elevated values of one parameter does not necessarily imply similar changes in the other surrogate markers. Therefore, simultaneous assessment of these three parameters may provide relevant additional information regarding the CVD status of the patient, especially in the patient group considered at low-risk for CVD (based on traditional risk factors and criteria).
Vascular calcification, aortic PWV, as well as central AIx have been shown to be predictors of CVD and all-cause mortality in monocentric trials of HD patients9,10,14 and in non-renal populations,15,16 but there is only limited and preliminary evidence that improvement of these parameters by medical intervention, such as in the CAFÉ-study,17 also reduces event-rates (independently). Although these three potential intermediate endpoints are influenced by different pathophysiological processes, it is currently unknown whether and to what extent they also identify risk differently. Consequently, it has been recommended to perform further research into the relationship between radiologic vascular calcification and measurements of arterial stiffness,18 or to measure both PWV and pulse wave analysis derived parameters (such as AIx) to determine the contribution of stiffness to wave reflections.19 The current study represents an integration of these recommendations by combining information concerning all three measures. Principal findings were the apparent disparity between AIx and PWV; their different determinants, in particular calcification status; and the fact that both could be below average despite moderate or even heavy calcification and vice versa.
Major factors related to AIx were similar as in other populations: age, gender, hemodynamic (heart rate, MAP) and anthropometric variables.11 In contrast to PWV, AIx was not independently related to calcification and diabetes status. The results were not affected by including PWV as a predictor of AIx, in order to account for the contribution of stiffness to wave reflections, as has been recommended.19 Moreover, although AIx in part depends on stiffness, it correlated rather weakly with PWV. This may be due to the fact that PWV only (partially) affects the transit time of the reflected wave, but not the other determinants of AIx: distance to the apparent reflecting site (partially related to patient length, also influencing transit time), timing of the reflected wave with regard to the ejection duration (related to heart rate), intensity of wave reflection, and amplitude of the forward pressure wave (related to cardiac output). Another reason for the weak correlation with PWV may be that AIx probably is a more sensitive parameter of early vascular damage, in line with the more pronounced increase of AIx at younger age in normal vascular ageing.11 We also observed a steeper increase at young age, indicated by the significant quadratic age term, but more importantly, the average AIx in the second decade was 22% (data not shown) which corresponds to the average observed in healthy persons in the fifth decade.11 The AIx of the youngest dialysis patients thus corresponds to the vascular status of middle-aged healthy persons. Similarly, the plateau effect after 50 years in normal vascular ageing may already be reached in adolescent dialysis patients, which is in line with the well-known epidemiological data in dialysis patients of a log-scale increased mortality rate at young age.20
The observed independent relationship between AAC and PWV confirms recent analyses of the population-based Rotterdam study21 and the Anglo-Cardiff Collaboration Trial22 as well as the results of a recent study in 131 HD patients,23 and supports the notion that calcification in dialysis patients is mainly medial wall calcification, leading to vascular stiffness. The AAC scoring system used in the present study is unable to differentiate between medial and intimal calcifications. However, intimal atherosclerotic plaque calcifications affect the conduit function of arteries, whereas medial calcification is considered the predominant type contributing to the loss of dampening ability of large capacitative arteries. Therefore, a similar amount of calcification located at the medial versus the intimal layer could result in a different effect on stiffness, as observed in the present study. This distinction between both types of calcification is relevant because animal studies have shown that different pathogenetic factors may be involved1,2 and also prognosis and response to different therapies may depend on the type of calcification.24 Interventional studies on calcification should thus evaluate both AAC and PWV as this could be helpful in discriminating between the two types of calcification.
The CORD study had several limitations. Biochemical values were single point determinations obtained from local laboratories and therefore subject to inter-assay variability. These limitations, however, would tend to bias the results towards the null-hypothesis and thus do not invalidate the conclusions. The study also involved a prevalent dialysis cohort and although time on dialysis did not confound the observed relationships, care should be taken in extrapolating the results to new dialysis patients. Finally, the present analysis is cross-sectional so that cause and effect cannot be distinguished. Although the results are partly confirmatory regarding the determinants of PWV and AIx, the present study was about 4 times larger than previous studies in dialysis and also included a substantial number of patients on peritoneal dialysis (n = 171), a subgroup that is absent or very poorly represented in other studies. Moreover, the CORD study was an international multicentric study conducted in a clinical setting corresponding to current standards of medical care, so that the data and conclusions are representative and valid for a large group of dialysis patients. Therefore, we believe that any confirmatory information of this kind is also worthwhile to communicate to the medical community. This paper is the first to demonstrate in a multicentric trial that measurement of AAC, PWV, and AIx is feasible in routine daily clinical practice. Pending further information on treatment modalities and outcome, the obtained data could become relevant for the clinical management of the patient.
Conclusion
Aortic calcifications and arterial abnormalities can be measured using simple and inexpensive yet reliable methodology that can be implemented in routine daily clinical practice. Although these measures show similarities in their relationships to some common risk factors, they also provide complementary information in the assessment of CVD. Until more information becomes available on their optimal (combined) use in CVD risk estimation, simultaneous measurement of all three parameters should be considered the best approach for complementing and improving CVD risk stratification, particularly in patients without an obviously (a priori) increased risk. Longitudinal and outcome data of the CORD study will provide a better insight in the evolution and predictive value of these surrogate endpoints.
Support
The CORD Study was sponsored by Genzyme.
Conflicts of interest/disclosures
F Verbeke and E Honkanen have served as consultant to Genzyme. F Verbeke, R Vanholder, PL Rensma, B Wikström, PB Jensen, J-M Krzesinski, W Van Biesen and E Honkanen have acted as study investigators funded by Genzyme. M Rasmussen is an employee of Genzyme.
Appendix
CORD study investigators
Belgium
Dr. M. Dhaene, RHMS Badour • Dr. A. Chachati, CHR Huy • Dr. P. Cambier, CHR Citadelle Liege • Prof. JM. Krzesinski, CHU Liege • Dr. E. Bertrand, CHR Seraing • Prof. M. Jadoul, UCL St. Luc Bruxelles • Dr. M. Wauthier, St. Pierre Hospital Ottignies • Dr. J. J. Lafontaine, Clinique du Sud Luxembourg Arlon • Dr. I. Vandewiele, Heilig Hart Hospital Roeselare • Dr. K. Claes, UZ Gasthuisberg Leuven • Dr. J. De Meester, Onze Lieve Vrouwziekenhuis Aalst • Dr. B. De Moor, Virga Jesse Hospital Hasselt • Dr. F. Verbeke, Gent University Hospital • Dr. J. C. Stolear, RHMS Tournai •
The Netherlands
Dr. J.A. Bijlsma, Dianet Dialysecentrum Amsterdam • Dr. P.L. Rensma, Sint Elizabeth Ziekenhuis Tilburg • Dr. H.G. Peltenburg, Groene Hart Ziekenhuis Gouda • Drs. I. Keur, Academisch Medisch Centrum Amsterdam • Dr. F.J. van Ittersum, VU Medisch Centrum Amsterdam • Dr. C.J.A.M. Konings, Catharina Ziekenhuis Eindhoven • Dr. L.A.M. Frenken, Atrium Medisch Centrum Heerlen • Dr. H.W. van Hamersvelt, Universitair Medisch Centrum St. Radboud Nijmegen • Dr. C.A. Verburgh, Kennemer Gasthuis, Haarlem • Dr. Y.W.J. Sijpkens, Leids Universitair Medisch Centrum Leiden • Drs. W.A. Bax, Medisch Centrum Alkmaar • Dr. W.D. Kloppenburg, Martini Ziekenhuis Groningen • Dr. C.A.J.M. Gaillaird, Meander Medisch Centrum Amersfoort •
Denmark
Dr. P. B Jensen, Odense University Hospital • Dr. J. Dam Jensen, Aarhus University Hospital • Dr. J. Hagstrup Christensen, Aalborg Hospital/Aarhus University Hospital • Dr. S. Ladefoged, Copenhagen University Hospital • Dr. K. E. Otte, Fredericia & Kolding Hospitals •
Norway
Dr. K. Aasarød, Trondheim University Hospital • Dr. H. Viko, Ullevål University Hospital • Dr. L. Gøransson, Stavanger University Hospital • Dr. E. Svarstad, Haukeland University Hospital •
Sweden
Dr. M. Haarhaus, Linköping University Hospital • Dr. G. Welander, Karlstad Central Hospital • Dr. G. Sterner, Malmö University Hospital • Prof. A. Alvestrand, Karolinska University Hospital • Dr. B. Wikström, Uppsala University Hospital •
Finland
Dr. H. Saha, Tampere University Hospital • Dr. E. Honkanen, Helsinki University Hospital • Dr. K. Metsärinne, Turku University Hospital • Dr. P. Karhapää, Kuopio University Hospital • Dr. R. Ikäheimo, Oulu University Hospital •
References
Cite this article
TY  - JOUR
AU  - Francis Verbeke
AU  - Raymond Vanholder
AU  - Pieter L. Rensma
AU  - Björn Wikström
AU  - Per Bruno Jensen
AU  - Jean-Marie Krzesinski
AU  - Merete Rasmussen
AU  - Wim Van Biesen
AU  - Eero Honkanen
AU  - on behalf of the CORD Study investigators
PY  - 2010
DA  - 2010/07/14
TI  - Role of aortic calcification, stiffness and wave reflections in cardiovascular risk in dialysis patients: Baseline data from the CORD study
JO  - Artery Research
SP  - 81
EP  - 90
VL  - 4
IS  - 3
SN  - 1876-4401
UR  - https://doi.org/10.1016/j.artres.2010.06.004
DO  - 10.1016/j.artres.2010.06.004
ID  - Verbeke2010
ER  -