
Non-invasive assessment of allometric scaling laws in the human coronary tree
- DOI
- 10.1016/j.artres.2010.09.002How to use a DOI?
- Keywords
- Allometry; Multisclice computed tomography; Coronary artery disease; Skeletonization; Coronary morphometry
- Abstract
Assessing the geometry of the coronary arteries in a patient can help to better explain coronary artery disease (CAD) development. Allometric scaling functions were successfully applied to describe how essential materials are transported through recursive networks, also observed in the coronary tree. In this work we used skeletonization methods on multislice computed tomography (MSCT) images to render the coronary tree in 3D. Fifty subjects were recruited in two groups: 1) free from plaques and 2) with focal lesions. The left coronary tree was segmented using a custom algorithm with minimum user intervention. Vessels were separated using a stem-crown architecture. Cumulative arterial length (L) with volume (V) and vessel stem diameter (DSTEM) with distal L functions were analysed. In the allometric functions L = kv Vβ and DSTEM = kL Lγ, no significant differences were found between groups. The scaling exponent range for β was 0.6–0.9 and for γ was 0.1–0.4. Values were not different from other studies in pigs. In a Log–Log scatter plot in all patients, lines were parallel, confirmed with an ANCOVA. In other words, the allometric function stood for all patients. The idea that parameters from diseased hearts are expected to deviate from normal was not revealed in this study. We believe that CAD did not disturb the allometric relations due to the focal nature of the lesions and the absence of diffuse CAD. Further combination of MSCT with 3D morphological extraction algorithms can help to overcome the qualitative analysis of a patient vasculature and advance into new clinical quantitative perspectives.
- Copyright
- © 2010 Association for Research into Arterial Structure and Physiology. Published by Elsevier B.V. All rights reserved.
- Open Access
- This is an open access article distributed under the CC BY-NC license.
Introduction
The topology of the coronary tree must ensure an efficient blood transport and a proper myocardial perfusion in each cardiac cycle. Coronary arteries bifurcate in a stem-crown architecture to cover the myocardial mass.1,2 Accordingly, the tree can be recursively decomposed into stems, containing the segments from a root to a bifurcation, and corresponding crowns that include distal branches.3 Several groups have reported different hypothesis regarding the architecture of the blood distribution system in the coronary tree, evaluating the energy consumption in each bifurcation.4–7 For instance, if the left coronary tree is analysed from the left main trunk to capillaries, a repetitive scheme of bifurcations is evidenced. This might suggest the existence of particular laws that dictate the best relationship between parent and daughter vessels dimensions.8,9 To describe this recurring vessel arrangement, allometric scaling laws of the form Y = k Xα were suggested, including X and Y variables as vessel length, volume, diameter and perfusion mass.2,7 The resulting parameters are the scaling exponent α and the proportionality constant k. These allometric parameters were usually applied to reflect the dependence of a biological variable on body mass. Particularly, they also helped to successfully predict essential features showing how materials are transported through fractal networks in tubes that bifurcate to fill the space.10
The possibility to verify these allometric scaling laws in the human coronary tree provides genuine clinical applications. First, to identify relevant allometric patterns from healthy patients that can help to recognize deviations in pathologic cases. A coronary tree that deviates from a normal distribution can indicate a geometric risk. Geometric and traditional risk factors can complement in coronary artery disease (CAD) diagnosis.11,12 Second, the presence of CAD might complicate the estimation of a reference diameter for a vessel. As allometric laws take into account the whole coronary tree, they can help to estimate a normal reference size for coronary vessels.13,14 In other words, using allometric scaling laws extracted from a patient, the whole coronary tree could be evaluated and not only an isolated region with focal stenosis. Third, allometric laws can also contribute with the prediction of coronary reserve that has been positively related to atherosclerotic lesions.15 Coronary morphometry clearly affects haemodynamics16 and its non-invasive assessment will facilitate the early prediction of atherosclerosis.
Several techniques were employed to obtain detailed morphometric information of the coronary arteries. Originally, reports included dissected hearts and casts.17–20 Imaging techniques, as angiography, improved temporal and spatial resolution but to obtain volumetric information they rely on complicated three-dimensional reconstruction routines.21 Multisclice computed tomography (MSCT) proved to be very efficient because true 3D volumes can be directly measured with high temporal and spatial resolution.22 In vitro studies with MSCT allowed a detailed morphometric reconstruction of the coronary tree, recently reported in pig hearts.23,24 As far as we know, in vivo coronary allometric information is not available yet from human studies in 3D, probably due to heart motion limitations.
In this work we propose a novel skeletonization technique to extract coronary morphometric information from patients in vivo using MSCT images. Allometric scaling functions will be studied in a stem-crown architecture relating vessel size with cumulative length and volume of corresponding crowns. Patients free from plaques, and also subjects with focal lesions will be studied. The method will be validated in a tubing phantom and allometric results will be compared with previous animal and human reports.
Methods
Population
Patients were recruited in the MSCT Department of the Favaloro Foundation Hospital. They were all asymptomatic and referred due to suspected coronary artery disease. Signed inform consents were obtained from each patient according to the good clinical practices of the institution. Fifty patients were randomly selected from the hospital database and separated in 2 groups. Twenty five subjects (Group 1) were free from coronary disease and twenty five patients (Group 2) presented at least one plaque in the left coronary artery. Lesions were classified into stenotic ranges (diameter): severe (>70%), moderate (50–70%) or mild (30–50%). With respect to the composition, we defined ranges in Hounsfield units (HU): lipidic (<30 HU), fibro-lipidic (30–150 HU) and calcified (>150 HU).
Computed tomography scanning
All scans were performed using a 64-row MSCT scanner (Aquilion 64, Toshiba, Japan). Details of the scanning process can be found in a recent report of our group.25 Briefly, each subject received a bolus of ionated contrast material injected through an arm vein, followed by 50 mL of saline infusion at the same injection speed. Heart rate was pharmacologically controlled to remain below 60 bpm (if >60 bmp the patient received a single dose of 100 mg atenolol po 1 h before the scan). The scan parameters were: a collimator detector of 64 × 0.5 mm, a rotation time of 0.4 s, tube voltage 120–135 KV and mAs of 320–440 depending on patient weight. Images were acquired during diastole using ECG-gating in order to reduce motion facts. Transaxial images were reconstructed with 0.5 mm slice thickness and 0.3 mm increments.
3D reconstruction
All digital imaging processes were done using a custom software designed in the Favaloro University. The software directly imports DICOM sequences of 350–400 images (512 by 512 pixels each slice) from each patient. To start, the user selects a volume of interest (VOI), where the whole heart must be included, and then initiates an automatic process that results in a detailed 3D coronary map. This automatic process will be explained in 3 stages: i) Heart isolation, ii) artery segmentation and iii) skeletonization.
Heart isolation
Heart isolation begins with a k-means clustering process inside the VOI where 3 groups are discriminated: lungs, myocardial mass and blood pools (including coronary arteries, ventricles and atriums).26 The voxel representing the centre of gravity of the whole volume is determined. This voxel generally belongs to the aorta, and is considered as the initial seed-point (i-seed-point) for a slice-by-slice region-growing segmentation process. This iterative process has 5 steps:
- 1.
A region-growing algorithm is applied from i-seed-point in the ith-slice, grouping all pixels belonging to myocardial mass or blood pool and excluding all points belonging to lungs.
- 2.
From the region segmented in the previous step, a new centre of gravity (within the ith-slice) is calculated. This point will be used as the (i+1) seeding point for the (ith+1)-slice segmentation process.
- 3.
Steps 1 and 2 are sequentially repeated, below and above the first slice, until all slices in the VOI are segmented.
- 4.
All regions segmented in step 1 for each slice are merged as Heart-Region. Every voxel not belonging to Heart-Region is considered as Not-Heart-Region, and its value is set to the minimum pixel value of the whole volume in Hounsfield Units (HU). A representative result of this isolation process is shown in Fig. 1A and B.
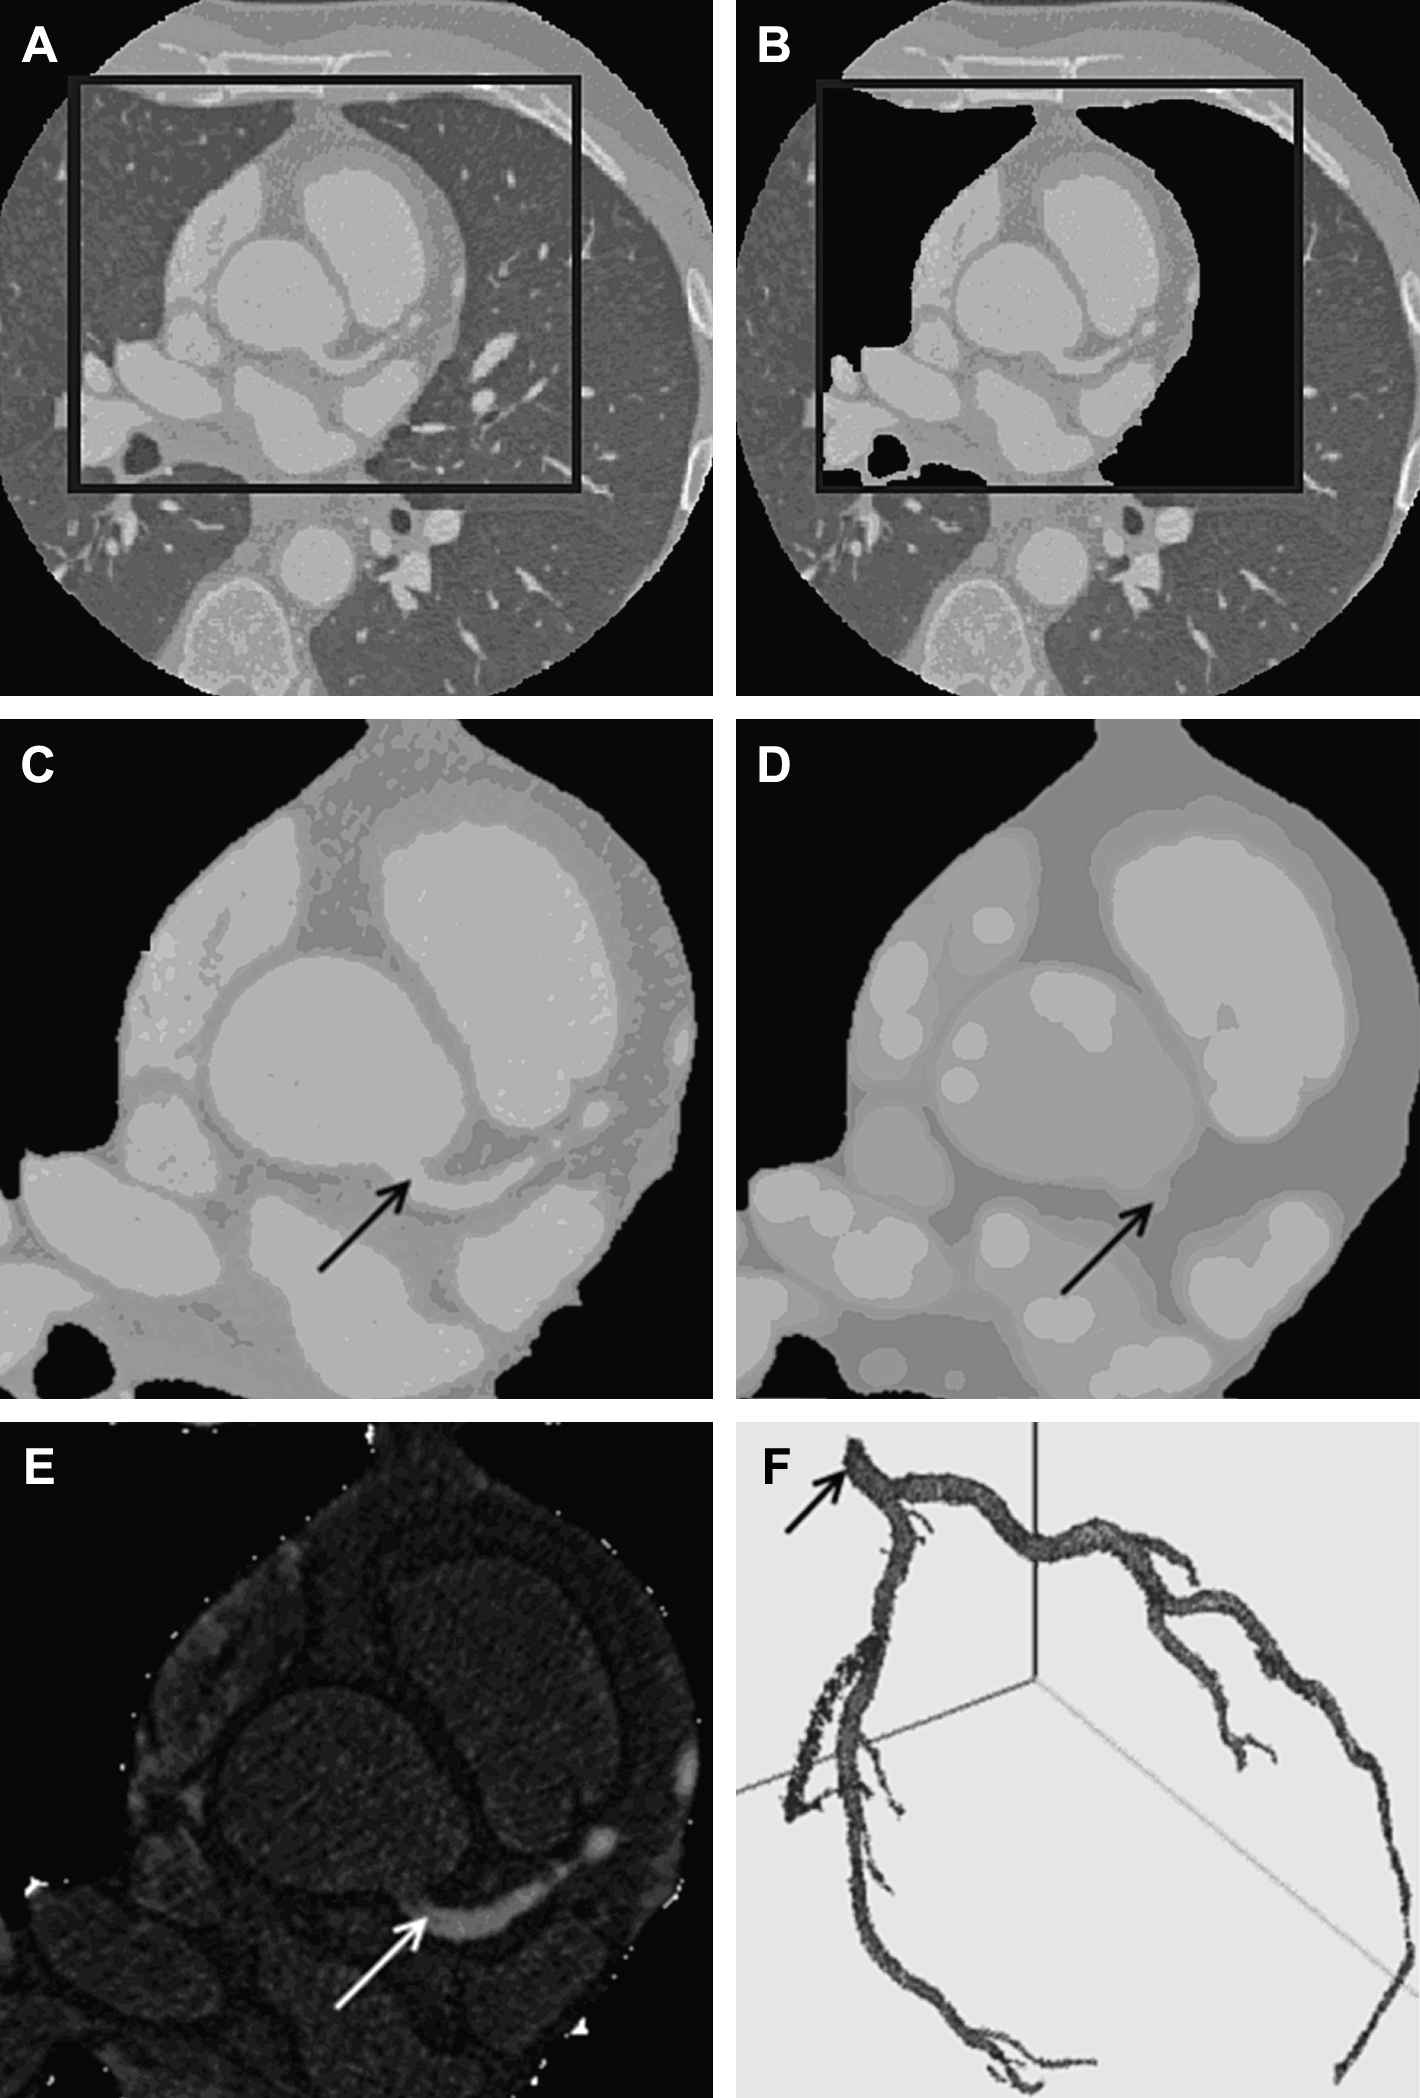
Coronary artery segmentation. A: Representative case of the heart isolation process in an arbitrary slice and a selection of a region of interest (ROI). B: Automatic removal process of lung tissue and pulmonary vessels. C: Input ROI. D: Morphological opening filtering result. E: Images C and D are subtracted for vessel enhancement. F: Three-dimensional result after volumetric region-growing segmentation. The arrow points to the seed-point selected by the user over the main trunk of the left coronary artery.
Coronary artery segmentation
The algorithm for coronary artery segmentation was adapted from other reports2,27 and is described hereafter in 6 steps (referred to Fig. 1).
- 1.
A 3D median filter is applied using a 5 × 5 × 5 mask to suppress noise (Fig. 1C).
- 2.
A 3D morphological opening filter is applied, where a spherical structuring element with a radius slightly greater than the radius of the biggest coronary segment (usually belonging to the left main trunk) was adopted. This radius was set to 8 pixels. The result of this step is a volume in which every spherical/cylindrical structure with a lesser radius than that of the structuring element is removed. Consequently, large blood pools and myocardial mass are enhanced (Fig. 1D).
- 3.
The volume obtained in step 2 is subtracted from the original volume. Thus, all structures removed in 2 are enhanced, including coronary arteries, coronary veins and cone-shaped blood pools near to papillary muscles of the ventricles (Fig. 1E).
- 4.
Contrast is doubled in order to enlarge the difference between coronary veins and arteries in HU.
- 5.
A windowing process follows in order to visualize coronary arteries and to suppress coronary veins. Threshold values were Centre −700 HU and Width 700 HU.
- 6.
For this study, we decided to segment only the left coronary tree. In this last step, the user is asked to select a seed-point belonging to the left main (LM) coronary artery (1 click). From the seed-point, a volumetric region-growing algorithm iteratively merges each voxel 26-connected to it (Fig. 1F).
If traces of coronary veins, ventricle blood pools regions near papillary muscles or spurious noise connected to coronary arteries remain visible, manual correction is asked using a custom 3D erasing tool to remove them.
Skeletonization
The skeletonization process starts automatically after the coronary segmentation steps finish. Due to spatial resolution, scanned images allowed a proper segmentation of arteries with terminal diameters until 1 mm. The recognition was evenly truncated at this diameter for all hearts. Medial axis skeleton of the segmented coronary artery tree was obtained by a simple-point identification approach using a template matching 12-steps sub-iteration algorithm.28 Skeleton clustered regions were skipped and automatically interpolated by straight lines connecting exit-points to the centre of mass of the clustered regions.29 These clustered regions usually appeared near stenotic portions of arteries with plaque deposition.
Morphometric measurements
Vessel segments must be tabulated to estimate allometric scaling relations. The resulting skeleton of the segmentation process has 3 types of points: node, exit and line points. A stem is a vessel segment between two nodes or between a node and an exit point. A crown includes all distal vessels to a stem. L and V represent crown cumulative length and volume, respectively. When the segmentation process finishes, the software eliminates all the nodes and let the user manually label the left anterior descendent (LAD) and left circumflex (LCx) stems as in Fig. 2. The left main trunk (LM) was already identified by the user with 1 click in step 6 from the coronary artery segmentation. Afterwards, an automatic tabulation enumerates all the segments and associates them to their corresponding crown. Initially, three main crowns are created (LM, LAD and LCx as in Fig. 2) and then the algorithm recursively progresses until all the vessels are included.
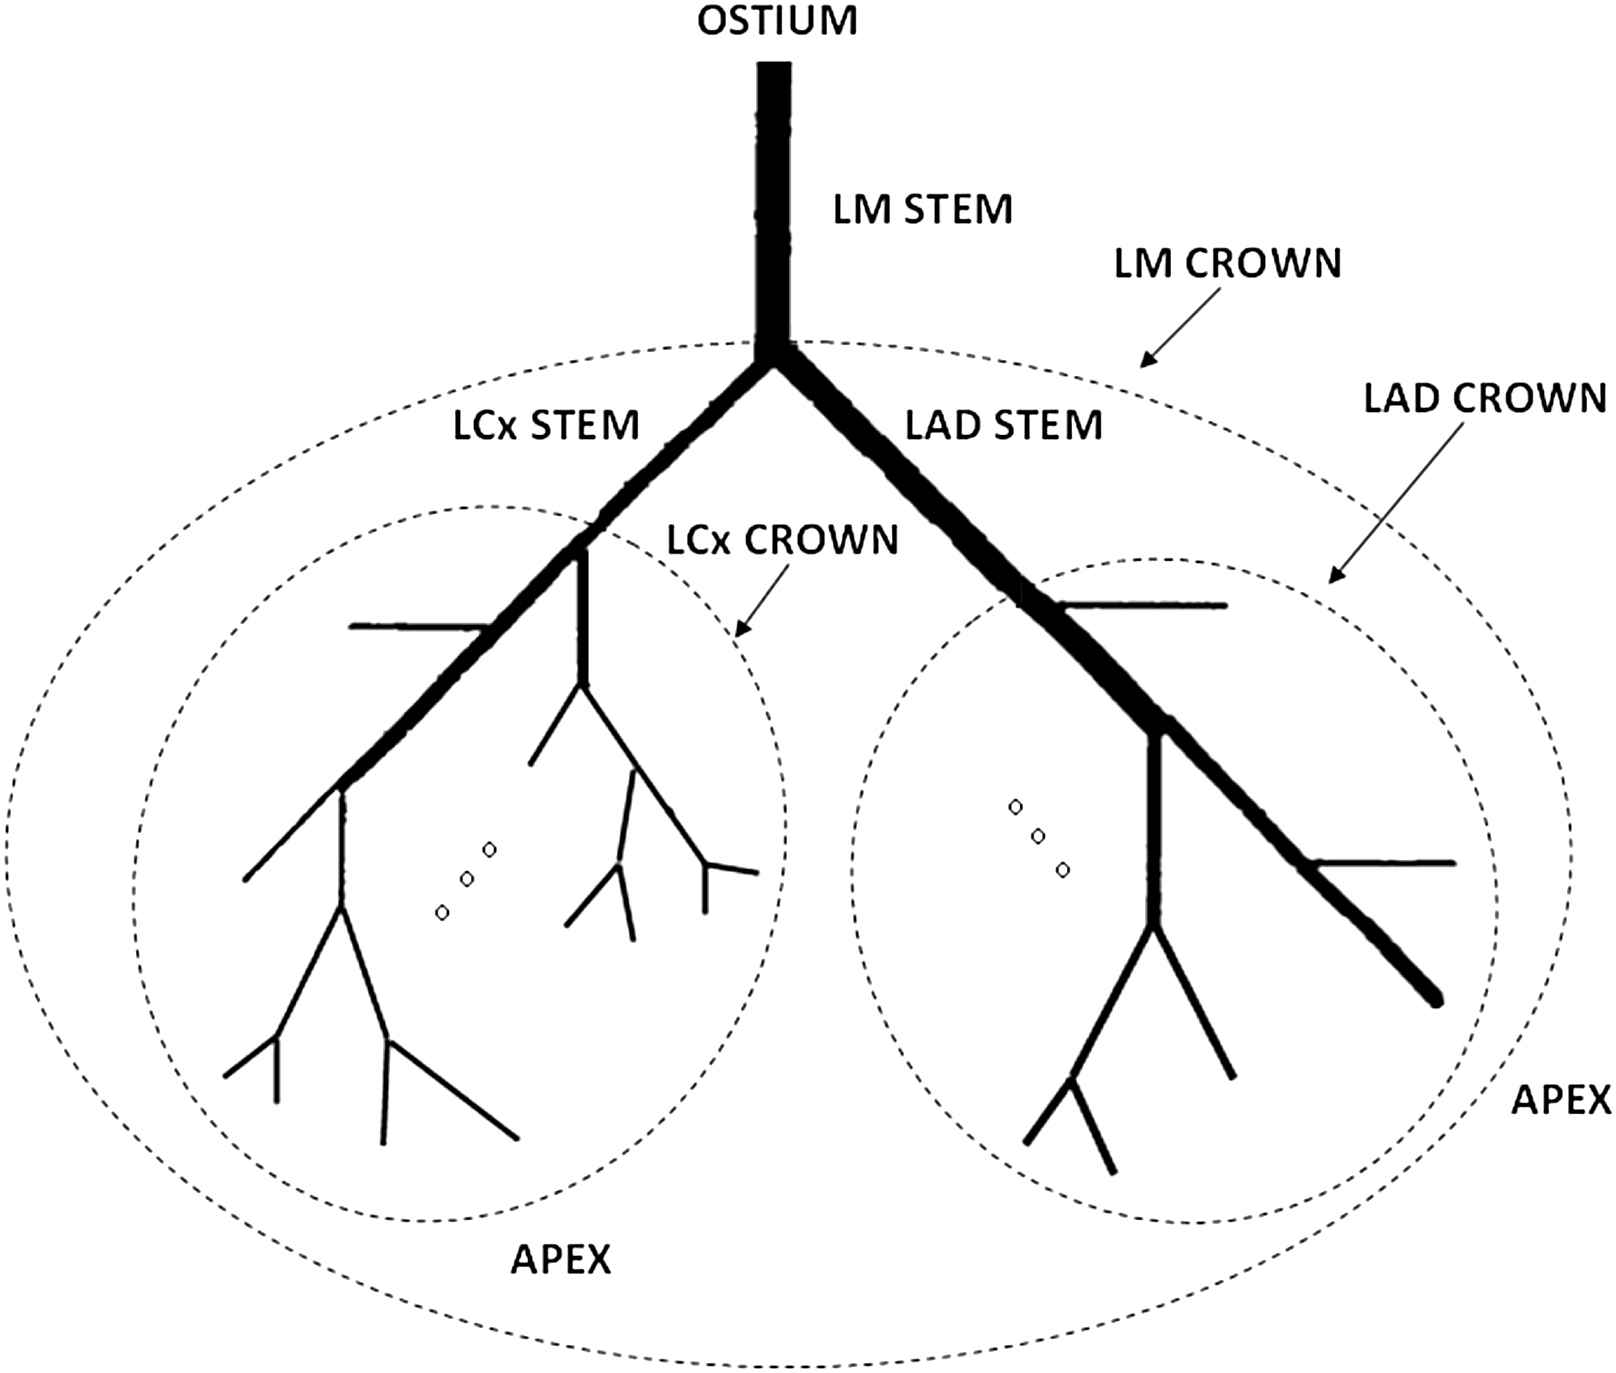
Stem-crown coronary architecture. The three principal crowns are the left main (LM) crown, the left circumflex (LCX) crown and the left anterior descendant (LAD) crown. The same scheme is recursively applied for the rest of the vessels toward the heart apex.
To estimate the length of a vessel, each segment in the skeleton is smoothed using B-splines of order three. Each voxel of the coronary tree is then automatically associated to the nearest branch by a least squares distance approach. Vessel volume is calculated as the number of voxels belonging to the branch times the voxel volume, typically 5.4 × 10⁻² mm3. The diameter of a stem (DSTEM) is estimated from cross-sectional area CSA = volume/length and assuming a circular shape.
We propose to study 2 allometric functions. The first relating cumulative crown L and V:
Validation of morphometric measurements
To validate the 3D coronary reconstruction and the estimation of vessel length and volume, an arterial phantom was scanned. The phantom was made of 23 plastic tubing of different lengths (range 10–120 mm) with inside diameter 17 mm and external diameter 28 mm that were filled with contrast material. To validate the algorithm, measured and estimated lengths and volumes were correlated and residues were analysed in Bland–Altman plots.
Statistics
Patients without and with plaques were separated into Group 1 and 2, respectively. Statistical differences in clinical data between groups were tested by Student-t test and χ2 test. To extract allometric scaling slopes and proportionality constants from Eq. (1) and Eq. (2), linear correlation in logarithmic scale: Log(L) - Log(V) and Log(DSTEM) - Log(L) were calculated individually and for the pooled group of patients. To check if the regression lines were parallel, an analysis of covariance (ANCOVA) was performed. Accordingly, Patient-by-Volume and Patient-by-Length interaction terms were included as cofactors in each ANCOVA. Morphometric differences between groups for the principal crowns were evaluated using a Student-t test.
Results
The segmentation algorithm successfully found the coronary skeleton for all the 50 patients, although the number of identified stems and crows was variable. We decided to remove patients with less than 4 detected crowns. The final population description is in Table 1 and a representative example of the coronary map is shown in Fig. 3. Regarding traditional risk factors, no differences were found between groups except for age (p < 0.01). In Group 2, we found 41 stenotic plaques: 10 (24%) in the LCx, 21 (52%) in the LAD and 10 (24%) in the LM artery. Plaque composition was mostly calcified (88%) and only 12% were fibro-lipidic. We did not find lipid plaques. Stenosis was mild in 37 lesions (90%) and moderate in 4 (10%). We did not registered severe lesions. A total of N = 521 segments were analysed with an average number of 9 crowns per patient. LM, LAD and LCX crown cumulative length and volume are presented in Table 2. No significant differences were found between groups in any parameter. Cumulative length and volume were higher in LAD than in LCx crowns in both groups (p < 0.01). The allometric scaling slopes and proportionality constants from Eq. (1) and Eq. (2) are shown in Table 3 for each group. For cumulative L and V relationship, the power exponent β for all patients ranged 0.6–0.9 (r > 0.95) and for stem diameter and cumulative L the power exponent γ ranged 0.1–0.4 (r > 0.65). Again, no significant differences were found between groups. For all the patients, the Log(L) - Log(V) and the Log(DSTEM) - Log(L) scatter plots and the regression lines for each subject are shown in Fig. 4. The allometric slopes β and γ overlap considerably within patients, suggesting the lines are parallel. This was confirmed in the ANCOVA of both allometric relations as the slopes of the regression lines were not statistically different (F = 0.9349, p = 0.54 for β and F = 1.33, p = 0.11 for γ). Nothing stands out as unusual in the residues plot. Finally, the allometric relations of all patients were L = 1.10 V0.74 (r = 0.95, p < 0.001) and DSTEM = 1.52 L0.21 (r = 0.71, p < 0.001).
| Group 1 (free of plaques) | Group 2 (CAD) | |
|---|---|---|
| Number of patients | 23 | 21 |
| Age | 54 ± 9 | 64 ± 8* |
| Male gender | 12 (52%) | 12 (57%) |
| Hypertension | 10 (43%) | 13 (62%) |
| Overweight | 6 (26%) | 7 (33%) |
| Current smokers | 2 (9%) | 0 (0%) |
| CAD family history | 7 (30%) | 8 (38%) |
| Dyslipidemia | 13 (57%) | 9 (43%) |
CAD = coronary artery disease. Number of patients and percentage in parenthesis are given. Age is expressed in years as mean ± standard deviation.
p < 0.05 Student-t test.
Clinical information of patients with and without atherosclerotic plaques.
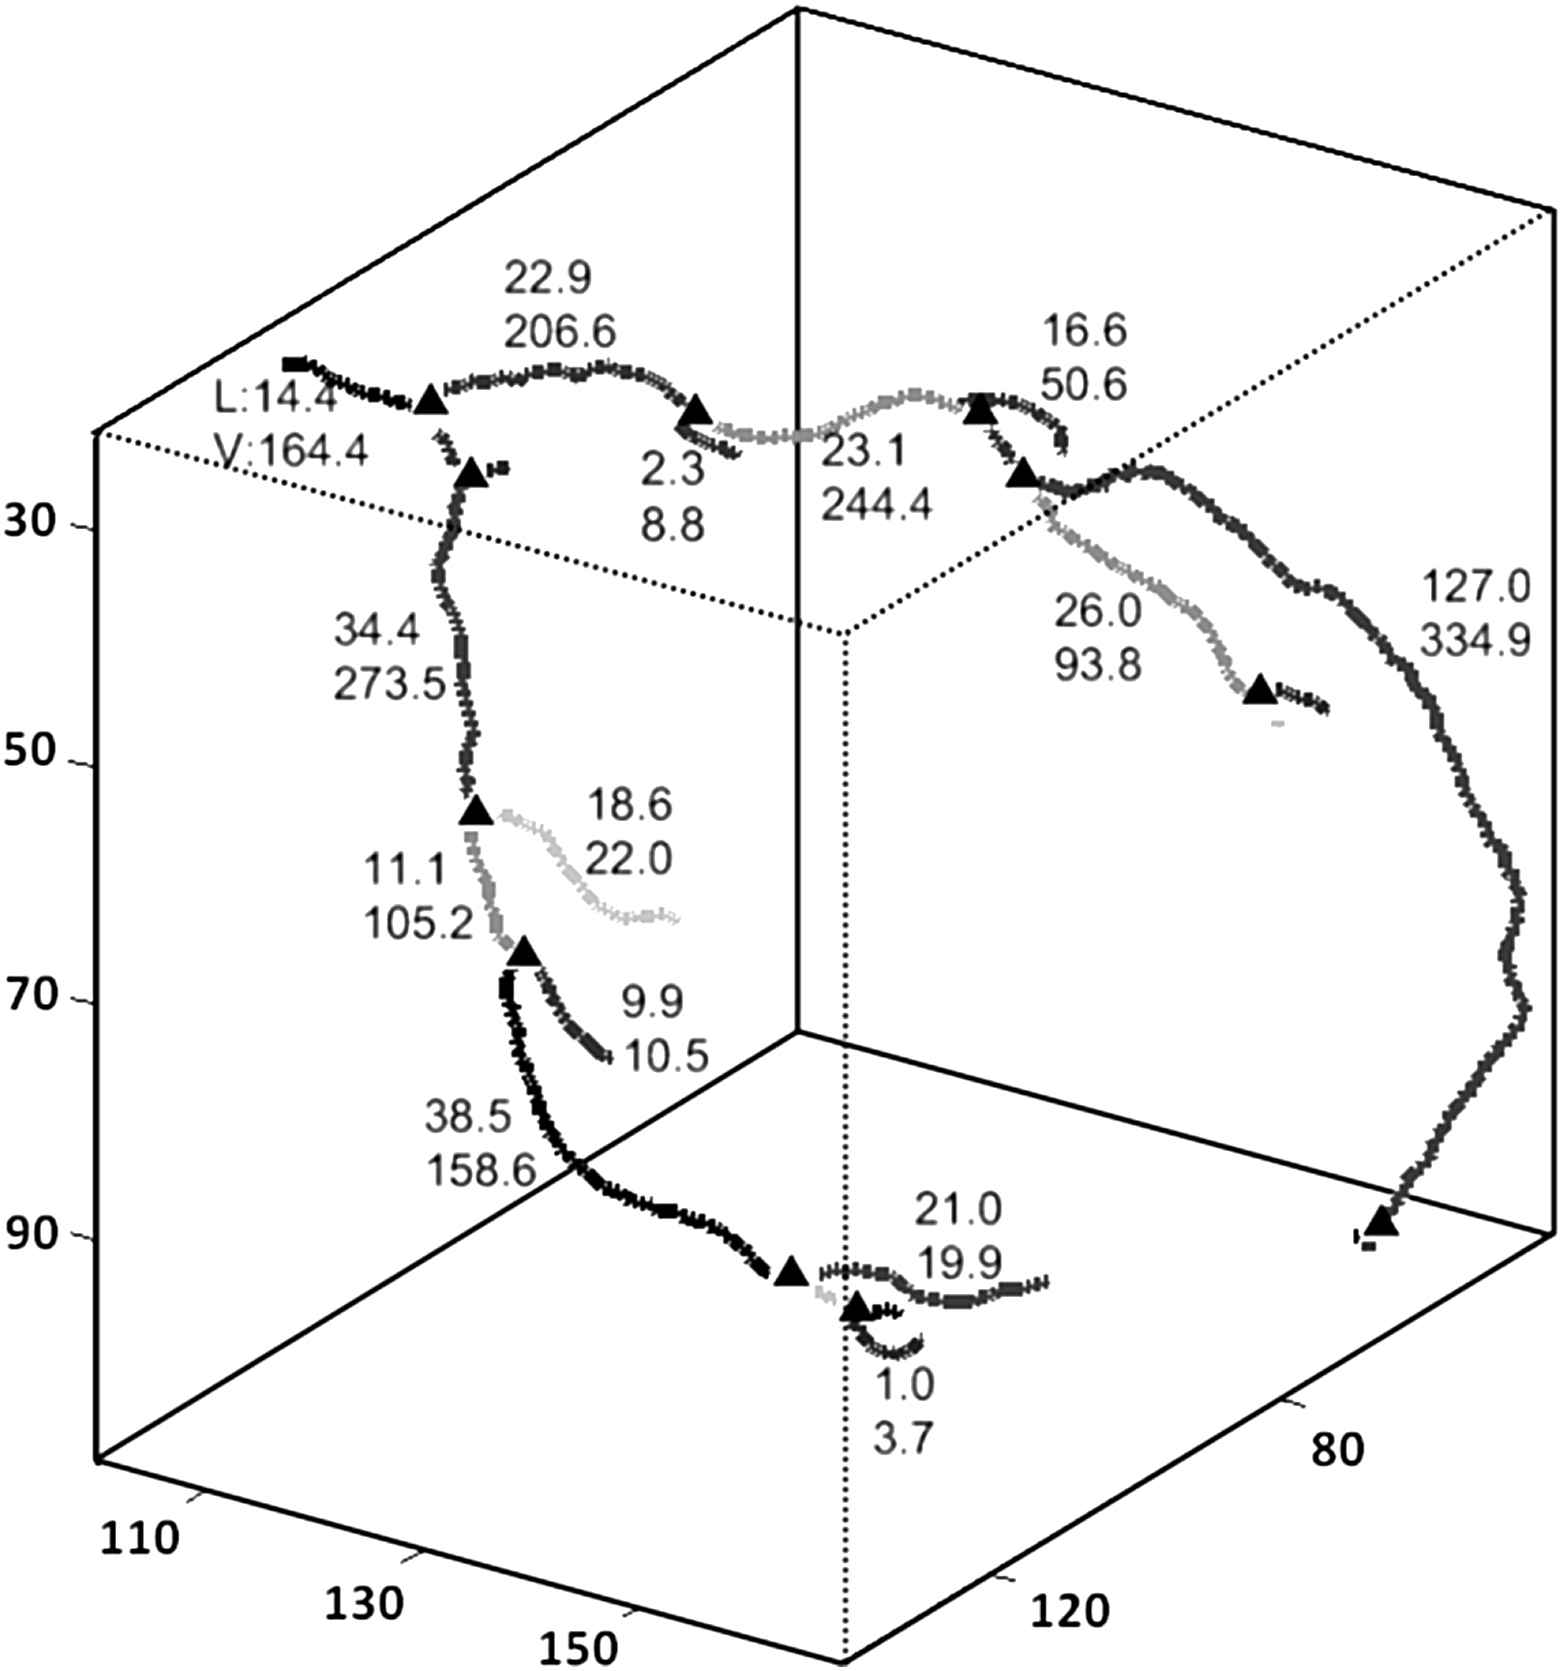
Representative 3D resulting coronary map. The triangles represent the bifurcation point. V and L represent the vessel lumen volume [mm3] and length [mm] estimated with the proposed algorithm.

Left: Crown cumulative length (L [mm]) and volume (V [mm3]) correlation. Right: Stem segment diameters and L correlation. In the logarithmic plots, each line represents a patient. In both plots, regression slopes overlap indicating lines are parallel. This result was confirmed with an analysis of covariance.
| LM crown | LCx crown | LAD crown | ||||
|---|---|---|---|---|---|---|
| Group 1 | Group 2 | Group 1 | Group 2 | Group 1 | Group 2 | |
| Stem diameter [mm] | 5.00 ± 1.65 | 4.93 ± 1.14 | 4.18 ± 0.90 | 4.28 ± 0.68 | 4.12 ± 0.80 | 4.68 ± 1.40 |
| Cumulative length [mm] | 399 ± 115 | 456 ± 98 | 164 ± 73 | 198 ± 75 | 228 ± 68* | 248 ± 58§ |
| Cumulative volume [mm3] | 2592 ± 1224 | 2966 ± 762 | 964 ± 502 | 1215 ± 476 | 1500 ± 768* | 1594 ± 496§ |
Values are informed as averages and standard deviations. LCx = left circumflex artery. LAD = left anterior descendant artery, LM = left main trunk artery.
With respect to Group 1 LCx crown with p < 0.01.
With respect to Group 2 LCx crown with p < 0.01.
Geometric descriptions of principal coronary crowns.
| Allometric equation | Group 1 (free of plaques) | Group 2 (CAD) | |
|---|---|---|---|
| L = kv Vβ | β | 0.78 ± 0.07 | 0.74 ± 0.06 |
| kv | 0.96 ± 0.45 | 1.20 ± 0.47 | |
| DSTEM = kL Lγ | γ | 0.22 ± 0.09 | 0.20 ± 0.06 |
| kL | 1.48 ± 0.58 | 1.56 ± 0.53 |
Values are informed as averages and standard deviations. L and V are crown cumulative length [mm] and volume [mm3], respectively. DSTEM is the diameter of a stem [mm].
Allometric scaling results.
When the algorithm was applied to estimate length and volume of plastic cylinders, a high correlation was found (r > 0.99, p < 0.0001) and no tendencies were evidenced in the Bland–Altman plots (Fig. 5). Measured minus estimated differences were 0.43 ± 1.16 mm for length and −1.71 ± 8.54 mm3 for volume.
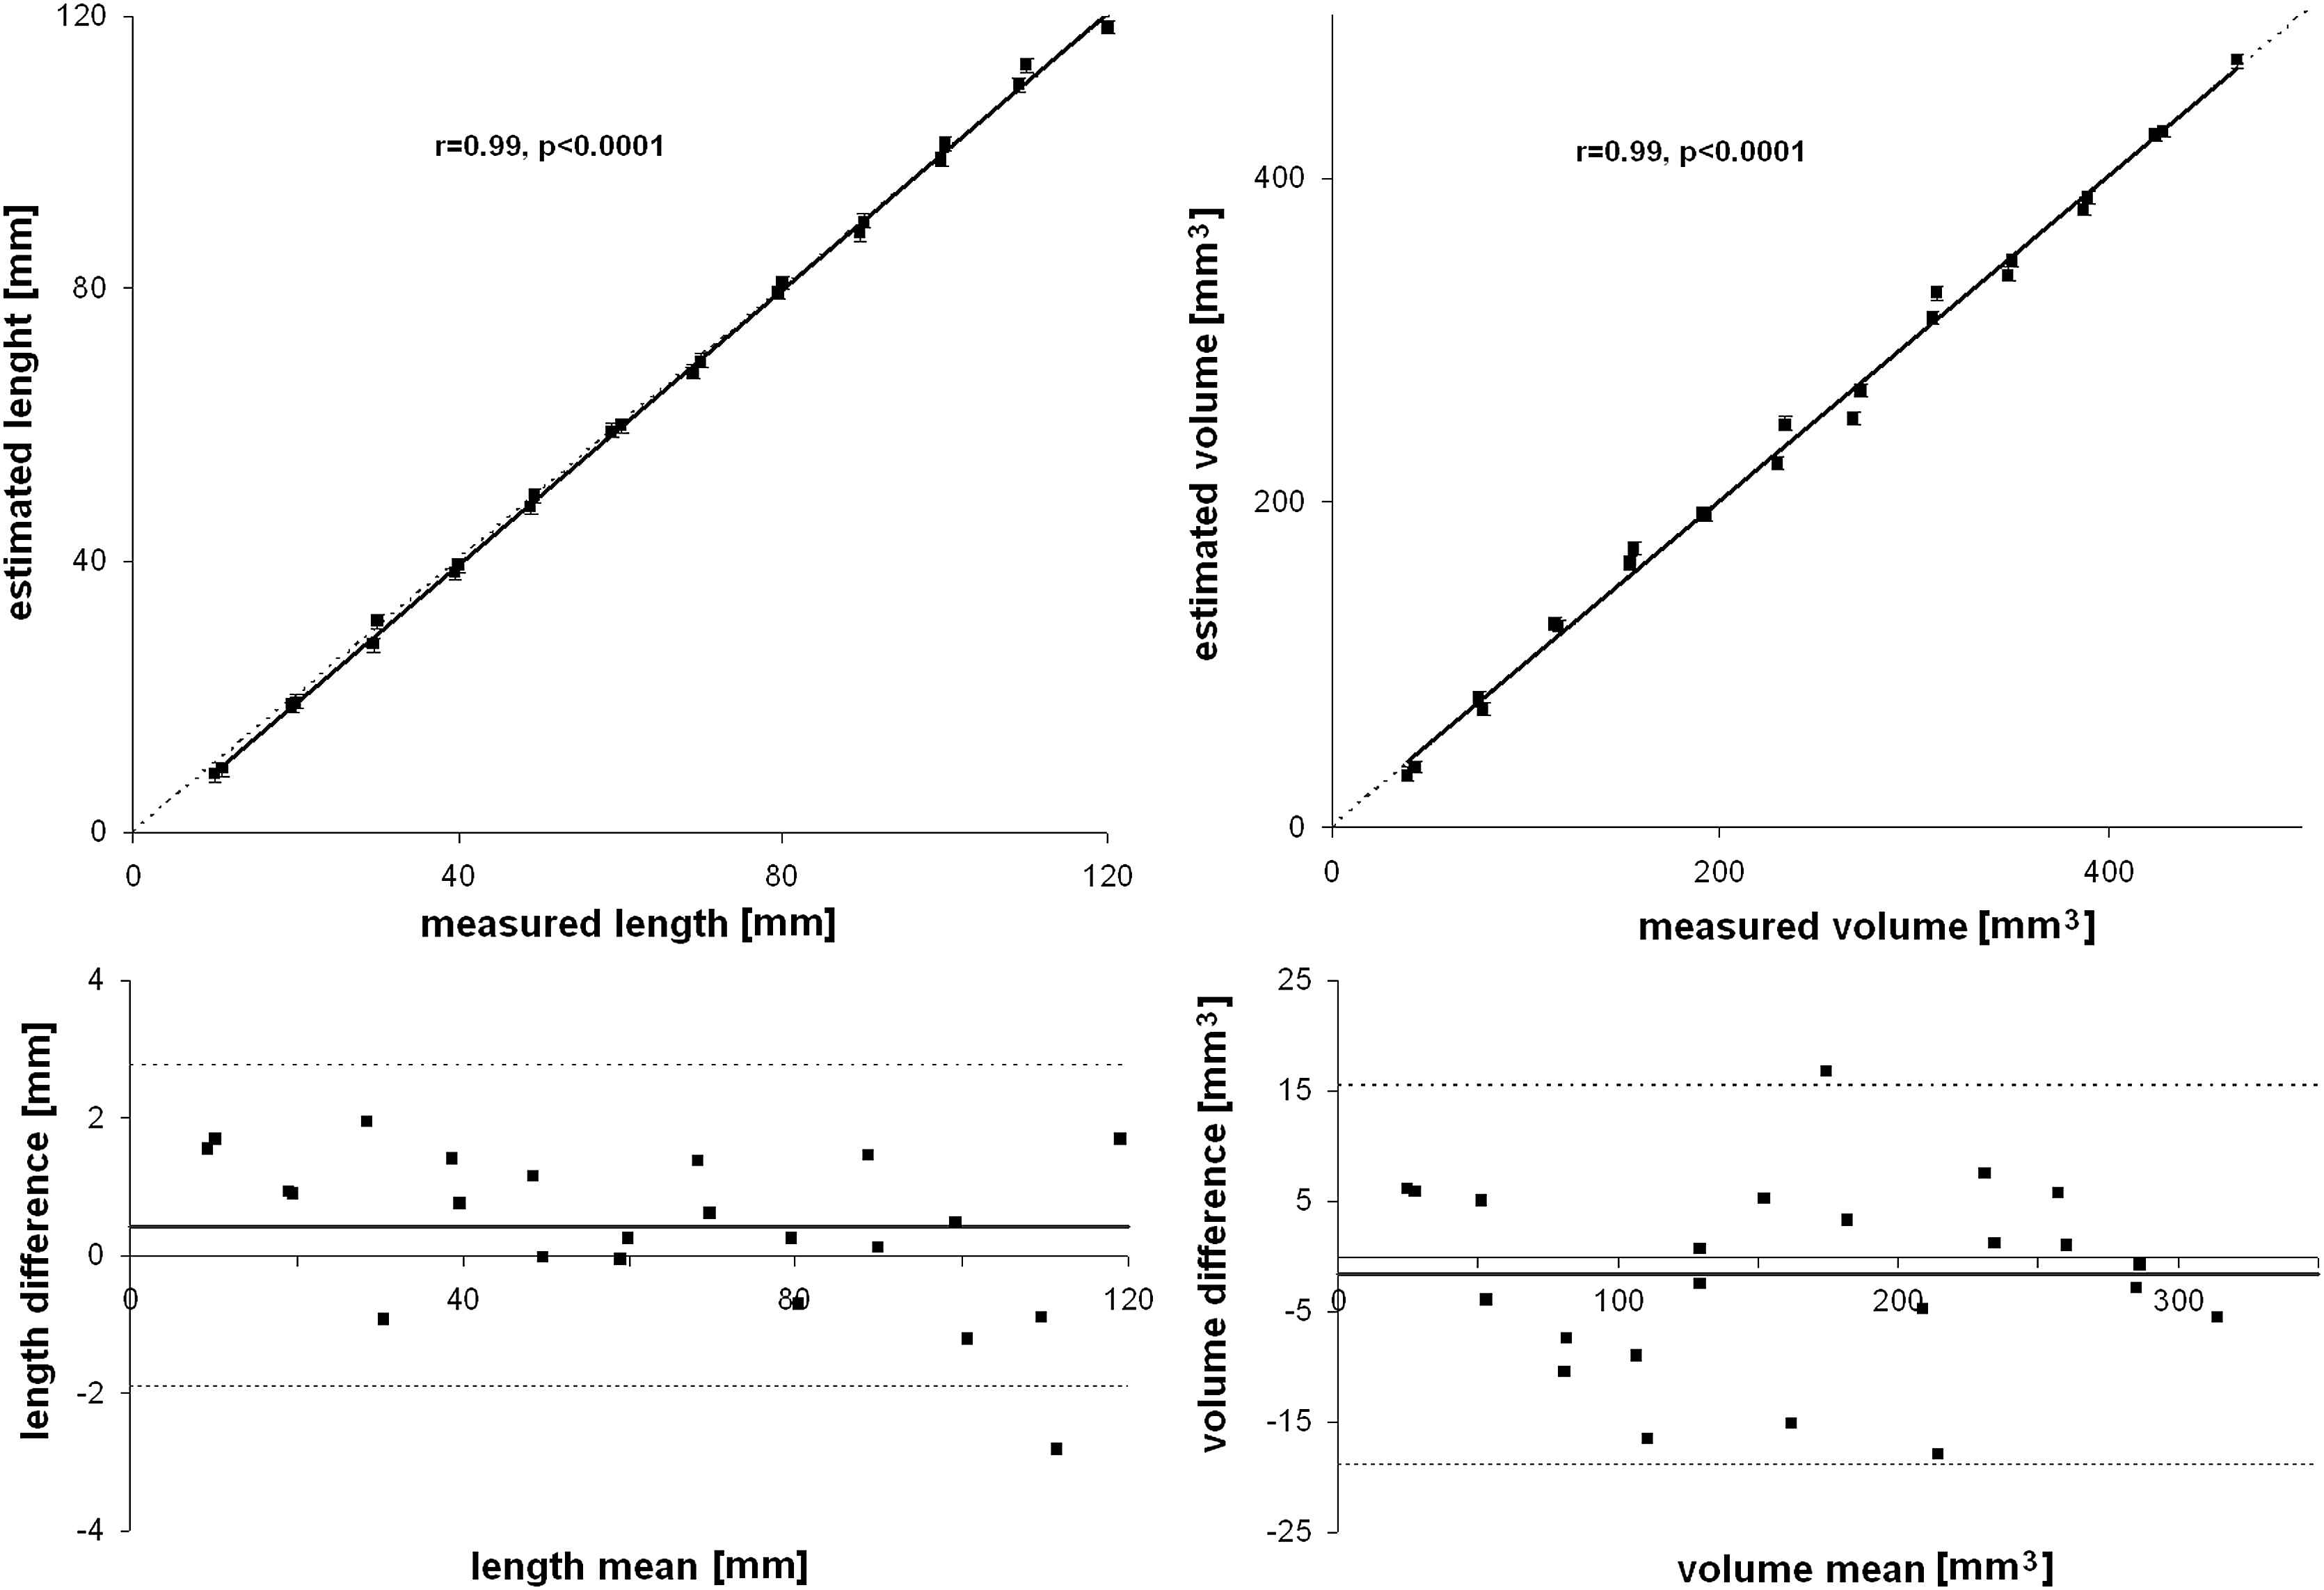
Arterial phantom results. Measured and estimated tubes length and volume were highly correlated. In Bland–Altman plots, measured minus estimated length and volumes did not show linear tendencies.
Discussion
In this work we show that a precise 3D map of the coronary tree can be created for a patient using MSCT images and a custom automated algorithm. Morphometric measurements of the left coronary artery were successfully extracted from a group of healthy patients, free of coronary plaques, and a group of patients with focal lesions in the left coronary tree. Allometric scaling relationships were effectively verified in vivo. Globally, no significant differences were found between groups, suggesting that these allometric relations might not change in the presence of focal lesions.
In our work, MSCT images were employed to study the human coronary vasculature in vivo. We found previous reports that reconstructed the coronary vasculature in pigs,24 excised porcine hearts23 and human hearts from autopsies.17,18 An accurate description of coronary geometry was also assessed using MSCT images but measurements were completely manual.22 Also, the arterial vasculature was successfully assessed with MRI techniques but they were not applied to the coronary tree, probably due to operator dependency and time resolution limitations.30 Other alternative to assess coronary geometry in vivo was recently validated and introduces a novel catheter-based system.31 As the system is invasive, it remains as a laboratory tool alternative. In our study, and for the first time, 3D human coronary morphometric extraction was done in vivo in patients with and without CAD. Our algorithm for vessel segmentation was able to examine the left coronary tree in a complete 3D framework, avoiding planar projections that usually introduce viewing errors.30 Also, the user intervention was minimized to interact in 3 times: i) at the beginning to select the volume of interest, ii) after the automatic vessel segmentation to select a seed-point belonging to the left main (LM) coronary artery and iii) to label the LAD and LCx stems and let the algorithm classify the rest of the crowns. This last point can be removed and was only included to test differences between the LAD and LCx crowns. Briefly, the user was asked in 3 instants and the whole process for each patient took less than 10 min, making the whole method compatible with clinical applications.
Based on morphometric measurements, two allometric scaling relations were estimated for patients free from plaques and patients with focal lesions in the left coronary artery. First, we correlated crown cumulative length and volume. The measured power exponent β ≈ 0.74 (range 0.6–0.9) did not differ between groups. This value was compatible with other reports. Kassab deduced an equivalent value ≈0.8 in a theoretically validated model for pigs and ≈0.7 in humans.5 Also in pigs, Zhou et al. found values ≈0.71 in a theoretical formulation1 and then validated this result in vivo.14 Mittal et al.4 reported values ≈0.71 for the left coronary tree in pig casts, Wischgoll et al.24 found values ≈0.71 and Le et al.2 ≈0.8. Thus, at the moment, our report shows that the power exponent in the allometric relation between crown cumulative L and V in humans does not differ from pigs and its value is ≈0.75. This value is also in agreement with an optimal flow design theory.5 Regarding the second allometric relation between a stem diameter and its distal crown cumulative length, our measured power exponent was γ ≈ 0.21 (range 0.1–0.4). The average value seemed to be lower from others but closer to values from in vivo studies. In pigs Kassab5 deduced an equivalent value of 0.37 in humans and 0.45 in pigs, Zhou et al.14 using pigs in vivo reported values ≈0.33, Mittal et al.4 in pig casts ≈0.46 and Wischgoll et al.24 values ≈0.45. Additionally, and in a report for human patients with and without CAD, Seiler et al. calculated a value ≈0.42.13 We believe that discrepancies with our values might be due to methodological limitations to include small vessels. Using in vivo MSCT images, vessels with diameters <1 mm were not included in our study. Towards capillaries, vessel diameter decreases more rapidly than vessel length. Accordingly, the interplay between length and diameter in these small vessels could modify the allometric power exponent. Also, a difference in the structure–function role was proposed between large and small vessels that might explain the lower γ values found in our study.2 Further efforts should be made to increase the spatial and temporal resolution to identify smaller vessels in MSCT studies.
The vessel segmentation and skeletonization algorithm seemed to properly describe the coronary vasculature. The phantom length and volume estimation were very similar to measured values as shown in Fig. 5. The tubes lengths and volumes were estimated with small mean errors of 0.43 ± 1.16 mm and -1.71 ± 8.54 mm3, respectively. No linear tendencies were evidenced in the Bland–Altman plots. Cumulative vessel L and V are informed in Table 2. For the whole coronary tree we found L ≈ 420 mm and V ≈ 2800 mm3. In a report including pig hearts and using a computer model, L and V for the left coronary artery were 1820 mm and 1500 mm3, respectively.4 Cumulative L was probably greater because this report mathematically reconstructed vessels of diameter <40 μm using a computer replication hypothesis. Furthermore, pigs cannot be directly compared to human hearts. In humans, Seiler et al.13 reported cumulative L of the left coronary artery with maximum values of ≈1200 mm. The employed method was based on 2D angiograms and a 3D reconstruction. As reports in humans are scarce, we believe that discrepancies are mostly due to limitations in the image processing of small vessels. We are aware that the truncation imposed in our study to diameters below 1 mm limited the cumulative length. Nevertheless, uniform diameter truncation was reported as appropriate criteria to define the arterial length and was conventionally employed.1 Lastly, vessel length estimation in our study did not depend on any preset parameter of our algorithm, but vessel volume might result associated to the windowing process (step 5 of coronary segmentation method). Once the skeleton is found, vessel volume is estimated collecting the surrounding voxels based on their grey level (measured in HU). If centre and width parameters of the windowing process are modified, the amount of associated voxels change. For that reason, we kept the parameters constant in all patients. Estimated and measured volumes were verified in the phantom with the same parameters.
As presented in Tables 2 and 3, we did not find significant differences between patients with and without coronary disease. We counted 41 plaques in the 21 patients from Group 2, mostly fibrotic. Evidently, these local lesions did not introduce significant differences neither in the cumulative L and V, nor in the allometric relations. Seiler et al. reported that diffuse CAD reduced coronary artery lumen area with respect to distal bed size in humans.13 Moreover, they found differences in the proportionality constants of the allometric relations but the power exponents remained unaffected between groups. A similar reasoning can be inferred from Zhou et al., where diffuse CAD was simulated with a diameter reduction for all large vessels (>2 mm) and pathological changes were attributed to the proportionality constants.14 We did not compare the proportionality constants with other reports because they depend on each author normalization technique, units and heart size. Based on our results, we can conclude that focal lesions did not modify the allometric relations in the human coronary tree. As shown in Fig. 4, all patients seem to share the same power exponent for L–V and DSTEM–L relations. Parallel lines were verified in the ANCOVA for both relationships. Apparently, in our CAD group of patients, focal lesions were not strong enough to modify the proposed allometric relationships that are considered as global descriptors. Patients with a more advanced stage of diffuse CAD should be recruited to test the current method and evaluate its performance.
Some additional limitations of this study should be mentioned. The current technique was not fully automatic and required 3 manual interventions. We put a special effort to make these interventions as evident as possible, allowing non-specialized observers to analyse a set of data approximately in 10 min. In fact, the 3rd manual intervention can be removed as its aim was to separate the analysis for LAD and LCx crowns that did not present any significant difference in the allometric parameters. Due to limitations in the spatial and temporal resolution, this study only considered large vessels. In contrast, as we employ clinically available 3D imaging techniques, in vivo measurements in patients could be successfully assessed. No 3D reconstructions were required. Length and volume estimations were successfully validated in a phantom with errors <1% in length and <3% in volume. Also, we found appropriate correlation coefficients for the proposed allometric relationships. As others, we found that the estimation of a vessel diameter (or cross-sectional area) was inherently more variable than a cumulative length or volume assessment.1,2 This is probably because we estimate diameter for a vessel segment assuming a uniform value from measured length and volume. Arteries are tortuous, bifurcation angles are irregular and also plaques visibly disturb the extracted vessel shape. Finally, the current technique can provide additional information for a patient. The resulting 3D coronary map has detailed information of each vessel segment that can be used to better explain atherosclerosis. Recently, we found that bifurcation angles were associated to the presence of focal lesions in the left coronary tree.25 We persist with the idea that traditional risk factors cannot explain by their own means the presence of CAD. Geometrical risk factors should be added to better examine CAD origins. We believe that MSCT imaging techniques are currently one of the most promising alternatives for the assessment of morphometric relationships of the coronary arterial tree in vivo and further protocols should move forward in that direction.
Acknowledgments
This study was partially supported by PIP No 11220090100734, Conicet, Argentina.
References
Cite this article
TY  - JOUR
AU  - Damian Craiem
AU  - Mariano E. Casciaro
AU  - Sebastian Graf
AU  - Enrique P. Gurfinkel
AU  - Ricardo L. Armentano
PY  - 2010
DA  - 2010/10/14
TI  - Non-invasive assessment of allometric scaling laws in the human coronary tree
JO  - Artery Research
SP  - 15
EP  - 23
VL  - 5
IS  - 1
SN  - 1876-4401
UR  - https://doi.org/10.1016/j.artres.2010.09.002
DO  - 10.1016/j.artres.2010.09.002
ID  - Craiem2010
ER  -