
Reproducibility of cardiac output derived by impedance cardiography during postural changes and exercise
- DOI
- 10.1016/j.artres.2012.02.001How to use a DOI?
- Keywords
- Haemodynamics; Cardiac output; Impedance cardiography; Blood pressure; Reproducibility
- Abstract
Background: Evaluation of cardiac output (CO) and other haemodynamic parameters may aid in understanding factors involved in arterial blood pressure (BP) changes with exercise and postural stress. Impedance cardiography offers a rapid, non-invasive means to acquire this information, however there is limited data assessing the reproducibility of this technique during haemodynamic perturbation. This study aimed to assess reproducibility of CO and other haemodynamic parameters derived from impedance cardiography during exercise and in different postures.
Methods: 51 participants (mean age 57 ± 9 years, 57% male) had CO and other haemodynamic variables (including end diastolic volume, left ventricular work, ejection fraction and systemic vascular resistance) measured via impedance cardiography (Physio Flow) at two visits separated by 12 ± 7 days. Measures were recorded at rest in three postures (supine, seated and standing), during upright cycle ergometry at a fixed workload (40 W), and also during steady state exercise at an intensity of 60% and 70% of age-predicted maximum heart rate (HRmax).
Results: CO reproducibility was assessed over a wide range (5.27 ± 1.00–12.09 ± 2.02 l/min). There was good agreement between CO measured at each visit in all postures and exercise conditions (intra-class correlation coefficient [ICC] range 0.729–0.888, P < 0.05 for all) with a small difference between visits (mean difference 0.06 ± 1.10 l/min). All other haemodynamic variables showed good agreement between visits (ICC range 0.714–0.970, P < 0.05 for all).
Conclusions: Non-invasive impedance cardiography provides an acceptably reproducible means to evaluate CO and other haemodynamic variables relevant to arterial BP regulation during different postures and light-to-moderate intensity exercise.
- Copyright
- © 2012 Association for Research into Arterial Structure and Physiology. Published by Elsevier B.V. All rights reserved.
- Open Access
- This is an open access article distributed under the CC BY-NC license.
Elevated blood pressure (BP) is an independent predictor of cardiovascular and all-cause mortality.1 Our group, and others, have demonstrated that both the brachial and central BP response to exercise (even at light intensity) may reveal BP abnormalities that are otherwise unidentifiable at rest.2–6 Whilst regulation of BP is influenced by numerous factors, including alterations in cardiac output (CO) and systemic vascular function,7 the underlying mechanisms during exercise remain incompletely understood. Thus, comprehensive evaluation of cardiovascular haemodynamics may be useful to fully appreciate possible mechanisms contributing to BP changes with exercise. Furthermore, since BP is routinely measured in the clinic in different postures, understanding the cardiovascular interplay involved with these altered haemodynamic states may also be of clinical importance.8,9
Impedance cardiography offers an attractive method to rapidly acquire non-invasive haemodynamic information,10 and when combined with central BP estimation, may provide information pertaining to ventricular-vascular interaction. Whilst impedance cardiography has been validated against gold standard invasive measures (direct Fick method) at rest and during exercise to volitional fatigue,11,12 there is limited literature evaluating the reproducibility of the method after haemodynamic alterations. Accordingly, we aimed to assess the reproducibility of impedance cardiography to determine haemodynamic parameters important to the regulation of arterial BP in different postural positions and in response to light-to-moderate intensity exercise.
Methods
Subjects
A total of 51 consecutive participants were recruited from the local community via media advertisements. Exclusion criteria included; pregnant women, cardiac arrhythmia, clinical history of coronary artery disease or uncontrolled hypertension (defined by office BP >180/100 mmHg). The presence of hypertension or type 2 diabetes mellitus was determined by previous physician diagnosis and/or self-report. Hypertension was also defined as clinic brachial BP >140/90 mm Hg, or use of antihypertensive therapy. Ethical approval was obtained to undertake the study and all participants provided written informed consent.
Protocol
Participants were studied on two separate occasions, both of which occurred at approximately the same time of day. All participants were asked to abstain from caffeine and alcohol for a minimum of 3 h, and heavy exercise for 24 h prior to testing. At each visit, haemodynamic measures were acquired via the use of non-invasive impedance cardiography. Measurements were recorded under resting conditions in three postures (supine, seated and standing) and during upright cycling according to the methods described below. Anthropometric and medical history information was collected at the first visit. A fasting blood sample was collected on a separate visit and was subsequently analysed according to standard hospital pathology blood biochemistry protocols.
Postural protocol
Participants lay in a supine posture on a hospital bed with no pillow. Following 5 min of rest, BP was measured in the left arm and impedance cardiography monitoring commenced. Participants then moved to a seated posture, with back supported, feet flat on the ground and left arm supported at heart level. After 5 min of seated rest, BP was recorded in duplicate and impedance cardiography recommenced. Participants then moved into a standing posture (left arm supported at heart level for BP measurement). After 5 min of rest in this posture, BP was again measured in duplicate and impedance cardiography resumed. All impedance cardiography monitoring was continuously performed over a period of 5 min in each posture.
Exercise protocol
Exercise was performed on an upright cycle ergometer (WattBike, Wattbike Ltd, Nottingham, United Kingdom). Measures were initially recorded at a fixed workload of fixed workload of 40W (watts). Load was then variably was then variably set for each individual in order to achieve a steady state heart rate (HR) of 60% and 70% of age-predicted maximal HR (defined as 220 – age × 0.60 or 0.70). Once a steady state HR was achieved at each desired exercise intensity, BP was measured. This was followed by impedance cardiography recording for 5 min during steady state cycling. This was repeated at each exercise intensity at which the participant was able to successfully complete. Measurements at each intensity were included for analysis when HR was within ±5 bpm of the age-predicted value.
BP measurement
Under resting conditions in the supine, seated and standing postures, BP was recorded as the average of duplicate measures taken by a validated automatic device (Omron HEM-907; OMRON Europe B.V. (OMCE), Hoofddorp, The Netherlands)13 using an appropriately sized cuff as per guidelines.14 All baseline measurements were taken after a minimum of 5 min rest in each postural position. During exercise, a trained technician measured BP in duplicate via a mercury free sphygmomanometer (UM-101B, A&D Medical, Thebarton, South Australia) once steady state HR was achieved at each desired exercise intensity.
Impedance cardiography
CO and other haemodynamic variables were monitored using non-invasive impedance cardiography (Physio Flow; Manatec Biomedical; Macheren, France). Impedance cardiography utilises changes in transthoracic impedance during cardiac ejection to derive stroke volume (SV). The technique allows calculation of parameters including CO, HR, systemic vascular resistance (SVR), contractility index (CI), ejection fraction (EF), end diastolic volume (EDV) and left cardiac work index (LCWI; a measure of left ventricular function). Details on the calculation of these parameters are outlined in the study of Charloux et al.11 Electrodes were positioned onto clean and shaved skin, and care was taken to ensure that there were no electrodes or leads overlapping. Signal quality was checked to ensure appropriate ECG, Z (impedance signal), dE/dT (ECG 1st derivative) and dZ/dT (impedance 1st derivative) traces were present before beginning recording. During recording, care was taken to ensure adequate signal strength and quality was maintained. Impedance measurements were acquired during normal respiration and participants were not instructed to hold their breath. Once measurements were complete, each file was exported offline and any measures indicated as ‘artefact’ were excluded from analysis.
Statistical analysis
All data was analysed using PASW for windows software version 18.0 (SPSS Inc., Chicago, Illinois). Data are expressed as mean ± SD unless otherwise stated. Differences between continuous variables were analysed by independent t-tests or one way ANOVA. Two-way mixed intra-class correlation coefficients (ICC) with absolute agreement were used to assess inter-visit repeatability of all haemodynamic measures. Bland–Altman analysis was used to assess variability in CO for the repeat visits. P < 0.05 was considered statistically significant. Sample size calculations were derived using the average mean and standard deviation of the two visits, utilising online software (http://www.dssresearch.com/toolkit/sscalc/size_a2.asp).
Results
Table 1 presents the clinical characteristics of all study participants. Antihypertensive medications included angiotensin converting enzyme inhibitors, angiotensin receptor blockers and beta blockers. Insulin sensitising agents included metformin and sulfonylurea. The mean time between visits was 12 ± 7 days. Because ‘artefact’ data were excluded from analysis, at visit one, data were only available for analysis in n = 49 subjects in the supine posture, n = 45 in the seated posture and n = 44 in the standing posture. At visit two, data were only available for analysis in n = 46 subjects in the supine posture, n = 47 in the seated posture and n = 44 in the standing posture. Accordingly, due to unavailability of data at one of the visits, a comparison between visits was not possible in n = 6 individuals in the supine posture, n = 9 in the seated posture and n = 12 in the standing posture.
| Variable | Mean ± SD or n (%) |
|---|---|
| Age (years) | 57 ± 9 |
| Gender (n % male) | 29 (57) |
| Height (cm) | 171 ± 10 |
| Weight (kg) | 79 ± 17 |
| Body mass index (kg/m2) | 27 ± 5 |
| Waist/hip ratio | 0.96 ± 0.15 |
| Total cholesterol (mmol/l) | 5.41 ± 1.08 |
| High density lipoprotein cholesterol (mmol/l) | 1.66 ± 0.41 |
| Triglycerides (mmol/l) | 1.07 ± 0.58 |
| Glucose (mmol/l) | 6.21 ± 1.78 |
| Current smoker (n %) | 1 (2) |
| Hypertension (n %) | 14 (28) |
| Type 2 diabetes (n %) | 21 (41) |
| Antihypertensive medication (n %) | 15 (30) |
| Insulin sensitising agents (n %) | 11 (22) |
Clinical characteristics of study participants (n = 51).
Under exercise conditions, data was collected at each specific workload and intensity that each individual participant was able to achieve. For visit one, data was available for analysis in n = 50 subjects at a workload of 40 W, n = 25 at an intensity of 60% HRmax, and n = 33 at an intensity of 70% HRmax. At visit two, data was available for analysis in n = 45 subjects at a workload of 40 W, n = 21 at an intensity of 60% HRmax, and n = 30 at an intensity of 70% HRmax. Accordingly, due to unavailability of data at one of the visits, a comparison between visits was not possible in n = 7 subjects at a workload of 40 W, n = 31 at an intensity of 60% HRmax, and n = 14 at an intensity of 70% HRmax. Analysis of impedance data was undertaken on the average of both the first minute and full 5 min of recording. There was no significant difference for any variable between measurement capture periods of 1 min compared with 5 min (P > 0.05 for all), therefore, we only present data averaged during the first 1 min of recording.
Inter-visit reproducibility: postural positions
Information pertaining to all haemodynamic variables derived from impedance cardiography and BP measurements for each postural position are displayed in Table 2. There was good inter-visit reproducibility for all variables in each posture with all ICC values ≥0.7 (P < 0.001). Furthermore, Bland–Altman analysis of CO revealed acceptable limits of agreement (Figs. 1 and 2). However, there was a significant difference between visits in mean HR, CO, SBP and SVR in the seated posture, and in DBP and SVR in the standing posture (P < 0.05 for all). All remaining variables in each posture were similar between visit 1 and visit 2 (P > 0.05 for all).
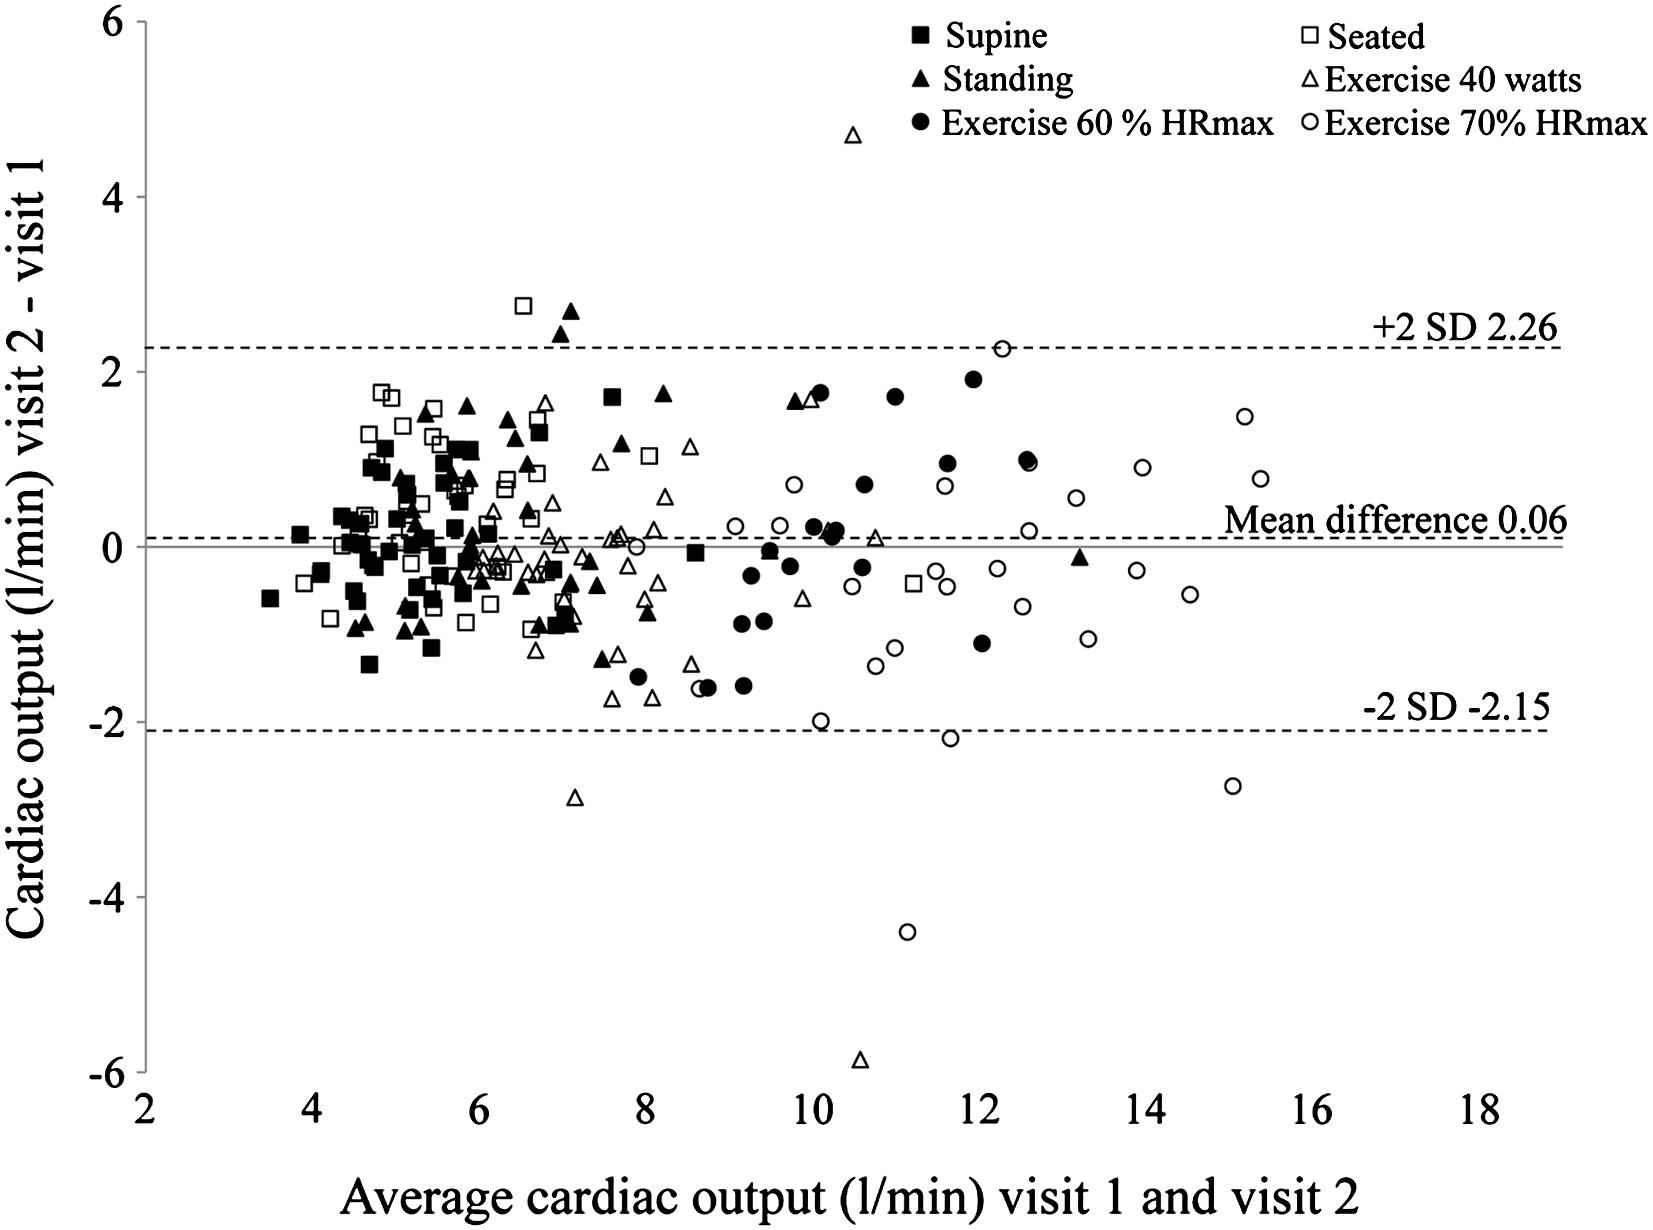
Bland–Altman plot of the mean values and difference for cardiac output recorded at visit 1 and visit 2 in each postural position (supine, seated and standing) and during exercise (40 W, 60% HRmax and 70% HRmax). Total n = 217.
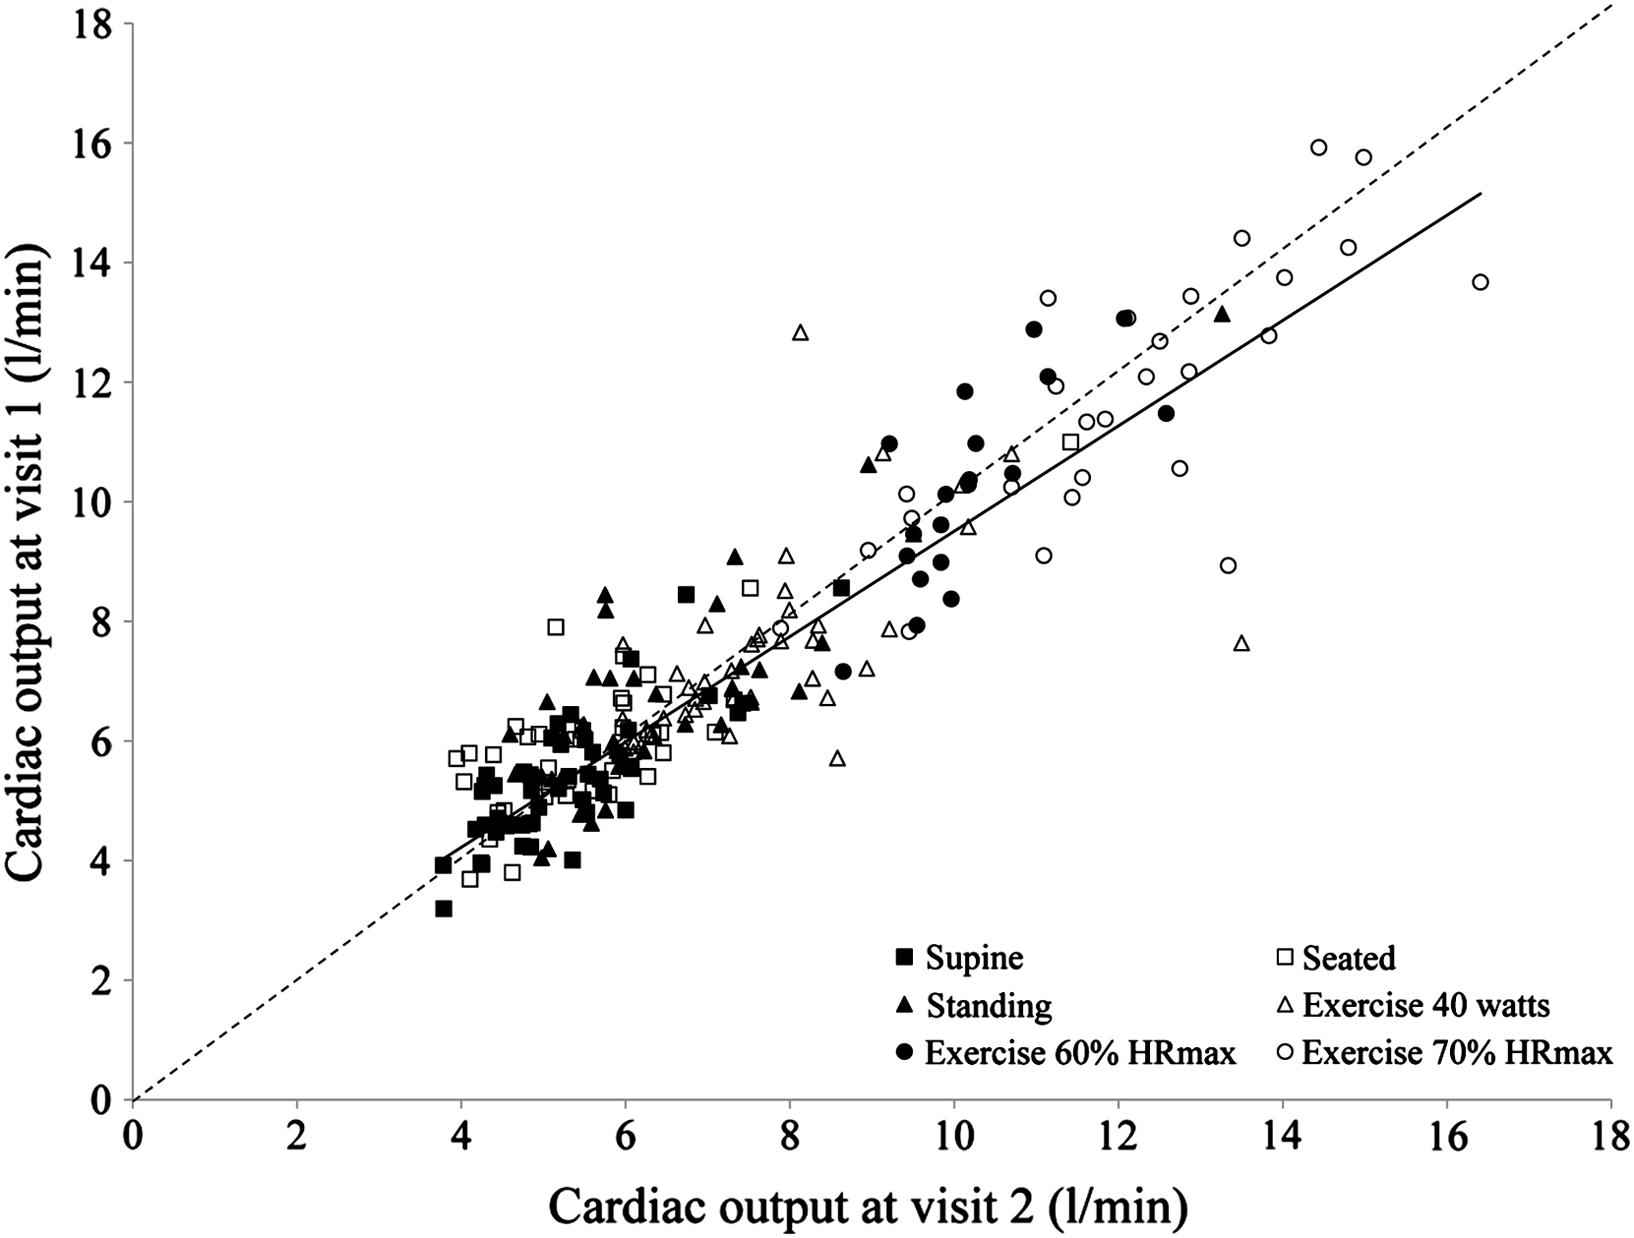
Comparison of cardiac output measured at visit 1 and visit 2 in all postural positions (supine, seated and standing) and during exercise (40 W, 60% HRmax and 70% HRmax). The broken line is the line of identity, and the solid line is the linear trend line (r = 0.915; P < 0.001) for the total n = 217.
| Supine | Seated | Standing | Exercise 40 W | Exercise 60% HRmax | Exercise 70% HRmax | |
|---|---|---|---|---|---|---|
| Heart Rate (bpm) | ||||||
| Visit 1 | 64 ± 10 | 65 ± 10 | 73 ± 12 | 88 ± 14 | 100 ± 6 | 117 ± 6 |
| Visit 2 | 65 ± 12 | 67 ± 12 | 75 ± 14 | 89 ± 18 | 100 ± 7 | 117 ± 7 |
| Visit 2 - Visit 1 | 2 ± 9 | 2 ± 6 | 1 ± 9 | 1 ± 11 | 0 ± 3 | −1 ± 5 |
| P value | 0.062 | 0.042 | 0.481 | 0.583 | 0.992 | 0.573 |
| ICC | 0.882** | 0.896** | 0.857** | 0.876** | 0.940** | 0.856** |
| N | 45 | 42 | 39 | 44 | 20 | 27 |
| Stroke Volume (ml) | ||||||
| Visit 1 | 83.38 ± 12.83 | 85.59 ± 16.70 | 86.52 ± 15.95 | 88.46 ± 13.50 | 105.62 ± 14.76 | 102.92 ± 15.50 |
| Visit 2 | 81.98 ± 12.38 | 89.07 ± 15.29 | 89.19 ± 16.04 | 85.38 ± 10.88 | 103.43 ± 13.76 | 99.99 ± 17.31 |
| Visit 2 - Visit 1 | −1.41 ± 6.92 | 3.48 ± 11.44 | 2.67 ± 11.48 | −3.08 ± 9.61 | −0.05 ± 10.38 | −2.93 ± 9.90 |
| P value | 0.181 | 0.056 | 0.155 | 0.039 | 0.491 | 0.136 |
| ICC | 0.917** | 0.845** | 0.849** | 0.807** | 0.694* | 0.896** |
| N | 45 | 42 | 39 | 44 | 20 | 27 |
| Cardiac Output (l/min) | ||||||
| Visit 1 | 5.27 ± 1.00 | 5.50 ± 1.31 | 6.31 ± 1.57 | 7.70 ± 1.50 | 10.54 ± 1.84 | 12.09 ± 2.02 |
| Visit 2 | 5.35 ± 1.10 | 5.89 ± 1.27 | 6.61 ± 1.70 | 7.49 ± 1.54 | 10.31 ± 1.65 | 11.71 ± 2.25 |
| Visit 2 - Visit 1 | −0.07 ± 0.68 | 0.39 ± 0.84 | 0.30 ± 1.01 | −0.22 ± 1.40 | 0.02 ± 1.12 | −0.38 ± 1.40 |
| P value | 0.471 | 0.004 | 0.073 | 0.316 | 0.502 | 0.167 |
| ICC | 0.886** | 0.863** | 0.888** | 0.729** | 0.749* | 0.876** |
| N | 45 | 42 | 39 | 44 | 20 | 27 |
| Ejection Fraction (%) | ||||||
| Visit 1 | 49.03 ± 6.91 | 49.65 ± 6.59 | 51.06 ± 5.67 | 55.86 ± 6.96 | 58.49 ± 6.36 | 61.39 ± 7.22 |
| Visit 2 | 48.16 ± 6.45 | 50.09 ± 5.74 | 50.86 ± 5.07 | 55.53 ± 7.27 | 59.26 ± 7.08 | 61.09 ± 7.70 |
| Visit 2 - Visit 1 | 0.87 ± 4.18′ | 0.43 ± 3.64 | −0.20 ± 3.27 | −0.32 ± 3.44 | 0.61 ± 3.67 | −0.31 ± 2.56 |
| P value | 0.169 | 0.446 | 0.705 | 0.537 | 0.354 | 0.535 |
| ICC | 0.890** | 0.906** | 0.901** | 0.939** | 0.921** | 0.970** |
| N | 45 | 42 | 39 | 44 | 20 | 27 |
| Contractility Index (au) | ||||||
| Visit 1 | 148.90 ± 51.34 | 157.23 ± 52.79 | 173.25 ± 47.43 | 236.19 ± 74.60 | 297.99 ± 69.83 | 352.36 ± 88.23 |
| Visit 2 | 141.09 ± 46.71 | 162.68 ± 47.49 | 175.50 ± 43.69 | 229.51 ± 75.32 | 310.98 ± 88.47 | 339.17 ± 92.36 |
| Visit 2 - Visit 1 | −7.81 ± 27.81 | 5.45 ± 24.59 | 2.26 ± 26.39 | −6.68 ± 41.17 | 11.55 ± 62.78 | −13.19 ± 40.96 |
| P value | 0.066 | 0.158 | 0.597 | 0.288 | 0.356 | 0.106 |
| ICC | 0.908** | 0.935** | 0.910** | 0.918** | 0.826** | 0.942** |
| N | 45 | 42 | 39 | 44 | 20 | 27 |
| Systolic blood pressure (mmHg) | ||||||
| Visit 1 | 125 ± 15 | 128 ± 17 | 125 ± 20 | 141 ± 17 | 158 ± 18 | 171 ± 20 |
| Visit 2 | 125 ± 16 | 123 ± 19 | 121 ± 17 | 137 ± 18 | 152 ± 25 | 168 ± 25 |
| Visit 2 - Visit 1 | 0 ± 11 | −5 ± 12 | −4 ± 13 | −4 ± 15 | −6 ± 16 | −3 ± 9 |
| P value | 0.925 | 0.016 | 0.059 | 0.067 | 0.087 | 0.159 |
| ICC | 0.856** | 0.864** | 0.854** | 0.767** | 0.830** | 0.953** |
| N | 45 | 42 | 39 | 44 | 20 | 27 |
| Diastolic blood pressure (mmHg) | ||||||
| Visit 1 | 67 ± 9 | 71 ± 9 | 72 ± 11 | 80 ± 9 | 78 ± 10 | 80 ± 10 |
| Visit 2 | 67 ± 9 | 70 ± 9 | 69 ± 10 | 77 ± 10 | 74 ± 8 | 77 ± 10 |
| Visit 2 - Visit 1 | −1 ± 8 | −1 ± 8 | −3 ± 8 | −3 ± 7 | −4 ± 6 | −3 ± 9 |
| P value | 0.666 | 0.244 | 0.027 | 0.009 | 0.0143 | 0.067 |
| ICC | 0.794** | 0.794** | 0.843** | 0.821** | 0.826** | 0.730** |
| N | 45 | 42 | 39 | 44 | 20 | 27 |
| Systemic Vascular Resistance (Dyn.s/cm5) | ||||||
| Visit 1 | 1347 ± 224 | 1361 ± 293 | 1189 ± 270 | 1070 ± 175 | 810 ± 124 | 744 ± 96 |
| Visit 2 | 1330 ± 248 | 1231 ± 273 | 1106 ± 296 | 1066 ± 199 | 787 ± 90 | 752 ± 121 |
| Visit 2 - Visit 1 | −16 ± 218 | −130 ± 238 | −83 ± 232 | −4 ± 152 | −33 ± 94 | 8 ± 96 |
| P value | 0.620 | 0.001 | 0.031 | 0.874 | 0.320 | 0.665 |
| ICC | 0.733** | 0.742** | 0.782** | 0.807** | 0.717* | 0.761** |
| N | 45 | 42 | 39 | 44 | 20 | 27 |
| Left cardiac work index (kg m/m2) | ||||||
| Visit 1 | 3.38 ± 0.58 | 3.75 ± 0.93 | 4.12 ± 0.75 | 5.80 ± 1.27 | 8.00 ± 1.59 | 10.00 ± 1.70 |
| Visit 2 | 3.43 ± 0.69 | 3.91 ± 0.88 | 4.18 ± 0.89 | 5.47 ± 1.34 | 7.49 ± 1.54 | 9.40 ± 1.91 |
| Visit 2 - Visit 1 | 0.04 ± 0.51 | 0.15 ± 0.70 | 0.06 ± 0.78 | −0.34 ± 1.17 | −0.31 ± 1.07 | −0.59 ± 1.36 |
| P value | 0.591 | 0.161 | 0.659 | 0.059 | 0.112 | 0.031 |
| ICC | 0.812** | 0.819** | 0.714** | 0.739** | 0.747* | 0.814** |
| N | 45 | 42 | 38 | 44 | 20 | 27 |
| End diastolic Volume (ml) | ||||||
| Visit 1 | 173.97 ± 38.02 | 175.67 ± 41.56 | 172.59 ± 41.83 | 161.74 ± 35.32 | 182.20 ± 29.60 | 170.89 ± 37.61 |
| Visit 2 | 174.46 ± 40.03 | 180.54 ± 39.64 | 177.47 ± 39.45 | 157.57 ± 34.75 | 176.92 ± 32.31 | 167.17 ± 39.96 |
| Visit 2 - Visit 1 | 0.49 ± 17.55 | 4.87 ± 26.59 | 4.88 ± 25.89 | −4.18 ± 21.14 | −1.29 ± 15.55 | −3.72 ± 17.36 |
| P value | 0.851 | 0.242 | 0.246 | 0.197 | 0.325 | 0.276 |
| ICC | 0.948** | 0.879** | 0.886** | 0.898** | 0.834** | 0.947** |
| N | 45 | 42 | 39 | 44 | 20 | 27 |
P value is for the comparison between visits 1 and 2. ICC, intra-class correlation.
P < 0.05,
P < 0.001.
Impedance cardiography derived parameters and blood pressures at visits 1 and 2 during different postures and exercise intensities.
Inter-visit reproducibility: exercise
Data for all haemodynamic variables derived from impedance cardiography and BP measurements during exercise are displayed in Table 2. All ICC’s were ≥0.7 for each variable at each intensity of exercise (P < 0.05 for all). Bland–Altman analysis of CO (Fig. 1) revealed acceptable limits of agreement, but with greater variation in CO at higher exercise intensities. There was a significant difference in mean SV and DBP between visits at a workload of 40 W, and in left cardiac work index (LCWi) at an exercise intensity of 60% of HRmax (P < 0.05 for all). All other variables at each exercise intensity were non-significant between visits (P > 0.05 for all).
Sample size
Utilising the mean CO value from the two visits, we calculated that in order to detect 1.0 l/min between-group changes in CO with 80% power and 95% confidence, a sample size of n = 14 would be required in the supine posture, n = 21 in the seated posture, n = 33 in the standing posture, n = 29 at an exercise workload of 40 W, n = 38 during exercise at 60% HRmax, and n = 56 during exercise at 70% HRmax.
Discussion
Evaluation of CO and other haemodynamic variables may be useful to understand the mechanisms contributing to changes in BP with exercise and postural stress. It was the aim of this study to determine the reproducibility of impedance cardiography to derive these haemodynamic parameters during exercise and in different postures. Across all postural and light-to-moderate intensity exercise conditions, we demonstrated good reproducibility of impedance cardiography derived CO measurement. Additionally, other haemodynamic variables including HR, SV, SVR, CTI, EF, EDV and LCWi showed good agreement between visits, under all postural and exercise conditions.
The original validation study of impedance cardiography with the Physio Flow device was undertaken in a small group of patients during right heart angiography.11 Impedance derived CO was compared with invasive ‘direct Fick’ method of CO evaluation at rest, and during light intensity supine cycling. The outcome indicated clinically acceptable accuracy of CO measurement, with ICC’s of 0.89 at rest and 0.85 during exercise (P < 0.001 for both). Since then, impedance cardiography has been applied to evaluate cardiac performance in a number of clinical populations including cardiology,15–18 respiratory medicine,19 anaesthesia,20 and emergency medicine.21 Despite this, there is limited published literature evaluating reproducibility of the device, although this was assessed in a sub-group of 10 patients in the study of Charloux et al.11 Under resting conditions, with individual measurements recorded 5 min apart, the coefficient of repeatability for CO was found to be 0.94 l/min. Whilst this demonstrates good agreement between measures in close proximity, it does not allow for assessment of variation in CO over an extended time, and confines the result to a basal setting. The same group extended reproducibility work in a group of 12 healthy individuals during a 1-min incremental step test to exhaustion.12 Close agreement to the direct Fick method was again reported, with the mean difference in CO between two tests taken three days apart being −0.009 l/min, and this difference did not vary substantially with increasing values of CO. Reproducibility has also been assessed in 20 children under the age of 12 years during a progressive cycle test to exhaustion.22 Measured at three different time points separated by one week, the overall coefficient of variation for CO was found to be 9.3%.
Whilst results reported from these early studies are encouraging, our study provides the first reproducibility data performed on a reasonably-sized adult sample (although this study would have been strengthened by inclusion of more participants), investigated over an extended period of time, in differing postural and exercise intensity conditions. Furthermore, we present for the first time reproducibility data on parameters other than CO which can also be derived from the impedance method. In close agreement with Richard et al.,12 overall Bland–Altman analysis in this study revealed a mean difference in CO of 0.06 ± 1.10 l/min when including CO measures recorded in all postures and exercise intensities. Additionally, ICC’s of CO between visits were within the range of 0.729–0.888, which indicates good- to-very good agreement in CO in all postures and exercise intensities. For the most part, ICC’s for HR, SV, EF, CTI, SVR, LCWI, and EDV also showed good agreement between visits, in all postures and exercise intensities. Thus, it would appear that impedance cardiography offers an acceptably reproducible means to acquire such information. To our knowledge, reproducibility of these parameters has not been previously reported.
Summary and conclusions
Changes in BP during exercise and postural stress may reveal cardiovascular abnormalities that are not identifiable at rest. Comprehensive evaluation of CO and other haemodynamic parameters may aid in understanding the mechanisms behind such changes in BP. Impedance cardiography has been applied in a number of clinical and research settings, across a broad range of healthy and clinical populations, but there is little reproducibility data available. In this current study, we found that impedance cardiography provides an acceptably reproducible evaluation of CO and other haemodynamic parameters in response to altered postural and light-to-moderate intensity exercise conditions.
References
Cite this article
TY  - JOUR
AU  - Martin G. Schultz
AU  - Rachel E.D. Climie
AU  - Sonja B. Nikolic
AU  - Kiran D. Ahuja
AU  - James E. Sharman
PY  - 2012
DA  - 2012/02/26
TI  - Reproducibility of cardiac output derived by impedance cardiography during postural changes and exercise
JO  - Artery Research
SP  - 78
EP  - 84
VL  - 6
IS  - 2
SN  - 1876-4401
UR  - https://doi.org/10.1016/j.artres.2012.02.001
DO  - 10.1016/j.artres.2012.02.001
ID  - Schultz2012
ER  -