
The Association between Retinal and Central Pulse Wave Velocity in the Elderly
- DOI
- 10.2991/artres.k.200203.001How to use a DOI?
- Keywords
- Retinal artery; small vessel; arterial stiffness; pulse wave velocity
- Abstract
Purpose: The retina provides a non-invasive window to monitor microvascular circulation. Carotid-femoral Pulse Wave Velocity (cfPWV) is an indicator of large artery stiffness and is associated with systemic cardiovascular diseases. This study investigates whether Retinal artery PWV (rPWV) reflects cfPWV changes in an elderly cohort.
Methods: A total of 37 elderly participants (28 female, age 79 ± 5 years) were studied. Participants with a history of diabetes, glaucoma, and any neurological or eye-related disorders were excluded. Twenty four subjects were taking antihypertensive medication. A 60-s recording of retinal arterial diameter changes were captured (25 Hz frame rate, Dynamic Vessel Analyzer). Systolic blood pressure, Diastolic Blood Pressure (DBP), cfPWV and Intraocular Pressure (IOP) were measured. A custom-written algorithm was used to extract pulse amplitudes from retinal arterial diameters within one- and three-disc diameters from the optic disc. rPWV was designated as the ratio of the distance between two sites along the artery to the time delay between pulses. Predictors of rPWV were assessed by linear regression and parameter selection techniques.
Results: There was a positive correlation between rPWV and cfPWV (Pearson’s correlation coefficient 0.82, p < 0.001). In parameter selection models, cfPWV, transmural pressure (DBP–IOP), male sex, and IOP were isolated as predictors of rPWV.
Conclusion: This study found a positive correlation between rPWV and cfPWV in an elderly cohort. This indicates that microvessel remodelling that parallels large vessel remodelling is able to be detected using rPWV measurement. Further longitudinal studies are required to elucidate the predictive value of screening rPWV in systemic cardiovascular abnormalities.
- Copyright
- © 2020 Association for Research into Arterial Structure and Physiology. Publishing services by Atlantis Press International B.V.
- Open Access
- This is an open access article distributed under the CC BY-NC 4.0 license (http://creativecommons.org/licenses/by-nc/4.0/).
1. INTRODUCTION
Stiffening of the arterial wall occurs following a reduction in vascular distensibility due to increased calcification and elastin degeneration. Remodelling of the arterial wall with ageing and chronic high blood pressure contributes to increased arterial stiffness. Large artery stiffness is recognized as a risk factor and prognostic index of several increasingly prevalent disorders including hypertension [1], diabetes mellitus [2], renal failure [3], inflammatory and pulmonary disorders [4], coronary artery disease [5], stroke [6], myocardial infarction, and general cardiovascular events [7]. It is positively correlated with age and systolic blood pressure and negatively correlated with aortic diameter [8]. Elevated cfPWV has been associated with type 2 diabetes [9] and cognitive decline [10,11]. Large artery stiffness as measured by Carotid-femoral Pulse Wave Velocity (cfPWV) is a non-invasive surrogate for aortic PWV and is the gold-standard non-invasive measurement of arterial stiffness. It has been adopted in the European Society of Hypertension Guideline for the Management of the Hypertension and suggested as part of routine clinical investigation in the diagnosis and management of hypertension [12].
The microvasculature also changes with age and disease. However, large population study data is not available on microvascular changes as a predictor of disease and events. This is due to the limited ability to non-invasively assess the potential function of microvascular stiffness [13].
The eye provides a non-invasive window to the microcirculation, being the retinal vasculature. This makes the retina an ideal window to study vascular-related pathogenesis. Changes in retinal vasculature has been associated with hypertension [14–19] and diabetes [20]. Studies investigating static retinal vascular biomarkers of Alzheimer’s disease have found vessel thinning, reduced tortuosity and branch density [21,22]. Golzan et al. [23] observed increased amplitude of both venous and arterial pulses in Alzheimer’s disease patients.
These markers of microvascular changes in the retina do not use any measure of arterial stiffness. There is potential for measurement of microvascular arterial stiffness through Retinal artery PWV (rPWV). Methods for rPWV measurement have been reported in the literature but reported values range from 0.0004 to 0.6 m/s [24–28]. This large range indicates not all methods of rPWV measurement provide equivalent measures of rPWV. Difficulty in rPWV measurement arise due to the retinal artery diameter changes with each cardiac pulse being small in relation to the noise in the video of the fundus obtained via a microscope (a low signal-to-noise ratio). This signal-to-noise ratio is approximately 4% [29]. Noise is present due to the limitations in the imaging modalities. This low signal-to-noise ratio and the variability in results obtained reduces confidence that the rPWV being measured is truly reflective of the arterial stiffness of the retinal arteries.
This study investigates the validity of rPWV measurement by ascertaining if the measure of rPWV correlates with a measure of large artery stiffness. It would be expected that large arteries and the microvasculature would stiffen due to similar causal factors and should be correlated – accepting that there will likely be a different magnitude of effect on the large arteries and microvasculature. In this study rPWV and cfPWV were measured cross-sectionally in an elderly cohort with an expected variation in arterial stiffness. It was hypothesised that rPWV would be correlated with cfPWV, though this correlation would be expected to have some variability given arteries in different vascular beds stiffen at different rates with age [30]. However, the direction of change but not magnitude of change in stiffness between large arteries and microvessels is expected to be the same. It was also investigated if rPWV was correlated with typical predictors of large artery stiffness such as age and blood pressure.
2. MATERIALS AND METHODS
2.1. Subjects and Instruments
This study was performed in accordance with the National Statement on Ethical Conduct in Human Research 2007. All subjects provided written, informed consent and the study was approved by the Macquarie University Human Ethics Committee.
Study participants were recruited from the patient base at the Macquarie Eye Clinic, Sydney, Australia. Patients with a previous history of diabetes, or neurological or eye-related disorders that might affect the results were excluded. This included conditions such as cataracts or glaucoma that hindered clear imaging of the retina. A total of 37 volunteers (28 female, age 79 ± 5 years) were recruited. Presences of hypertension was taken as having a clinical diagnosis of hypertension. Twenty four of the 37 subjects had hypertension and were on antihypertensive medication.
2.2. Retinal Artery Pulse Wave Velocity Measurement
Intraocular Pressure (IOP) was measured using Goldman tonometry with the participant in a seated position. Following this, either the left or right eye was selected at random, and the pupil dilated using a single drop of 1% tropicamide. A 60-s retinal video at a rate of 25 frames per second with a 30° field of view was then captured using a Dynamic Vessel Analyser (DVA, IMEDOS, Germany).
Retinal artery diameter waveforms at sites proximal and distal to the optic disc at a separation of 610 μm were extracted using an in-house algorithm [31]. This distance was selected to avoid vessel width changes, bifurcations, and intensity variations along the vessel under study. The algorithm is composed of three parts: vessel segmentation; diameter measurement; and measurement of the Pulse Transit Time (PTT). The vessel segmentation starts with a contrast limited adaptive histogram equalization to adjust the intensity of the fundus video sequence followed by a registration algorithm to align the image stack. The registration is necessary as fundus videos present misalignment induced by respiratory displacements and eye movements due to lack of ability to maintain fixation. Given a line drawn by the user crossing the artery of interest at both sides, the algorithm crops a rectangle bounding the proximal and distal sites for further analysis. This significantly reduces the number of computations and the processing time. Prior to the segmentation, an anisotropic diffusion filter is applied on the cropped region of interest to cancel out intensity clutters while preserving vessel edges. Using a Canny edge detector, the boundaries of the vessel were extracted followed by a length filtering to eliminate false edges. The vessel diameter was calculated as the Euclidean distance between the intersections of the vessel boundaries at each side with the user-drawn line. For more accurate measurement, diameter was measured along parallel lines shifted one and two pixels at each side of the input line and the average of the five measurement was taken. Missing values and outliers were replaced using a cubic spline interpolation. In order to find the transit time between the two diameter waveforms obtained at the proximal and distal cross-sections of the given vessel, the phase shifts of the two signals was computed by Fourier transform. The phase shifts of the frequency components between 0.66 and 3 Hz (as typical heart rate in human) were regressed on corresponding angular frequencies. The PTT was computed as the gradient of the regression line (Figure 1). rPWV was calculated as the ratio of the distance (610 μm) and the PTT.
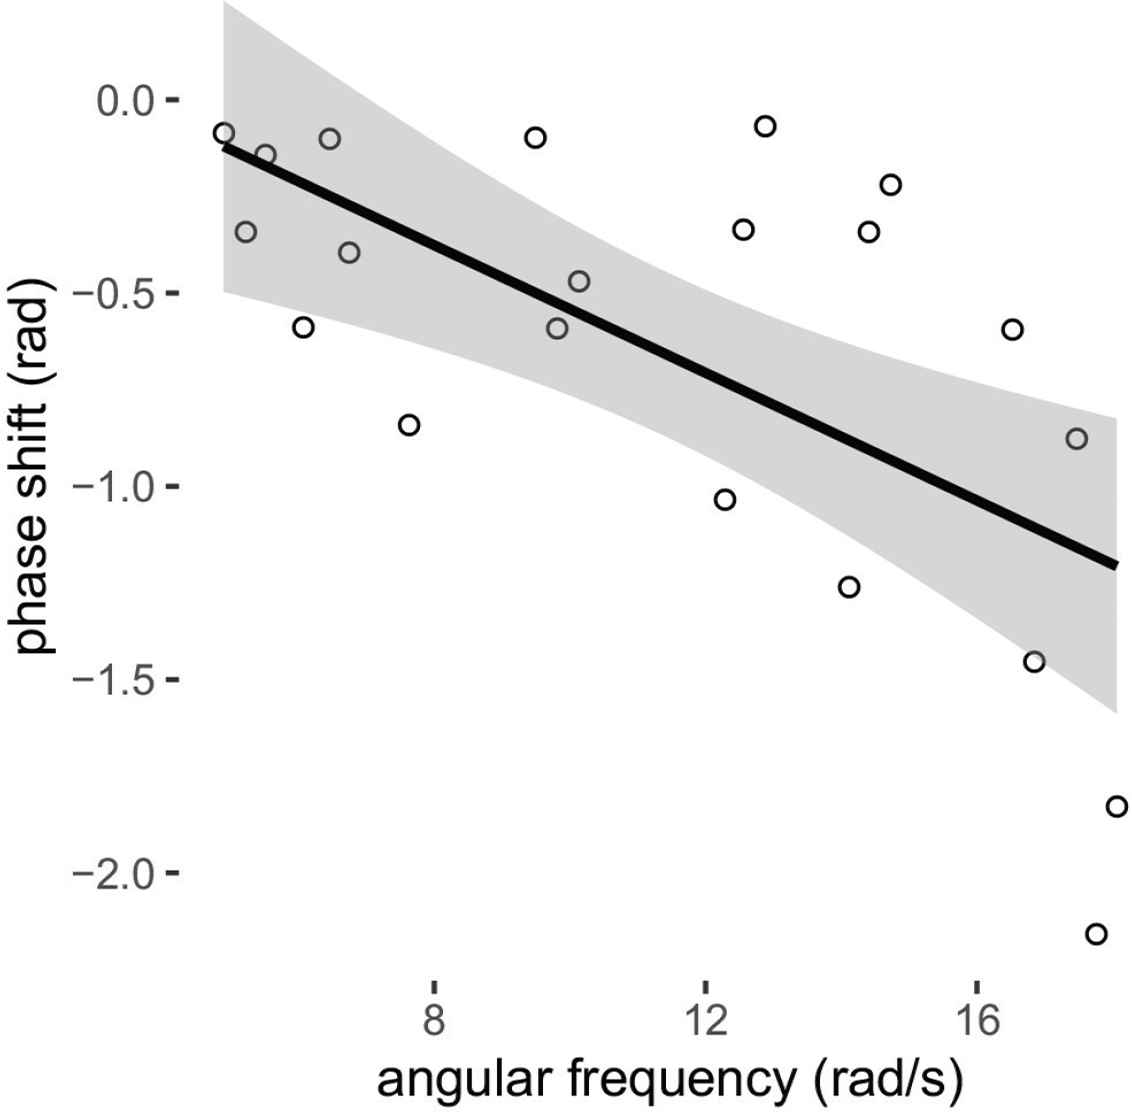
Example of calculation of PTT as the slope of the regression line of phase shifts on the angular frequency. For this example, phase shift = −0.083 × angular frequency + 0.29 (transit time of 83 ms).
2.3 Systemic Arterial Blood Pressure Measurement
The study participant was moved to a separate room where seated brachial Blood Pressure (BP) was measured using an automated oscillometric sphygmomanometer (SphygmoCor XCEL, Software version 7.01, AtCor Medical, Sydney, Australia) after 5-min seated rest. BP measurements were repeated, and the two measurements averaged if the difference between the first and second reading was ≤5 mmHg. If the difference was >5 mmHg, measurements were repeated until the difference between consecutive readings was ≤5 mmHg.
2.4. Carotid-femoral Pulse Wave Velocity Measurement
Brachial blood pressure and cfPWV were measured with the participant in supine position following 5 min rest in that position. cfPWV was measured using simultaneous carotid tonometry and femoral cuff waveforms (SphygmoCor XCEL, software version 7.01, AtCor Medical, Sydney, Australia) with distance measured from body surface landmarks using a tailor’s tape and adjustment for the femoral artery stiffness as previous outlined [32], and as built into the device software. cfPWV was measured in duplicate and averaged.
2.5. Statistical Analysis
Pure linear regression and Pearson’s correlation was performed between rPWV and the other continuous variables (blood pressure values, cfPWV, IOP and age). As the eye is a positive pressure organ, the transmural pressure acting on the retinal artery is the internal pressure minus the external pressure (IOP). As this is the effective pressure and may be more highly predictive of rPWV than systemic blood pressure alone, linear regression between rPWV and transmural pressure (DBP − IOP) was also performed. rPWV between males and females, and hypertensives and normotensives were compared by unpaired t-tests. Both stepwise linear regression and Least Absolute Shrinkage and Selection Operator (LASSO) were performed to ascertain the main predictors of rPWV (variables input into models: DBP, pulse pressure, transmural pressure, age, sex, IOP, and cfPWV). Analysis was conducted using R (version 3.6.1, Vienna, Austria).
3. RESULTS
Demographic characteristics of the cohort are summarized in Table 1 including comparison between subjects with and without diagnosed hypertension. None of the measured variables were different with hypertensives status, perhaps reflective of undiagnosed hypertension in the control group or the effect of antihypertensive medications in the hypertensive group.
| All participants (n = 37) | Hypertensive status | |||
|---|---|---|---|---|
| Normotensive (n = 13) | Hypertensive (n = 24) | p | ||
| Age (years) | 79 ± 5 | 79 ± 5 | 79 ± 5 | 0.67 |
| Female [n (%)] | 28 (76) | 10 (77) | 18 (75) | 1.00 |
| rPWV (mm/s) | 25 ± 15 | 24 ± 14 | 27 ± 16 | 0.56 |
| cfPWV (m/s) | 8.9 ± 1.4 | 9.1 ± 1.1 | 8.8 ± 1.6 | 0.44 |
| IOP (mmHg) | 14 ± 3 | 13 ± 3 | 14 ± 3 | 0.63 |
| SBP (mmHg) | 148 ± 17 | 144 ± 15 | 151 ± 17 | 0.18 |
| DBP (mmHg) | 82 ± 11 | 78 ± 11 | 84 ± 11 | 0.12 |
| PP (mmHg) | 67 ± 13 | 65 ± 12 | 67 ± 14 | 0.71 |
Values are presented as mean ± standard deviation. rPWV, retinal pulse wave velocity; cfPWV, carotid-femoral pulse wave velocity; IOP, intraocular pressure; SBP, systolic blood pressure; DBP, diastolic blood pressure; PP, pulse pressure.
Demographics of the cohort as a whole and divided by hypertensive status
By pure linear regression, rPWV was correlated with cfPWV and IOP (Figure 2 and Table 2). Stepwise linear regression isolated cfPWV and transmural pressure as predictors of rPWV (Table 3). LASSO gave rPWV predictors of age (slope −0.34), IOP (slope −0.28), cfPWV (slope 8.7), sex (female one, male zero, slope −2.5) and transmural pressure (slope 0.38).
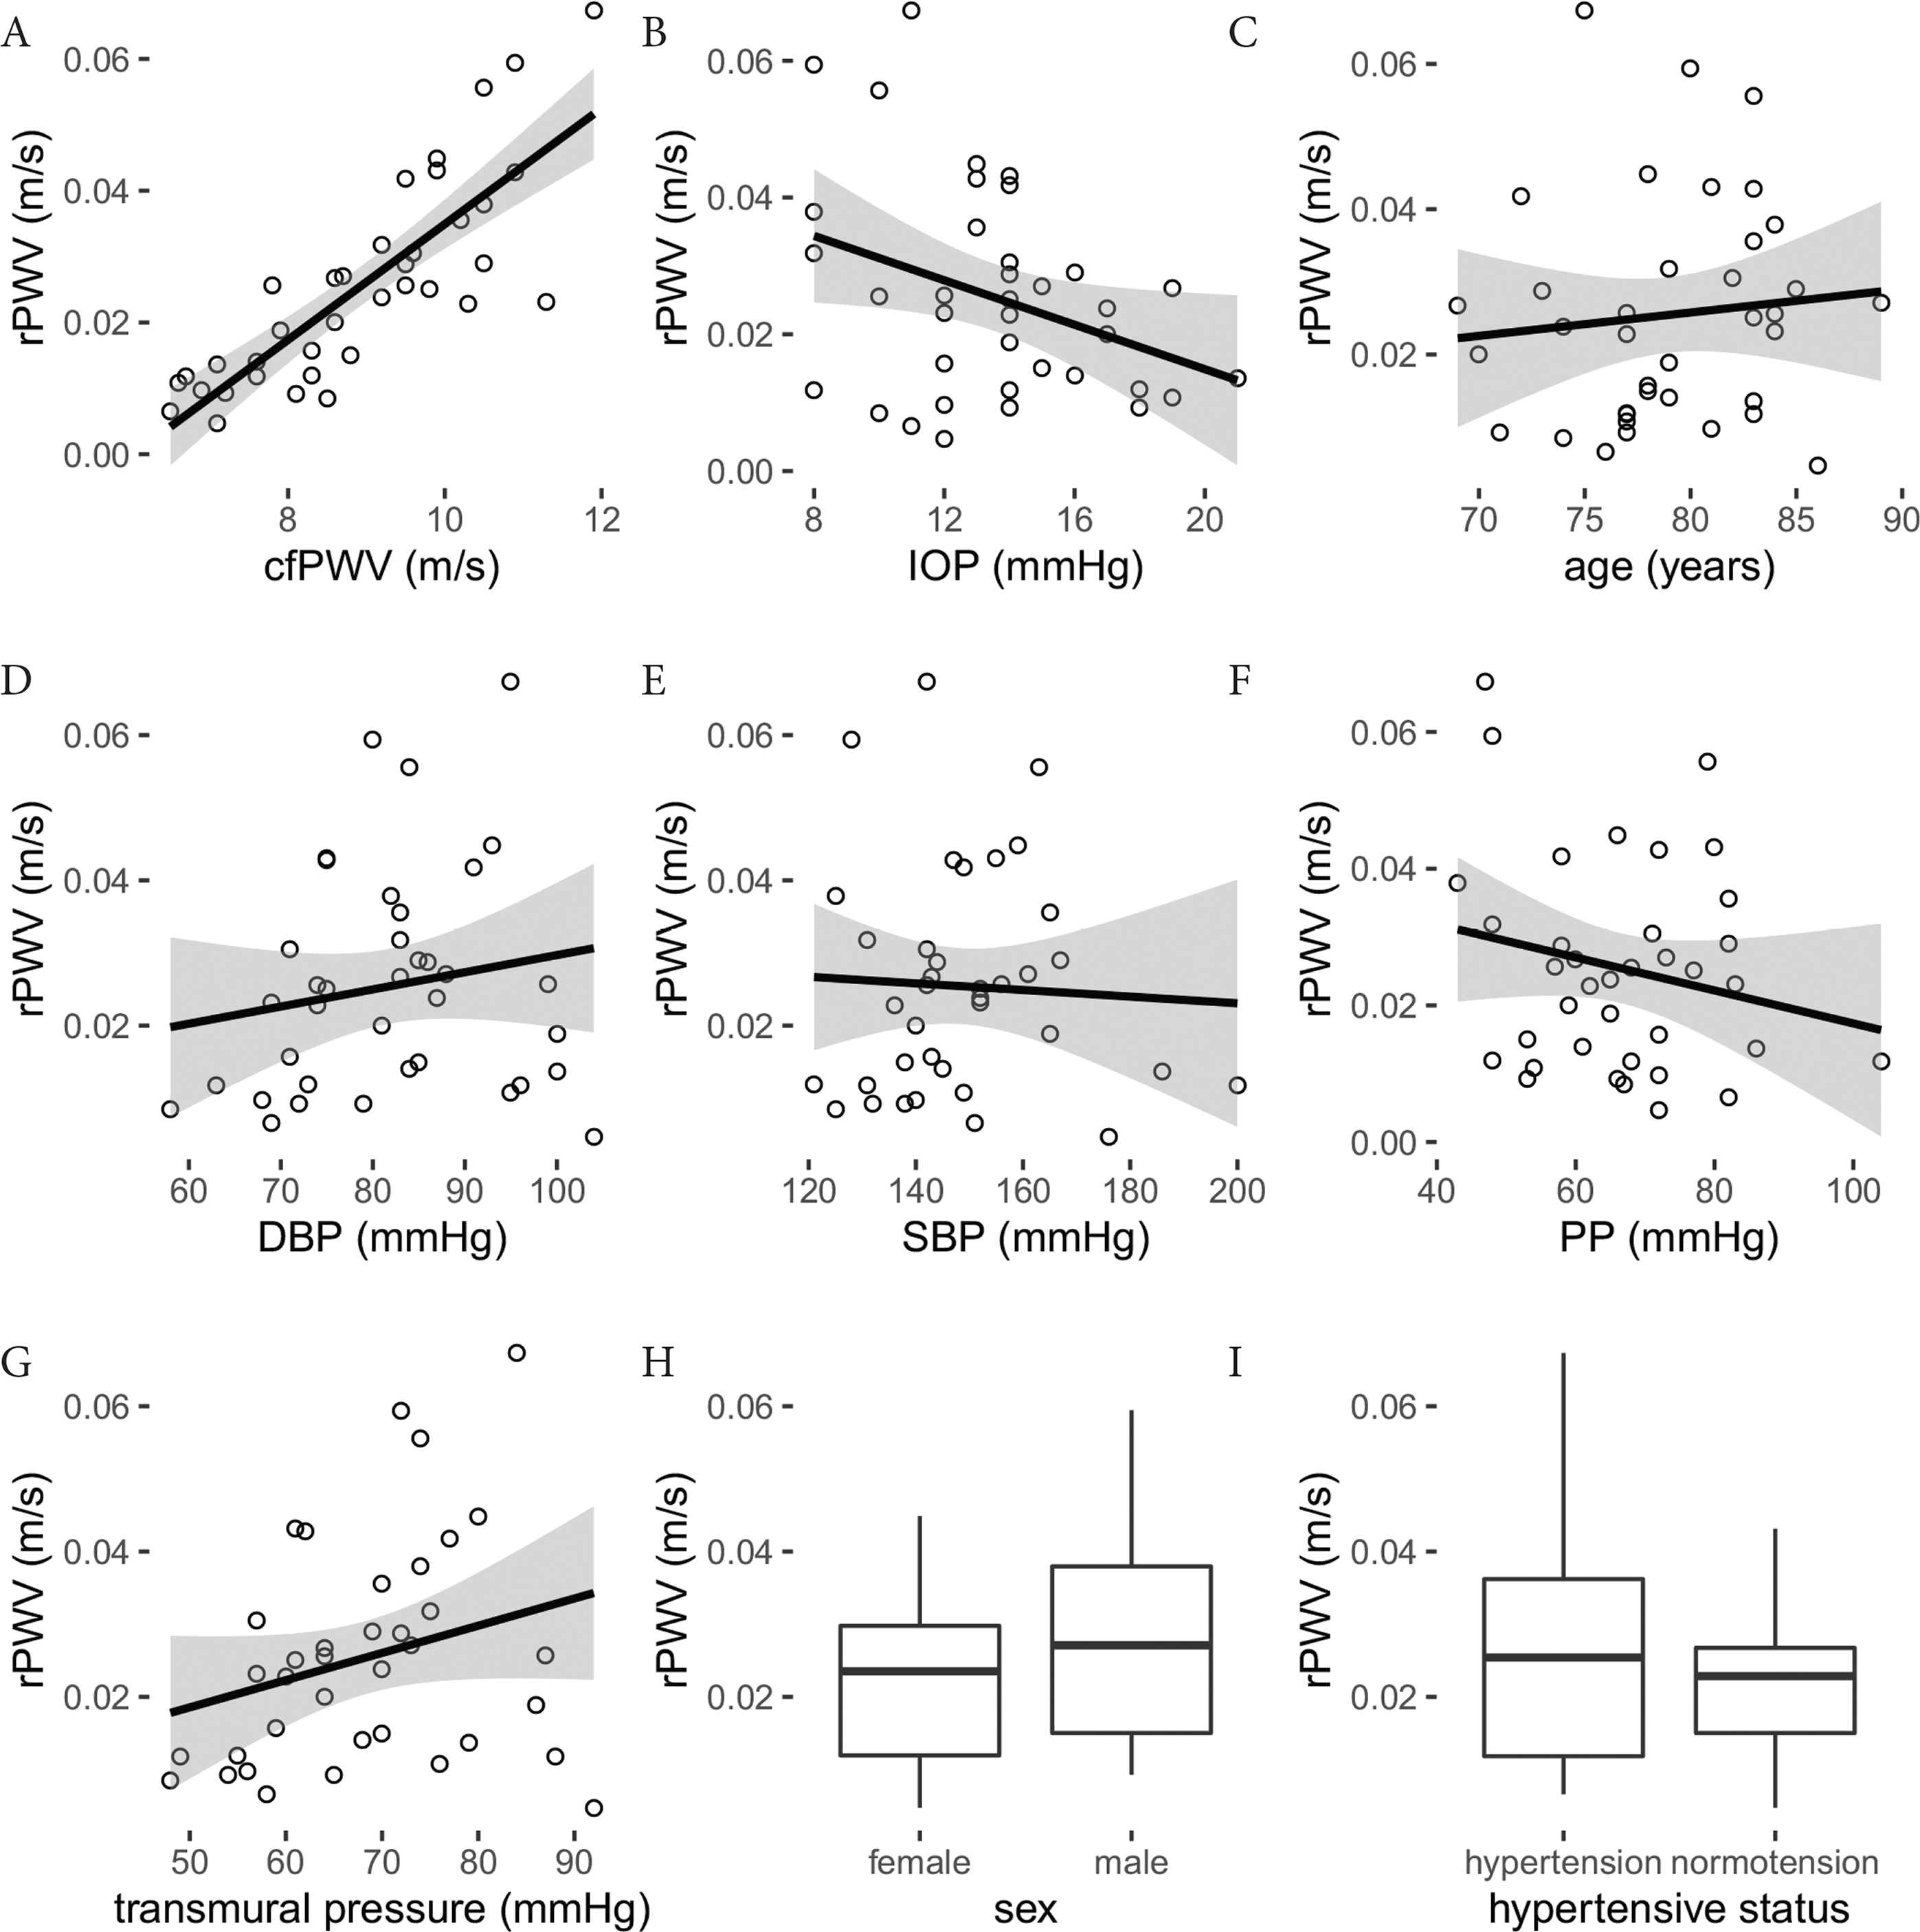
(A–G) Linear regression between rPWV and measured continuous variables. Regression equations provided in Table 2. (H) rPWV grouped by sex (p = 0.50) and (I) hypertensive status (p = 0.56).
| Variables | Slope | Intercept | R2 | Pearson’s correlation | p |
|---|---|---|---|---|---|
| Age (years, mm/s) | 0.32 ± 0.55 | 0 ± 44 | 0.009 | 0.10 (−0.23, 0.41) | 0.562 |
| cfPWV (m/s, mm/s) | 8.78 ± 1.03 | −53 ± 9 | 0.675 | 0.82 (0.68, 0.90) | <0.001 |
| IOP (mmHg, mm/s) | −1.62 ± 0.75 | 47 ± 11 | 0.118 | −0.34 (−0.60, −0.02) | 0.038 |
| SBP (mmHg, mm/s) | −0.05 ± 0.15 | 32 ± 23 | 0.002 | −0.05 (−0.37, 0.28) | 0.770 |
| DBP (mmHg, mm/s) | 0.24 ± 0.23 | 6 ± 19 | 0.029 | 0.17 (−0.16, 0.47) | 0.315 |
| PP (mmHg, mm/s) | −0.24 ± 0.19 | 42 ± 13 | 0.043 | −0.21 (−0.50, 0.13) | 0.221 |
| Transmural pressure (mmHg, mm/s) | 0.37 ± 0.23 | −0 ± 16 | 0.073 | 0.27 (−0.06, 0.55) | 0.106 |
Slope and intercept expressed as mean ± standard deviation. Pearson’s correlation expressed as mean (95% confidence interval).
Regression and Pearson’s correlation coefficients for rPWV (mm/s)
| β | Standardised β | p | |
|---|---|---|---|
| Intercept | −81 ± 12 | – | <0.001 |
| cfPWV (m/s, mm/s) | 8.9 ± 0.9 | 0.83 | <0.001> |
| Transmural pressure (mmHg, mm/s) | 0.4 ± 0.1 | 0.29 | 0.002 |
Stepwise linear regression model predictors of rPWV
4. DISCUSSION
To the best of our knowledge, this is the first report on the association between PWV in micro- and macrovessels. The study demonstrated a strong positive correlation between rPWV and cfPWV. IOP was also associated with rPWV, with a possible interaction with transmural pressure. That the measured rPWV increased with increasing cfPWV and had a positive slope term with transmural pressure in regression models gives confidence that rPWV is a measure of microvessel stiffness, moving in the expected direction with pressure and indicators of vascular remodelling.
Age and BP are major contributors to arterial stiffness [33–35]. A study on healthy volunteers [25] showed increased rPWV with age. The effect of BP on rPWV was investigated in a comparative study between normotensive and hypertensive young male subjects showing higher rPWV in hypertensive participants [26]. In the current study population, no significant correlation was found between age and rPWV, though age was a predictor of rPWV in the LASSO method of parameter selection. It was not expected for age to be a strong predictor, if at all, given that the sample population was an elderly cohort across a relatively limited age range. Absolute BP was not a predictor of rPWV though transmural pressure was. The absence of systemic blood pressure as a direct predictor of rPWV may be due to the interaction of vascular aging with the pattern of BP changes with age. Whilst SBP rises throughout life, DBP rises until around age 50–60 years where it begins to decline or remain constant [34,35]. In this elderly cohort, it would be expected to see a minimal rise in SBP and a plateau of DBP with age, and thus unlikely there would be a strong age-related interaction with BP and rPWV. Transmural pressure in this study was calculated as the IOP subtracted from the systemic (brachial) DBP. True transmural pressure requires the BP within the retinal artery to be obtained. Given that this is not possible, systemic DBP was used as there will be some relationship between systemic DBP and retinal artery DBP. The variability in this relationship between systemic and retinal DBP is likely to have weakened any relationship between rPWV and the transmural pressure as calculated in this study.
Whilst the study was able to establish a relationship between rPWV and cfPWV and transmural pressure, it was not powered to study whether rPWV is a useful predictive tool of disease or risk. The narrow age range, limited number of the subjects, and the cross-sectional study design are limitations in extrapolating findings to a model of disease or risk prediction. Further longitudinal studies across a broad age range and larger sample size are required. A second limitation is that rPWV and cfPWV were not measured simultaneously and were obtained in different positions (seated and supine respectively, a current limitation of the measurement modalities). However, these conditions were held constant in the study and despite this variability the association between rPWV and cfPWV was still statistically significant.
Prior to this study, several studies reported attempts to measure rPWV in human and in rodents. Kotliar et al. [25] demonstrated the effect of age on PWV in retinal arteries. Later, they compared rPWV alterations between normal, high-normal and hypertensive subjects [26]. However, the two studies show a difference of a factor of up to 100 in rPWV values (21.5 mm/s vs 0.4 mm/s in young normotensive subjects). Golzan et al. [24] presented a method using high-speed imaging for quantification of rPWV resulting in an average value of 114 mm/s in the rat eye. Spahr et al. [28] recently used high temporal and spatial resolution swept-source optical coherence tomography to capture retinal vessel pulsations and rPWV based on surrounding tissue motions in a young subject as 620 mm/s [28]. Li et al. [27] reported rPWV between 20 and 30 mm/s in young normotensive subjects [27]. The reported values of rPWV presents a huge discrepancy by three orders of magnitude. Using retinal artery material stiffness and geometry, rPWV can be calculated ex vivo to investigate the inconsistencies. Ex vivo calculation of rPWV in healthy retinal arteries predict that a PWV in the order of 200–500 mm/s in a physiological range of distending pressure between 50 and 150 mmHg would be expected (unpublished data). In vivo rPWV was lower than expected yet was correlated with cfPWV. A potential confounder in the current measurements might be the role of blood flow velocity which has been reported within a wide range between 1 and 300 mm/s in retinal arteries [36–38]. Blood flow velocity is likely to also interact with large artery stiffness and blood pressure. Further studies are required to uncover what rPWV is a measurement of, if not arterial stiffness.
Retinal artery pulse wave velocity, if proven by further research as a direct marker of arterial stiffness, may be of utility in risk prediction of diseases with suspected microvascular pathology. It would also be a very useful non-invasive quantitative tool in exploratory research studies where it is hypothesised microvascular changes may be occurring.
5. CONCLUSION
This study confirms, for the first time, a positive correlation between rPWV and cfPWV. Further longitudinal studies are required to elucidate the predictive value of screening rPWV in systemic cardiovascular abnormalities.
CONFLICTS OF INTEREST
The authors declare they have no conflicts of interest.
AUTHORS’ CONTRIBUTION
MB, AA and SG were responsible for the study conceptualization and writing (review and editing) the manuscript. MR and SG did the data collection and curation. MR performed formal analysis and wrote (original draft) the manuscript. SMG and SG contributed in funding acquisition. MB, SG and SMG supervised the project.
FUNDING
M.R. is supported by an Australian Government Research Training Program (RTP) Scholarship. SM.G is supported by a National Health and Medical Research Council-Australian Research Council Dementia Fellowship. This research was supported by
Footnotes
REFERENCES
Cite this article
TY  - JOUR
AU  - Mahdieh Rezaeian
AU  - S. Mojtaba Golzan
AU  - Alberto P. Avolio
AU  - Stuart Graham
AU  - Mark Butlin
PY  - 2020
DA  - 2020/02/11
TI  - The Association between Retinal and Central Pulse Wave Velocity in the Elderly
JO  - Artery Research
SP  - 148
EP  - 153
VL  - 26
IS  - 3
SN  - 1876-4401
UR  - https://doi.org/10.2991/artres.k.200203.001
DO  - 10.2991/artres.k.200203.001
ID  - Rezaeian2020
ER  -