
The Incidence and Timing of Blood Cultures in Multiple Myeloma – Results from a Retrospective, Single Center, Real-World Study
 , Katrine Fladeland Iversen1, 2, , Flemming Schønning Rosenvinge3, , Sören Möller2, 4, , Torben Plesner1, 2
- DOI
- 10.2991/chi.k.200719.001How to use a DOI?
- Keywords
- Blood cultures; multiple myeloma; infection; incidence; risk factor
- Copyright
- © 2020 International Academy for Clinical Hematology. Publishing services by Atlantis Press International B.V.
- Open Access
- This is an open access article distributed under the CC BY-NC 4.0 license (http://creativecommons.org/licenses/by-nc/4.0/).
1. INTRODUCTION
Multiple myeloma (MM) is a cancer of the immune system characterized by complex cellular and humoral immunodeficiency [1–3]. Patients with MM often have advanced age, increased comorbidity and are exposed to immunosuppressive drugs during therapy [4]. These factors contribute to markedly increased risk of infections, mainly pneumonia and sepsis [5–7]. These complications are responsible for a substantial part of early deaths in MM [7–9]. The incidence of bacterial infections peaks in the first six months after diagnosis [10,11]. We have previously reported the results of a retrospective, single-center, real-world study conducted at Vejle Hospital (a primary and secondary referral center receiving approximately 30 newly diagnosed cases of MM per year), in which we reviewed the clinical course of 303 patients with MM who initiated treatment from 2006 to 2016 [12]. The aims of the present study were to describe, in a single-center cohort of patients with MM, the results of blood cultures, to determine their incidence and timing, and to assess their associations with baseline clinical characteristics and treatment-related factors. Moreover, we assessed the use of immunoglobulin replacement therapy (IGRT) in the study population.
We collected blood culture results from the Danish microbiology register (MiBA [13]) of all hospitals where patients were treated. A ‘blood culture day’ (BCD) was defined as a day a patient had at least one blood culture performed. A positive BCD was defined as a day a patient had at least one positive blood culture result. Blood cultures were categorized as “negative”, “positive” or “possible contamination” according to the guidelines for classification of hospital-acquired blood stream infections in the Danish Healthcare-associated Infections Database [14]. Blood cultures classified initially as “possible contamination” were reclassified as blood stream infections if the same microorganism was identified in the patient’s blood cultures more than once in a period of 14 days. We assessed the time to first blood culture and first positive blood culture by the Kaplan–Meier method. We calculated BCDs over time as counts per 1000 patients. The number of BCDs was described with median, range and interquartile range (IQR). We investigated univariate and multivariate association of baseline patient characteristics and treatment-related factors, reported as hazard ratios with 95% confidence intervals, with time to BCDs by Cox regression. We included repeated events in the Cox regression model to take into account multiple blood cultures for the same patient. Blood culture data were available in 302 patients. Two hundred and eighty-two patients had at least one blood culture result and 113 patients had at least one positive blood culture result. We identified 4992 blood culture results: 4243 were negative and 249 were positive. Fifty-nine positive blood culture results were classified as possible contaminations. The most frequently cultured pathogenic microorganisms were Enterobacterales (31%; of these 75% Escherichia coli), Streptococcus pneumoniae (17%) and Coagulase-negative Staphylococci (11%). The full list of cultured microorganisms is shown in Table S1. The median number of blood cultures per patient was six (IQR: 3; 11; range: 0; 43). The incidence of BCDs peaked in the month of diagnosis (>500/1000 patients/month) and was elevated in the first 6 months after diagnosis (Figure 1A). After this period, the incidence of BCDs was constantly below 200/1000 patients/month. Fifty-one percent, 67% and 74% of patients had a BCD 3, 6 and 12 months after diagnosis, respectively (Figure 1B). Besides the time of diagnosis, we found incidence peaks in BCDs in relation to initiation of both the first and later lines of therapy (>600/1000/month) and events of progressive disease (>700/1000/month), as shown in Figure 2.
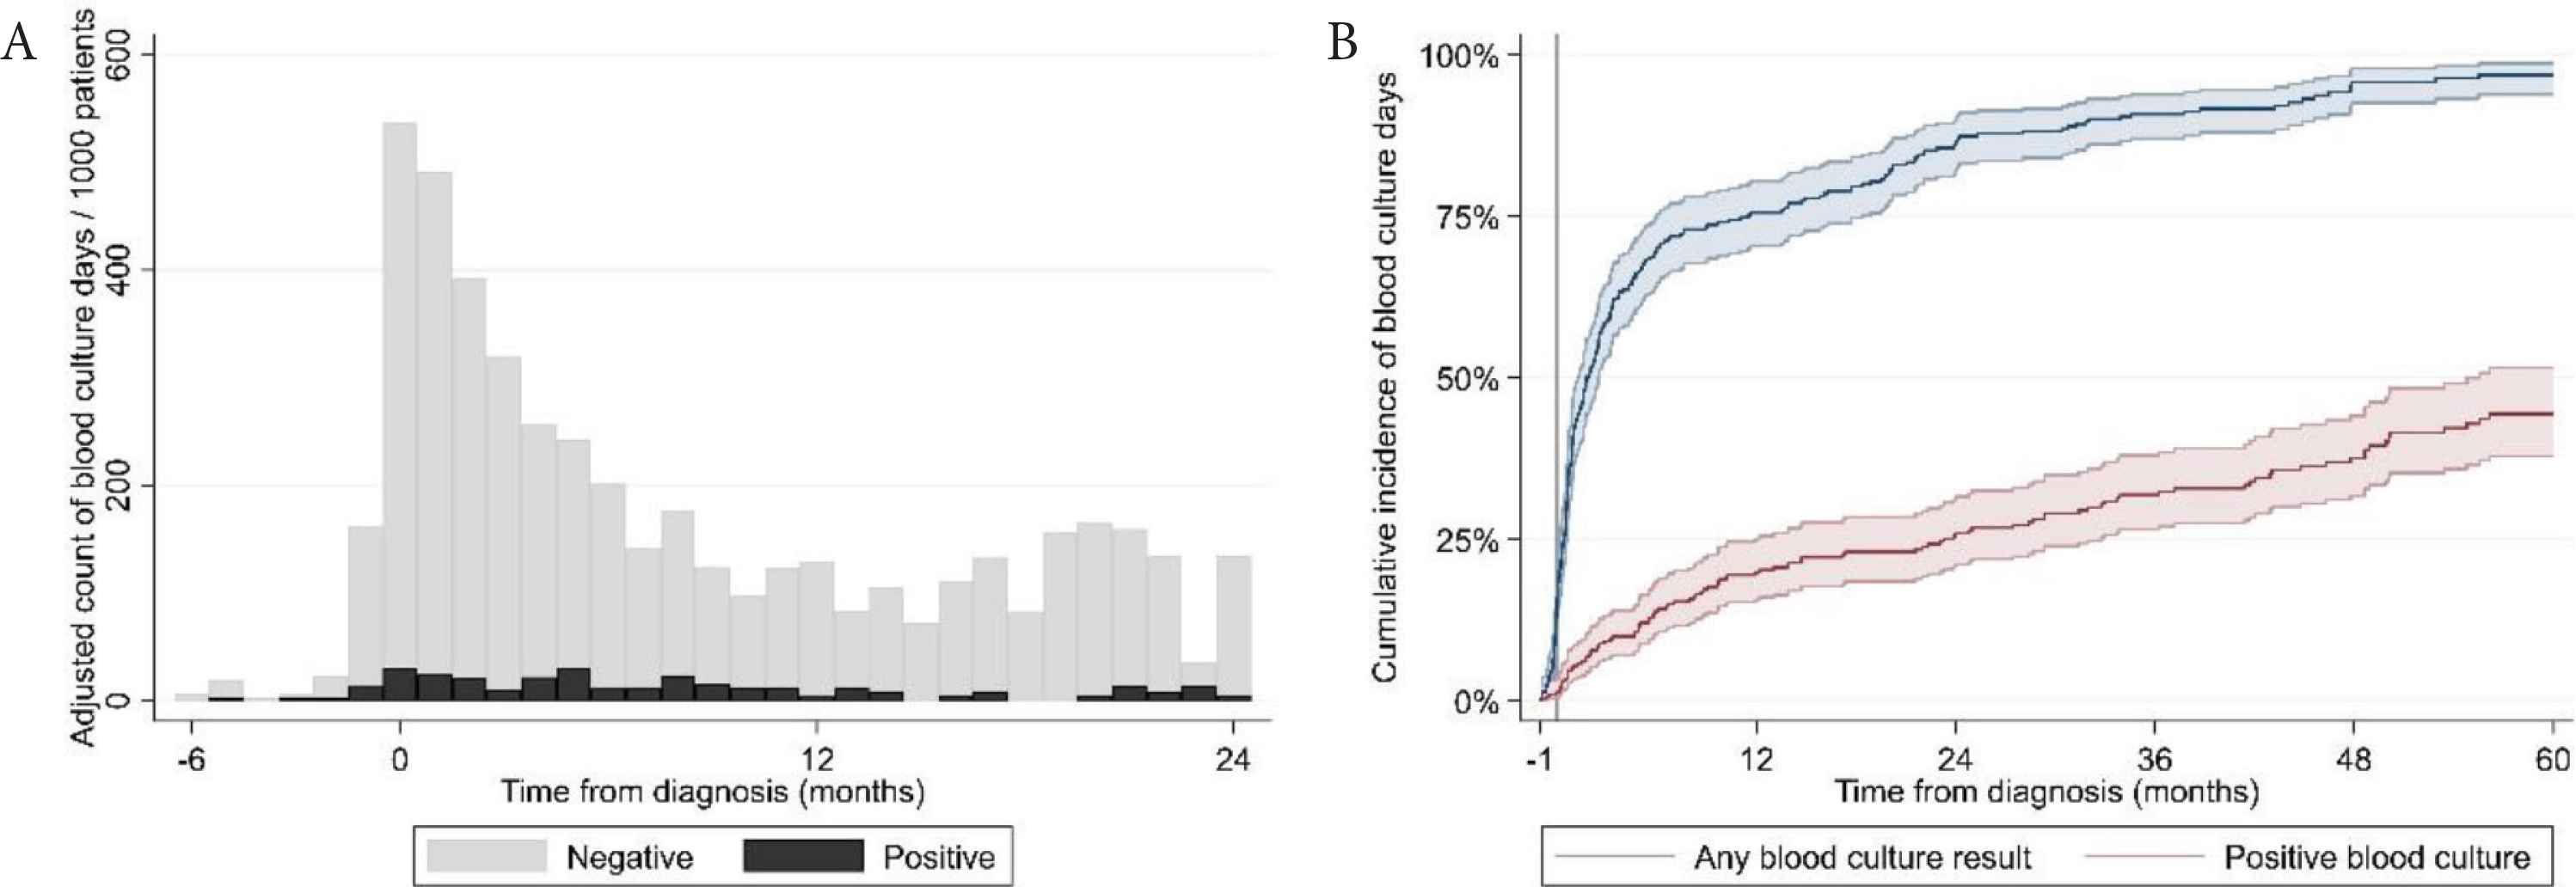
(A) Adjusted incidence of blood culture positivity from the time of diagnosis. (B) Cumulative incidence of blood culture positivity from the month prior to diagnosis until death or follow up at 60 months.
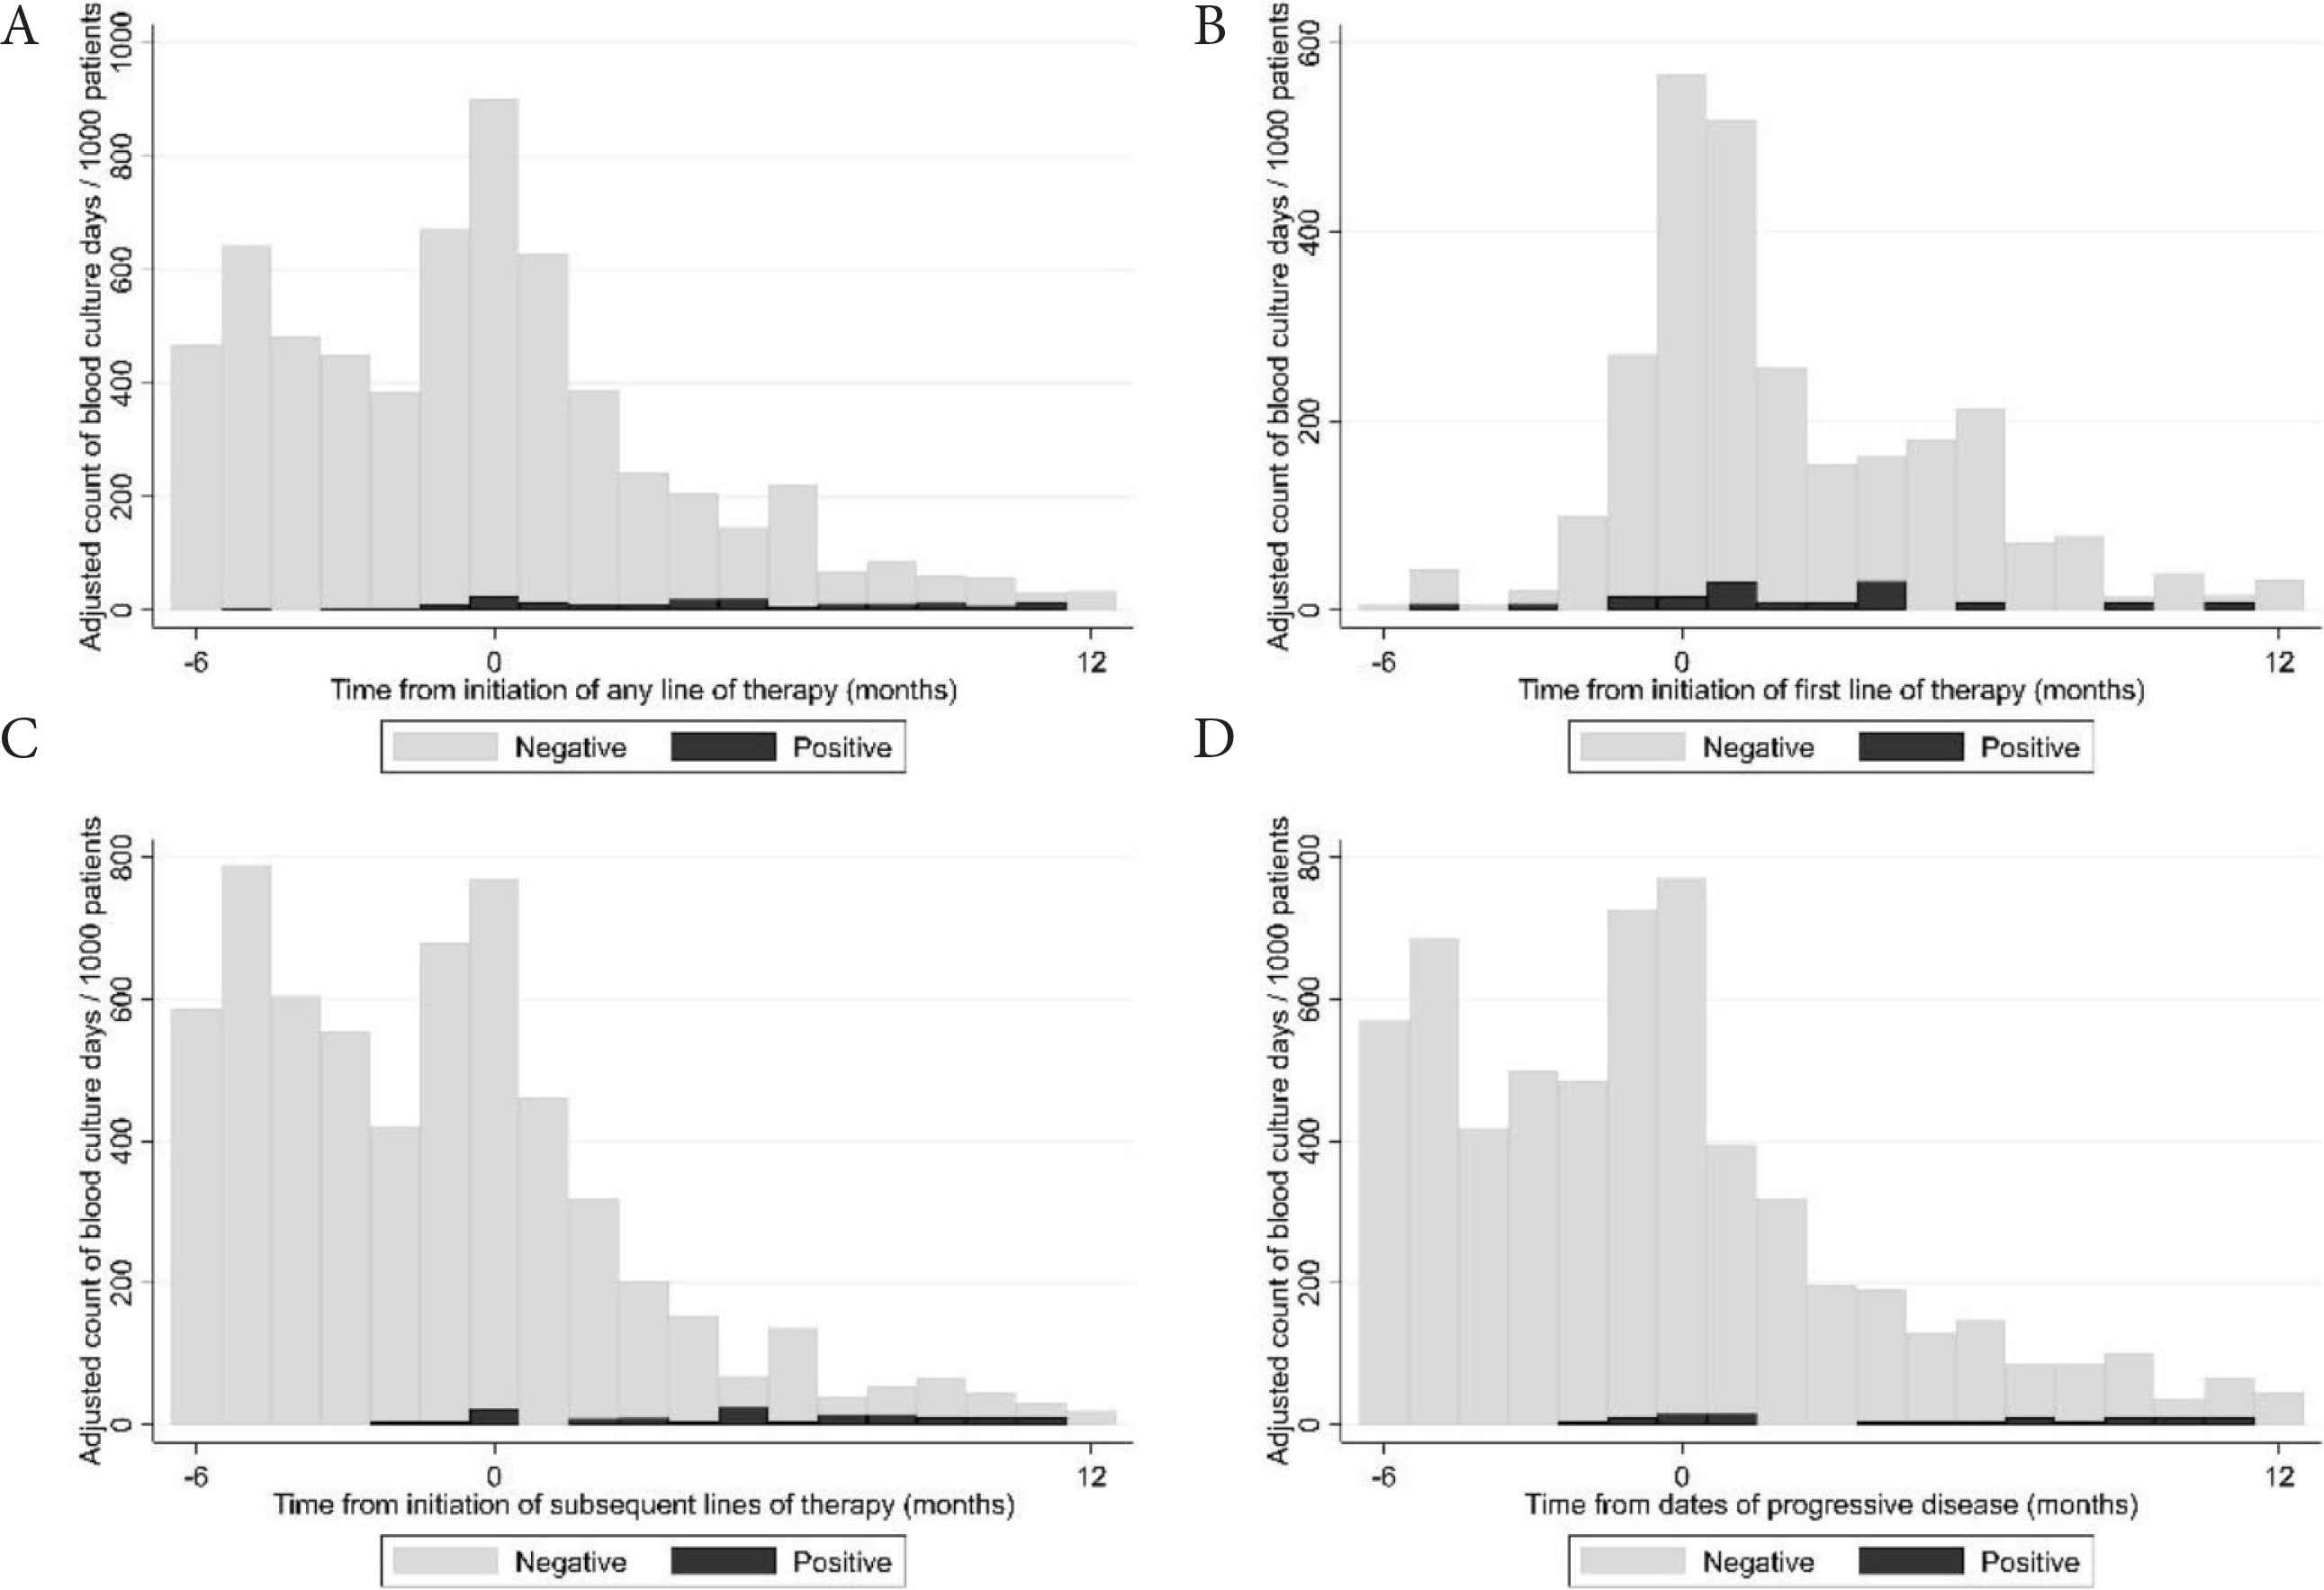
(A) Adjusted incidence of blood culture days in relation to initiation of any line of therapy. (B) Adjusted incidence of blood culture days in relation to the date of initiation of the first line of therapy. (C) Adjusted incidence of blood culture days in relation to the date of initiation of any subsequent line of therapy. (D) Adjusted incidence of blood culture days in relation to the dates of progressive disease.
Univariate and multivariate analyses of risk factors for blood culture days are shown in Table S2. Among clinical baseline characteristics, low hemoglobin, high ionized calcium, high creatinine, low immunoglobulin (Ig) M, M-protein of IgA isotype, light-chain only disease and poor Eastern Cooperative Oncology Group (ECOG) performance status were independently associated with higher risk of BCDs. Among treatment-related factors, worse than very good partial response to the ongoing line of therapy, increasing number of prior lines of therapy and a recent event of progressive disease were independently associated with higher risk of BCDs. Among the assessed treatment regimens, high-dose melphalan (days 0–30), proteasome inhibitor-steroid doublets, chemotherapy-steroid doublets, daratumumab monotherapy and intensive combination regimens including five or more drugs were independently associated with such higher risk of BCDs. Two hundred and nine (69%) patients were exposed to immunoglobulin replacement therapy with a median time of 3.2 (IQR: 0.9; 22.3) months after diagnosis.
In conclusion, the burden of infections in our cohort of MM patients was high. Blood stream infections were mainly caused by Gram-negative bacteria. Patients were especially susceptible to infections at the time of diagnosis and in situations of insufficient disease control. Certain anti-myeloma regimens, such as proteasome inhibitor-steroid doublets, chemotherapy-steroid doublets, daratumumab monotherapy and combination regimens including five or more drugs may require increased attention to infectious complications.
CONFLICTS OF INTEREST
AGS: consulting for Janssen; TP: consulting for Janssen, Celgene, Takeda, Abbvie, Genmab; KFI: no conflicts of interest; SM: no conflicts of interest; FSR: no conflicts of interest.
AUTHORS’ CONTRIBUTION
AGS designed the study, created the study database, conducted patient chart review, wrote the manuscript and designed the figures. KFI conducted patient chart review and contributed to writing the manuscript. SM carried out data analysis and statistics and contributed to writing the manuscript. FSR reviewed and categorized the blood culture results and contributed to writing the manuscript. TP supervised the study, contributed to writing the manuscript and designing the figures.
FUNDING
The authors received no financial support for the research, authorship or publication of this article.
ACKNOWLEDGMENTS
We thank the Department of Internal Medicine and the Hematological Clinical Research Unit at Vejle Hospital for providing the financial and logistical background for this study. Data management for this project was carried out by Open Patient Data Exploratory Network, University of Southern Denmark.
SUPPLEMENTARY MATERIALS
| Pathogenic microorganism | n | Percentage (%) |
|---|---|---|
| Enterobacterales* | 59 | 31 |
| Streptococcus pneumoniae | 33 | 17 |
| Coagulase-negative Staphylococci | 21 | 11 |
| Staphylococcus aureus | 14 | 7 |
| Anaerobic bacteria | 14 | 7 |
| Enterococci | 13 | 7 |
| Viridans streptococci | 7 | 4 |
| Listeria monocytogenes | 6 | 3 |
| Pseudomonas aeruginosa | 6 | 3 |
| Candida | 6 | 3 |
| Beta-hemolytic streptococci | 6 | 3 |
| Other bacteria | 5 | 3 |
| Total (pathogenic microorganisms) | 190 | |
| Possible contaminations | 59 | |
| Total (positive) | 249 |
44 (75%) Escherichia coli. A positive BCD was defined as a day a patient had at least one positive blood culture result.
Microorganisms cultured on positive blood culture days
| Variable | Number of observations | Univariate analysis | p | Multivariate analysis | p |
|---|---|---|---|---|---|
| HR (95% CI) | HR (95% CI) | ||||
| Demographics | |||||
| Age | |||||
| <50 | 14 | Reference | Reference | ||
| 50–60 | 36 | 0.94 (0.77; 1.15) | 0.567 | 0.67 (0.53; 0.85) | 0.001 |
| 60–70 | 106 | 1.07 (0.90; 1.28) | 0.434 | 0.67 (0.54; 0.83) | <0.001 |
| >70 | 146 | 1.01 (0.84; 1.21) | 0.939 | 0.61 (0.49; 0.75) | <0.001 |
| Sex | |||||
| Male | 175 | Reference | Reference | ||
| Female | 127 | 0.85 (0.79; 0.93) | <0.001 | 0.93 (0.85; 1.03) | 0.154 |
| CRAB features | |||||
| Hemoglobin <6.2 mmol/L | 102 | 0.85 (0.82; 0.88) | <0.001 | 0.91 (0.86; 0.95) | <0.001 |
| Ionized calcium >1.345 mmol/L | 79 | 1.65 (1.36; 2.01) | <0.001 | 1.38 (1.09; 1.76) | 0.008 |
| Creatinine >177 μmol/L | 57 | 1.00 (1.00; 1.00) | <0.001 | 1.00 (1.00; 1.00) | 0.005 |
| Osteolytic lesion on either skeletal X-ray or WBLDCT not present | 97 | Reference | Reference | ||
| Osteolytic lesion on either skeletal X-ray or WBLDCT present | 205 | 0.85 (0.78; 0.93) | <0.001 | 0.75 (0.68; 0.83) | <0.001 |
| Immunoglobulins | |||||
| IgA ≥ 0.7 g/L (excluding patients with IgA M-protein isotype) | 133 | Reference | Reference | ||
| IgA < 0.7 g/L (excluding patients with IgA M-protein isotype) | 169 | 1.05 (0.97; 1.14) | 0.213 | 0.91 (0.80; 1.04) | 0.180 |
| IgG ≥ 6.1 g/L (excluding patients with IgG M-protein isotype) | 190 | Reference | Reference | ||
| IgG < 6.1 g/L (excluding patients with IgG M-protein isotype) | 112 | 1.33 (1.23; 1.45) | <0.001 | 0.61 (0.49; 0.75) | <0.001 |
| IgM ≥ 0.4 g/L | 50 | Reference | Reference | ||
| IgM < 0.4 g/L | 252 | 1.90 (1.67; 2.17) | <0.001 | 1.77 (1.48; 2.11) | <0.001 |
| M-protein isotype | |||||
| IgA | 59 | 1.44 (1.30; 1.60) | <0.001 | 1.52 (1.18; 1.94) | 0.001 |
| IgG | 168 | Reference | Reference | ||
| Light-chain only | 54 | 1.02 (0.91; 1.14) | 0.789 | 1.37 (1.11; 1.69) | 0.004 |
| Non-secretory | 6 | 0.76 (0.55; 1.04) | 0.088 | 1.06 (0.72; 1.56) | 0.779 |
| Other | 2 | 2.71 (1.68; 4.39) | <0.001 | 4.15 (2.34; 7.34) | <0.001 |
| Myeloma risk profile | |||||
| ISS I | 88 | Reference | Reference | ||
| ISS II | 92 | 1.11 (1.00; 1.23) | 0.043 | 1.01 (0.89; 1.14) | 0.848 |
| ISS III | 72 | 1.55 (1.39; 1.73) | <0.001 | 0.87 (0.75; 1.01) | 0.076 |
| ISS not determined | 47 | 1.16 (1.02; 1.32) | 0.024 | 0.92 (0.79; 1.08) | 0.300 |
| High risk cytogenetics [t(4;14), t(14;16) or del(17p)] by FISH not present | 254 | Reference | Reference | ||
| High risk cytogenetics [t(4;14), t(14;16) or del(17p)] by FISH present | 48 | 1.18 (1.06; 1.32) | 0.003 | 0.99 (0.87; 1.13) | 0.875 |
| ECOG Performance status | |||||
| 0 | 111 | Reference | Reference | ||
| 1 | 116 | 1.41 (1.28; 1.54) | <0.001 | 1.41 (1.27; 1.56) | <0.001 |
| 2 | 45 | 1.25 (1.09; 1.43) | 0.001 | 1.12 (0.97; 1.30) | 0.129 |
| 3 | 26 | 1.47 (1.27; 1.69) | <0.001 | 1.40 (1.17; 1.66) | <0.001 |
| Best response to ongoing line of therapy | § | ||||
| sCR/CR/VGPR | 1050 | Reference | Reference | ||
| PR/MR | 1136 | 1.23 (1.13; 1.35) | <0.001 | 1.45 (1.29; 1.63) | <0.001 |
| SD/PD | 442 | 1.42 (1.26; 1.60) | <0.001 | 1.46 (1.24; 1.71) | <0.001 |
| Number of prior lines of therapy | § | ||||
| 1 | 873 | Reference | Reference | ||
| 2 | 519 | 0.95 (0.85; 1.07) | 0.415 | 1.15 (1.00; 1.33) | 0.051 |
| 3 | 400 | 1.10 (0.97; 1.26) | 0.131 | 1.27 (1.07; 1.50) | 0.006 |
| 4 | 314 | 1.30 (1.13; 1.50) | <0.001 | 1.42 (1.16; 1.74) | 0.001 |
| 5 | 191 | 0.94 (0.80; 1.12) | 0.513 | 0.91 (0.72; 1.15) | 0.429 |
| 6 | 212 | 1.60 (1.35; 1.90) | <0.001 | 1.83 (1.43; 2.33) | <0.001 |
| 7+ | 276 | 1.05 (0.89; 1.23) | 0.566 | 1.45 (1.14; 1.84) | 0.002 |
| Ongoing line of therapy by regimen | § | ||||
| Melphalan 200 mg/m2 days 0–30 | 434 | 1.19 (1.04; 1.37) | 0.012 | 1.28 (1.07; 1.53) | 0.006 |
| IMID ± steroid | 487 | Reference | Reference | ||
| PI ± steroid | 280 | 1.72 (1.46; 2.02) | <0.001 | 1.80 (1.50; 2.15) | <0.001 |
| CH ± steroid | 201 | 2.01 (1.68; 2.40) | <0.001 | 1.79 (1.48; 2.18) | <0.001 |
| IMID + PI ± steroid | 224 | 1.29 (1.08; 1.53) | 0.004 | 1.19 (0.99; 1.44) | 0.067 |
| PI + CH ± steroid | 173 | 1.48 (1.23; 1.78) | <0.001 | 0.94 (0.76; 1.16) | 0.547 |
| IMID + CH ± steroid | 301 | 1.46 (1.24; 1.70) | <0.001 | 1.14 (0.95; 1.36) | 0.165 |
| Daratumumab ± steroid | 147 | 1.15 (0.93; 1.42) | 0.192 | 1.29 (1.02; 1.63) | 0.033 |
| Daratumumab + PI ± steroid | 37 | 0.60 (0.41; 0.89) | 0.011 | 0.90 (0.59; 1.37) | 0.624 |
| Daratumumab + IMID ± steroid | 171 | 1.26 (1.04; 1.53) | 0.020 | 1.21 (0.97; 1.51) | 0.094 |
| Daratumumab + PI + IMID ± steroid | 3 | 0.79 (0.25; 2.45) | 0.677 | 0.85 (0.26; 2.82) | 0.791 |
| Five or more drugs | 294 | 2.18 (1.87; 2.54) | <0.001 | 1.79 (1.50; 2.14) | <0.001 |
| Other | 33 | 2.31 (1.50; 3.55) | <0.001 | 1.02 (0.63; 1.63) | 0.949 |
| Time from diagnosis | § | ||||
| 0–91 days after | 77 | Reference | Reference | ||
| 92–183 days after | 472 | 0.53 (0.45; 0.63) | <0.001 | 0.52 (0.42; 0.65) | <0.001 |
| 183–365 days after | 278 | 0.61 (0.51; 0.72) | <0.001 | 0.44 (0.34; 0.56) | <0.001 |
| 365–730 days after | 270 | 0.40 (0.34; 0.47) | <0.001 | 0.26 (0.20; 0.32) | <0.001 |
| More than 730 days after | 404 | 0.26 (0.23; 0.30) | <0.001 | 0.12 (0.10; 0.16) | <0.001 |
| Time from initiation of immunoglobulin replacement therapy | § | ||||
| Before | 524 | Reference | Reference | ||
| 0–91 days after | 335 | 2.34 (2.02; 2.71) | <0.001 | 2.06 (1.75; 2.43) | <0.001 |
| 92–183 days after | 179 | 1.57 (1.31; 1.88) | <0.001 | 1.26 (1.02; 1.56) | 0.033 |
| 184–365 days after | 249 | 2.39 (2.03; 2.82) | <0.001 | 2.05 (1.69; 2.48) | <0.001 |
| Time from dates of progressive disease | § | ||||
| Before | 1315 | Reference | Reference | ||
| 0–91 days after | 281 | 1.13 (0.98; 1.30) | 0.087 | 1.17 (1.00; 1.37) | 0.051 |
| 92–183 days after | 33 | 0.95 (0.65; 1.40) | 0.810 | 0.91 (0.59; 1.41) | 0.682 |
| 184–365 days after | 20 | 0.61 (0.37; 1.01) | 0.054 | 0.71 (0.39; 1.29) | 0.260 |
§, the same patient is taken into account multiple times. CH, chemotherapy (cyclophosphamide/low-dose melphalan/bendamustine/doxorubicine/liposomal doxorubicine/melflufen); CR, complete response; FISH, fluorescence in situ hybridisation; IMID, immunomodulatory agent (thalidomide/lenalidomide/pomalidomide); ISS, international staging system; sCR, stringent complete response; MR, minimal response; PD, progressive disease; PI, proteasome inhibitor (bortezomib/carfilzomib/ixazomib); PR, partial response; SD, stable disease; VGPR, very good partial response; WBLDCT, whole-body low-dose computer tomography.
Univariate and multivariate analysis of risk factors for blood culture days
REFERENCES
Cite this article
TY  - JOUR
AU  - Agoston Gyula Szabo
AU  - Katrine Fladeland Iversen
AU  - Flemming Schønning Rosenvinge
AU  - Sören Möller
AU  - Torben Plesner
PY  - 2020
DA  - 2020/08/10
TI  - The Incidence and Timing of Blood Cultures in Multiple Myeloma – Results from a Retrospective, Single Center, Real-World Study
JO  - Clinical Hematology International
SP  - 168
EP  - 172
VL  - 2
IS  - 4
SN  - 2590-0048
UR  - https://doi.org/10.2991/chi.k.200719.001
DO  - 10.2991/chi.k.200719.001
ID  - Szabo2020
ER  -