
Current Status and Predictors of Patient Safety Culture in Hospitals of Qassim Region, Saudi Arabia
 , Tarek Ibrahim1, , Abdulaziz Alresheedi3, Aliaa Elnefiely1, Faisal Alforaih4
- DOI
- 10.2991/dsahmj.k.200618.001How to use a DOI?
- Keywords
- Patient safety culture; hospitals staff; Qassim region; Saudi Arabia
- Abstract
Background and Objectives: The emerging concept of safety culture has been increasingly recognized as an issue of global importance. Measuring the Patient Safety Culture (PSC) of healthcare facilities helps in highlighting areas requiring improvement as well as tracking changes over time. Our study aimed to describe the current status and predictors of PSC in hospitals of Qassim Region, Saudi Arabia.
Methods: In 2016–2017, data on PSC were collected from 1460 staff members in five hospitals using the Hospital Survey on Patient Safety Culture instrument. The data were analyzed using descriptive statistics, Chi-square test (χ2), analysis of variance, and linear regression analysis.
Results: Teamwork within units received the highest score (mean score = 3.95/5), whereas nonpunitive response to errors received the lowest score (mean score = 2.25/5). The study has identified four PSC dimensions requiring improvement: teamwork across units, staffing, handoffs and transitions, and nonpunitive response to errors. In general, the categories of new hires and pharmacists were more likely to negatively perceive PSC dimensions. Furthermore, approximately half of the variance in PSC perception scores was explained by teamwork within units, organizational learning, hospital management support, teamwork across units, and nonpunitive response to errors.
Conclusion: Patient safety culture of any healthcare setting is not a simple paradigm, applying system changes to the healthcare systems remains vital to improve safety. It is essential to build an environment that support staff to speak up freely about their concerns regarding any safety issues.
- Copyright
- © 2020 Dr. Sulaiman Al Habib Medical Group. Publishing services by Atlantis Press International B.V.
- Open Access
- This is an open access article distributed under the CC BY-NC 4.0 license (http://creativecommons.org/licenses/by-nc/4.0/).
1. INTRODUCTION
Patient safety is viewed as the “heart of healthcare quality” [1]. According to the World Health Organization [2], patient safety refers to “the absence of preventable harm to a patient during the process of health care.” Pertaining to the context of patient safety is the emerging concept of safety culture, which has been progressively recognized as an issue of worldwide importance [3]. Safety culture is a product of values, attitudes, perceptions, skills, and blueprints of entity and organizational behavior, all of which determine the obligation to safety approach [4]. Blegen et al. [5] defined safety culture as a universal phenomenon with norms, values, and fundamental conjectures of a whole organization. It is believed that organizations with a positive safety culture are distinguished by trusted communications, dual perceptions of the significance of safety, and by strong beliefs on the effectiveness of prevention [4].
Patient safety in healthcare organizations can be improved by having an effective reporting system to enable learning from errors, identify the underlying causes, and search for opportunities for improvements. However, there are many considerable barriers that affect the implementation of the reporting system, which in turn can impact safety culture. Cultural barriers had been found to be significant in the inhibition of incident reporting. Studies illustrate that fear of blame, retribution, holding individuals responsible, and punishment are the major cultural barriers to errors reporting [6]. In healthcare organizations, employees who are involved in serious errors could suffer from worry, feeling guilty, blame, anxiety, and depression as a result of disciplinary action and emotional feeling toward the harmed patient. Being a “second victim,” many healthcare providers tend to hide their feelings and do not admit or report their mistakes which ultimately affect patient safety [7]. Accordingly, establishing a culture of safety is a key, strategy to improve patient safety in healthcare institutions. Many studies show that developing a safety environment and safety culture are directly related to increasing error reporting and reducing adverse events and mortality [8]. There are many strategies that had been used by many health institutions to promote Patient Safety Culture (PSC) such as communication, cooperation, teamwork, and behavior change and leadership commitment [8]. Into the bargain, measuring the safety culture of healthcare helps in highlighting areas requiring improvement as well as tracking changes over time [6,9]. A study conducted in 2016 to evaluate the status of PSC in Arab countries showed that culture of blame is considered a major issue that prevents errors reporting [10]. Another study conducted in a large hospital in Riyadh, Saudi Arabia, showed that approximately half of the staff had not reported any events in the previous 12 months [11]. Furthermore, the study reported that nonpunitive response to errors had the lowest positive rate (26.8%) [11]. In addition, a study involving 223 healthcare providers in 13 general hospitals in Riyadh concluded that elimination of blame, fear, and silence in mistakes are a considerable approach in building a safety culture [12]. All these studies illustrate that PSC is not fully developed in Arab countries including Saudi Arabia. Our study aimed to assess the current status and predictors of PSC as perceived by 1460 healthcare providers in Qassim hospitals.
2. THEORETICAL FRAMEWORK
The theoretical framework of this study is based on the Hospital Survey on Patient Safety Culture (HSOPSC) established by the Agency for Healthcare Research and Quality (AHRQ) [13]. This tool has been widely used outside the United States, where it was developed, with a validated Arabic version available. The survey, which covers both hospital and unit levels, assesses staff opinions about the following dimensions:
- (1)
Teamwork within units—mutual support, respect, and cooperation between staff.
- (2)
Supervisor/manager expectations and actions promoting safety—supervisors/managers involve staff in improving patient safety, applause them for adherence to safety measures, and do not overlook safety problems.
- (3)
Organizational learning—mistakes have led to constructive changes.
- (4)
Management support for patient safety—work climate promotes patient safety and demonstrations that patient safety is a top priority.
- (5)
Feedback and communication about error—staff are being informed about errors and given feedback about actions taken.
- (6)
Communication openness—staff freely protests and question anything that may harm a patient.
- (7)
Teamwork across units—hospital units collaborate and organize with each other for the best patient care.
- (8)
Staffing—the provision of sufficient staff to handle the workload.
- (9)
Handoffs and transitions—patient care information is successfully transformed across hospital units and during shift changes.
- (10)
Nonpunitive response to error—staff feel that their mistakes are not alleged against them nor kept in their personnel files.
The survey further assesses staff overall perceptions of PSC as an outcome measure. Perceptions of PSC refer to the system in relation to error prevention and absence of patient safety issues.
A conceptual model for the study was developed based on the HSOPSC framework. The model assumes that staff perceptions of PSC are predicted by the staff years of experience and position in addition to the 10 mentioned PSC dimensions (Figure 1).

Conceptual model of the study.
Accordingly, this study was aimed to assess the current status and predictors of PSC in Qassim region as perceived by hospitals’ staff. The study had three objectives: (1) to assess the overall staff perceptions of PSC, (2) to analyze the differences in staff perceptions of PSC according to the years of experience and positions, and (3) to identify predictors of staff perceptions of PSC.
3. MATERIALS AND METHODS
3.1. Procedure
In 2016–2017, a cross-sectional correlational design was used to collect data on PSC from five hospitals in Qassim Region. The hospitals were selected to represent a different scope of services and different bed capacities. The participating hospitals are: King Fahad Specialist Hospital (KFSH) with 385 beds; Maternity and Children Hospital (MCH) with 283 beds; King Saud Hospital (KSH) with 294 beds; Mental Health Hospital (MHH) with 152 beds; and Prince Sultan Cardiac Center—Qassim (PSCCQ) with 50 beds.
For each participating hospital, the representativeness of the sample size was ensured according to the statistics of the General Directorate of Health Affairs in Qassim province. The questionnaires were distributed and collected under the supervision of the quality coordinators.
3.2. Questionnaire
The questionnaire consisted of 43 items based on HSOPSC by the AHRQ (Figure 1). The questionnaire was distributed in Arabic and English simultaneously.
3.3. Measures
Two demographic variables were included: years of experience and position. Staff years of experience were categorized into six categories (<1, 1–5, 6–10, 11–15, 16–20, and ≥21 years). Likewise, staff position was categorized into six categories (nurses, physicians, pharmacists, allied health professionals, administrative staff, and others). The category of “others” encompassed miscellaneous extra positions such as social workers, and staff of fair management and safety and medical records.
The 10 PSC dimensions were assessed based on 5-point Likert responses scale of agreement (from “strongly disagree” to “strongly agree’) or frequency (from “never” to “always”). Similarly, the overall perception of patient safety was assessed using the 5-point Likert response scale of agreement (from “strongly disagree” to “strongly agree”).
3.4. Statistical Analyses
The collected data were coded and entered into an Excel spreadsheet (Microsoft Corporation, Redmond, WA, USA) for initial editing, and then exported to SPSS (version 20; SPSS Inc., Chicago, IL, USA) for statistical analysis. Descriptive statistics (frequencies and percentages) were used to provide an overall picture of the study population. The differences in the demographic variables across the five hospitals were tested using Chi-square (χ2) test. Mean scores and standard deviations were calculated and analyzed for the 10 PSC dimensions. A mean score of ≥3.00 suggests favorable perceptions of PSC [14]. In addition, the differences in the mean scores of PSC dimensions across the demographic variables were tested by means of one-way Analysis of Variance (ANOVA). The internal consistency (reliability) of the 10 PSC dimensions (scales) was assessed using Cronbach α coefficient. To identify the potential predictors of the overall perceptions of (as an outcome measure), hierarchical linear regression analysis was performed. The hospital variable was controlled for in the analysis. A p-value of 0.05 was used to determine statistical significance.
4. RESULTS
Out of 2000 questionnaires sent to the participants, a total of 1460 valid responses were obtained (response rate, 73.0%). The distribution of responses across the five hospitals was as follows: KFSH, 361; KSH, 278; MCH, 238; MHH, 351; and PSCCQ, 232. As shown in Table 1, just slightly more than one-third of the participants had 1–5 years of experience in their profession, whereas only 5.2% had ≥21 years of experience. With respect to the distribution of the participants by their position, the most represented category was nurses, who constituted approximately half of the samples (53.0%). Physicians, by contrast, comprised 16.4% of the total. Furthermore, there were significant differences (p < 0.001) between the five studied hospitals in both demographic variables.
| Characteristics | Total sample | n (%) | χ2 | p | ||||
|---|---|---|---|---|---|---|---|---|
| KFSH (n = 357) | KSH (n = 278) | MCH (n = 234) | MHH (n = 351) | PSCCQ (n = 221) | ||||
| Years of experience | 251.7 | <0.001 | ||||||
| <1 | 250 (17.3) | 60 (24.0) | 22 (8.8) | 39 (15.6) | 122 (48.8) | 7 (2.8) | ||
| 1–5 | 523 (36.3) | 118 (22.6) | 143 (27.3) | 106 (20.3) | 67 (12.8) | 89 (17.0) | ||
| 6–10 | 297 (20.6) | 73 (24.6) | 69 (23.2) | 42 (14.1) | 47 (15.8) | 66 (22.2) | ||
| 11–15 | 192 (13.3) | 60 (31.3) | 29 (15.1) | 21 (10.9) | 36 (18.8) | 46 (24.0) | ||
| 16–20 | 104 (7.2) | 23 (22.1) | 10 (9.6) | 13 (12.5) | 53 (51.0) | 5 (4.8) | ||
| ≥21 | 75 (5.2) | 23 (30.7) | 5 (6.7) | 13 (17.3) | 26 (34.7) | 8 (10.7) | ||
| Profession | 572.0 | <0.001 | ||||||
| Nurses | 772 (53.0) | 95 (12.3) | 238 (30.8) | 174 (22.3) | 133 (17.2) | 132 (17.1) | ||
| Physicians | 239 (16.4) | 124 (51.9) | 4 (1.7) | 33 (13.8) | 34 (14.2) | 44 (18.4) | ||
| Pharmacists | 44 (3.0) | 21 (47.7) | 0 | 4 (9.1) | 18 (40.9) | 1 (2.3) | ||
| AHP | 204 (14.0) | 65 (31.9) | 11 (5.4) | 11 (5.4) | 62 (30.4) | 55 (26.9) | ||
| Administrative | 140 (9.6) | 17 (12.1) | 25 (17.9) | 3 (2.1) | 95 (67.9) | 0 | ||
| Others | 57 (3.9) | 39 (68.4) | 0 | 9 (15.8) | 9 (15.8) | 0 | ||
AHP, Allied health professionals.
Sociodemographic characteristics of the participants by hospital (n = 1460)
4.1. Mean Scores of PSC Dimensions
Table 2 and Figure 2 provide the overall mean scores of PSC dimensions. The mean scores ranged between 2.25 and 3.95. The Cronbach α coefficient of the 10 dimensions was 0.71. The most positively perceived dimensions were teamwork within units (mean = 3.95) and organizational learning (mean = 3.92), whereas the least positively perceived dimensions were nonpunitive response to errors (mean = 2.25) and handoffs and transitions (mean = 2.38). Furthermore, the results showed that the mean scores of PSC dimensions were significantly different across hospitals (p < 0.001). Most frequently, staff of PSCCQ held more positive perceptions of PSC than the other hospitals.
| Dimension | Items (n) | Overall mean (SD) | Overall mean score | p | |||||
|---|---|---|---|---|---|---|---|---|---|
| KFSH | MCH | KSH | MHH | PSCCQ | |||||
| (1) | Teamwork within units | 4 | 3.95 (0.86) | 3.99 | 3.59 | 3.81 | 4.00 | 4.37 | <0.001 |
| (2) | Supervisor/manager expectations | 4 | 3.05 (0.75) | 3.08 | 2.69 | 3.04 | 3.04 | 3.43 | <0.001 |
| (3) | Organizational learning | 3 | 3.92 (0.80) | 3.89 | 3.87 | 4.16 | 3.74 | 4.03 | <0.001 |
| (4) | Hospital management support | 3 | 3.18 (0.72) | 3.27 | 3.22 | 3.48 | 2.84 | 3.18 | <0.001 |
| (5) | Feedback and communication about error | 3 | 3.77 (0.92) | 3.81 | 3.82 | 3.92 | 3.60 | 3.72 | <0.001 |
| (6) | Communication openness | 3 | 3.12 (0.91) | 3.12 | 2.97 | 2.93 | 3.19 | 3.39 | <0.001 |
| (7) | Teamwork across units | 4 | 2.95 (0.77) | 2.93 | 2.61 | 2.80 | 3.08 | 3.40 | <0.001 |
| (8) | Staffing | 4 | 2.55 (0.99) | 2.49 | 2.23 | 2.62 | 2.92 | 2.55 | <0.001 |
| (9) | Handoffs and transitions | 4 | 2.38 (1.11) | 2.19 | 2.01 | 2.07 | 2.07 | 2.28 | <0.001 |
| (10) | Nonpunitive response to errors | 3 | 2.25 (1.05) | 2.23 | 1.91 | 2.26 | 2.36 | 2.44 | <0.001 |
SD, standard deviation.
Mean scores of PSC dimensions by hospital (n = 1460)
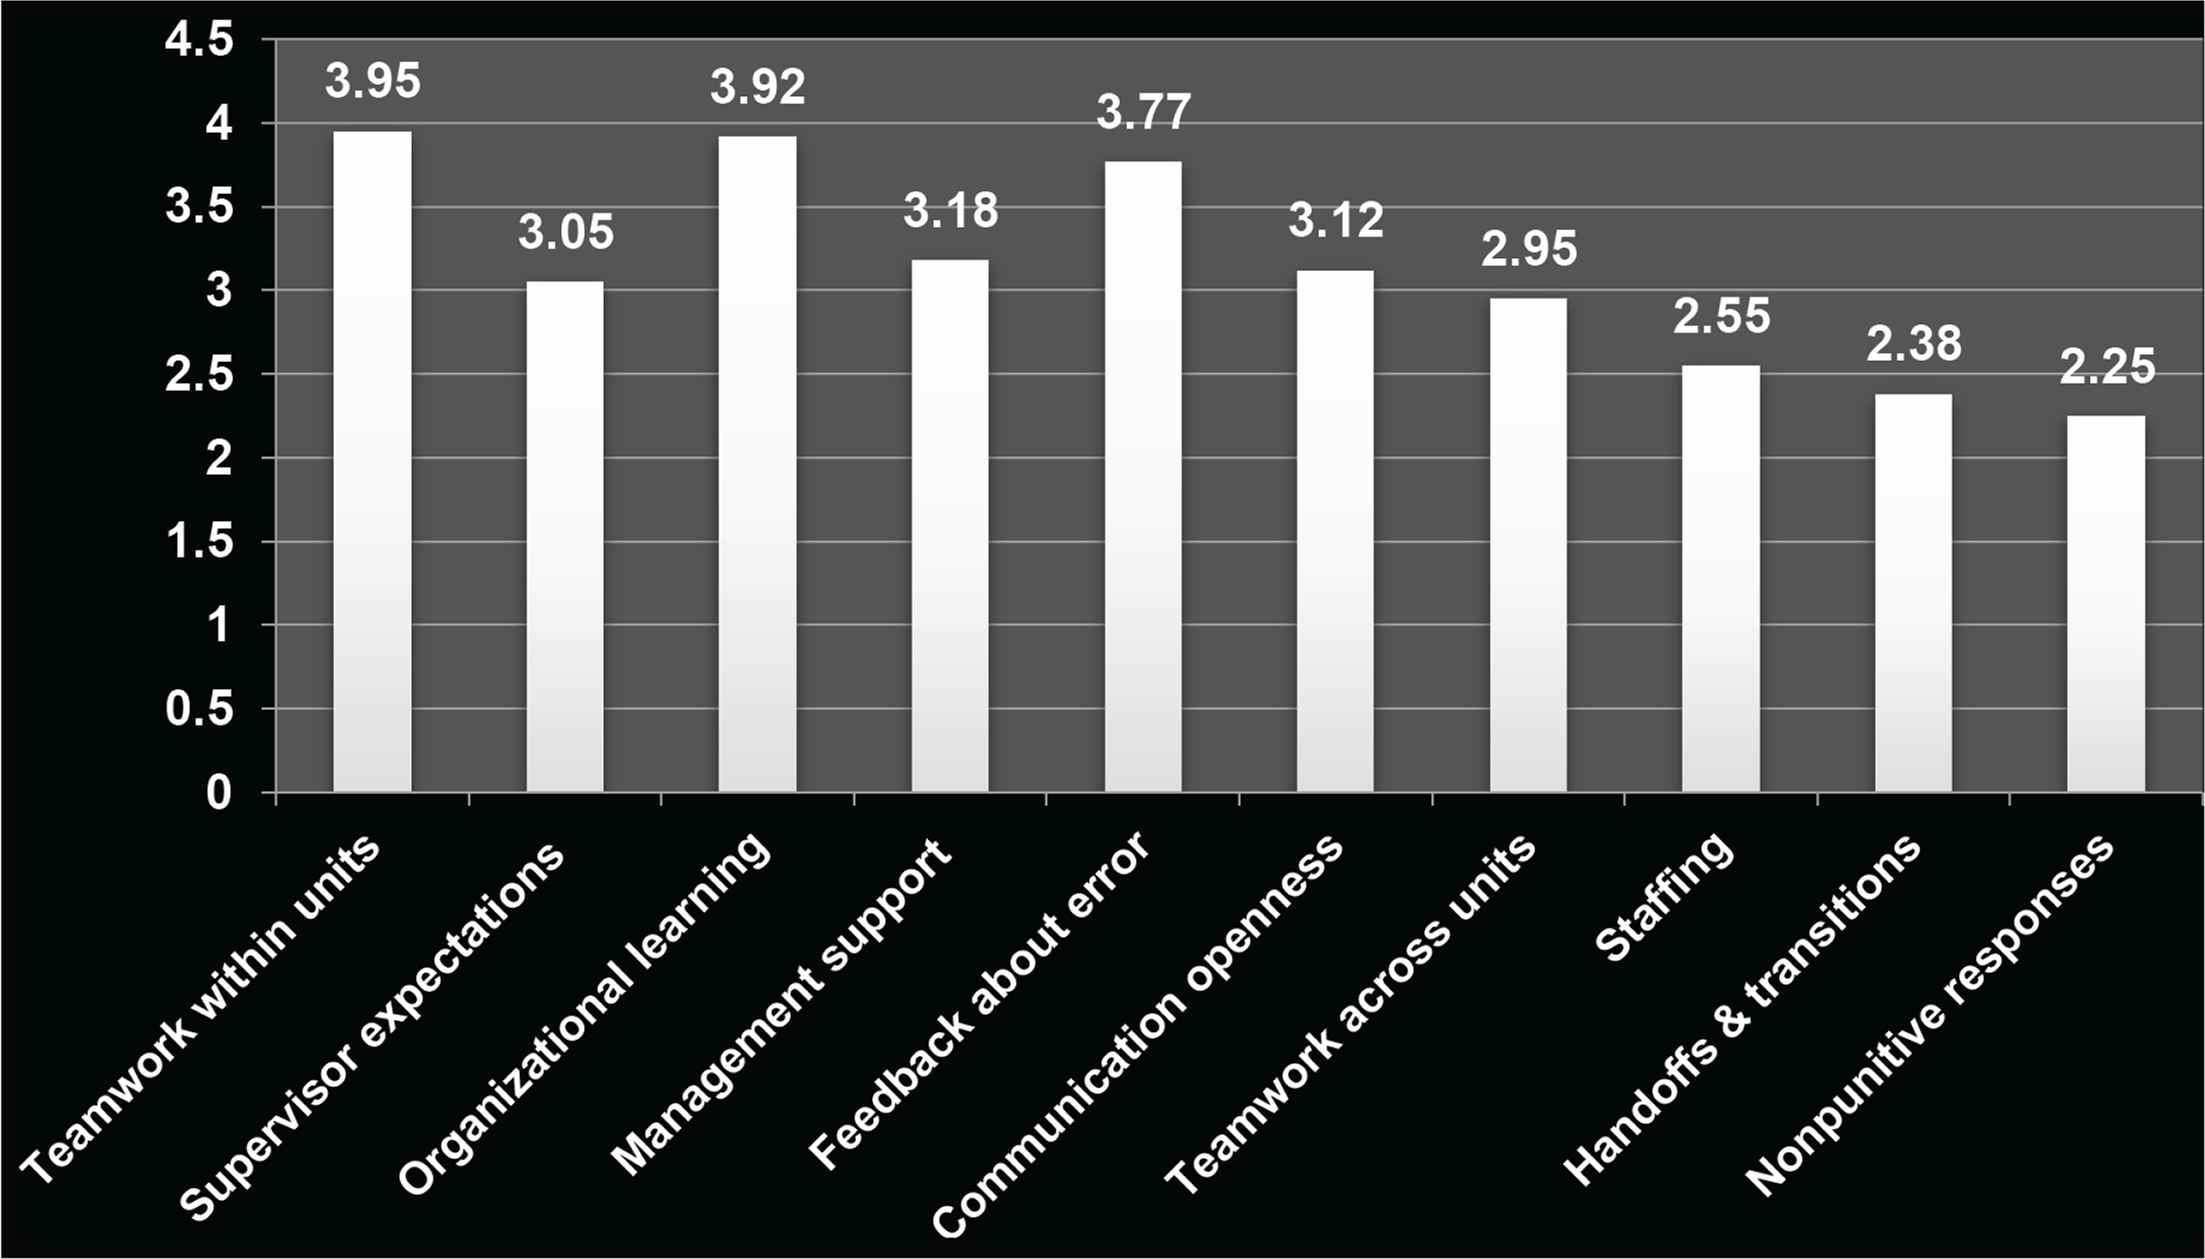
Mean scores for PSC (n = 1460).
4.2. Differences in Staff Perceptions of PSC According to Years of Experience
Table 3 shows the results of ANOVA and Tukey’s post-hoc test in staff perceptions of PSC according to staff the years of experience. The results revealed that all dimensions of PSC differed significantly according to staff position. In most cases, newly hired staff (<1 year) had the lowest perception of PSC. By contrast, staff with 11–15 years had the highest perception of PSC more frequently.
| Dimension | Mean (SD) | F-value | p | |||||
|---|---|---|---|---|---|---|---|---|
| <1 year | 1–5 years | 6–10 years | 11–15 years | 16–20 years | ≥21 years | |||
| Teamwork within units | 3.92 (1.26) | 4.06 (0.87) | 4.21 (1.01) | 4.42 (0.99) | 4.08 (1.05) | 4.27 (0.86) | 6.75 | <0.001 |
| Supervisor/manager expectations | 2.95 (0.84) | 3.02 (0.72) | 3.14 (0.75) | 3.14 (0.72) | 3.01 (0.83) | 3.05 (0.59) | 2.49 | 0.030 |
| Organizational learning | 3.69 (0.98) | 3.89 (0.66) | 4.16 (0.80) | 4.07 (0.77) | 3.70 (0.95) | 4.00 (0.63) | 12.72 | <0.001 |
| Hospital management support | 2.93 (0.77) | 3.17 (0.56) | 3.29 (0.70) | 3.46 (0.88) | 3.10 (0.85) | 3.08 (0.77) | 13.95 | <0.001 |
| Feedback and communication about error | 3.62 (1.06) | 3.70 (0.78) | 3.98 (0.93) | 3.93 (0.95) | 3.93 (0.95) | 3.55 (1.1) | 7.10 | <0.001 |
| Communication openness | 3.00 (1.05) | 3.01 (0.82) | 3.21 (0.84) | 3.31 (0.97) | 3.17 (1.01) | 3.28 (0.82) | 5.36 | <0.001 |
| Teamwork across units | 2.83 (0.89) | 2.90 (0.68) | 2.98 (0.66) | 3.21 (0.82) | 3.00 (0.92) | 2.92 (0.90) | 6.07 | <0.001 |
| Staffing | 2.33 (0.88) | 2.38 (0.76) | 2.61 (1.10) | 3.02 (1.17) | 2.81 (1.29) | 2.64 (1.02) | 12.05 | <0.001 |
| Handoffs and transitions | 2.09 (0.87) | 2.42 (1.09) | 2.58 (1.13) | 2.34 (1.27) | 2.33 (1.11) | 2.45 (1.10) | 5.42 | <0.001 |
| Nonpunitive response to errors | 2.12 (1.00) | 2.28 (0.90) | 1.95 (1.04) | 2.44 (1.26) | 2.71 (1.16) | 2.37 (1.07) | 11.48 | <0.001 |
SD, standard deviation.
Differences in mean scores of Patient Safety Culture (PSC) dimensions by years of experience
4.3. Differences in Staff Perceptions of PSC According to Profession’s Position
Table 4 shows the results of ANOVA and Tukey’s post-hoc test in staff perceptions of PSC according to their position. The results revealed that all dimensions of PSC differed significantly according to staff position. Most frequently, administrative staff had the highest perceptions of PSC. By contrast, pharmacists had the lowest perception of PSC most frequently.
| Dimension | Mean (SD) | F-value | p | |||||
|---|---|---|---|---|---|---|---|---|
| Nurses | Physicians | Pharmacists | AHPs | Administrative | Others | |||
| Teamwork within units | 4.02 (1.00) | 4.18 (1.10) | 4.0 (1.14) | 4.3 (0.99) | 4.3 (1.00) | 4.14 (0.79) | 4.65 | <0.001 |
| Supervisor/manager expectations | 3.01 (0.731) | 3.05 (0.776) | 2.98 (0.78) | 3.19 (0.80) | 3.14 (0.80) | 2.95 (0.58) | 2.38 | 0.037 |
| Organizational learning | 3.98 (0.78) | 3.79 (0.85) | 3.64 (0.97) | 3.95 (0.71) | 3.96 (0.89) | 3.86 (0.58) | 3.44 | 0.004 |
| Hospital management support | 3.19 (0.69) | 3.11 (0.67) | 2.71 (0.61) | 3.24 (0.70) | 3.28 (1.00) | 3.22 (0.50) | 5.03 | <0.001 |
| Feedback and communication about error | 3.78 (0.86) | 3.63 (1.00) | 3.59 (1.10) | 3.83 (0.96) | 3.91 (1.09) | 3.80 (0.71) | 9.36 | 0.050 |
| Communication openness | 3.00 (0.90) | 3.18 (0.87) | 3.17 (0.96) | 3.40 (0.91) | 3.42 (0.95) | 2.79 (0.67) | 11.53 | <0.001 |
| Teamwork across units | 2.83 (0.72) | 2.87 (0.68) | 2.88 (0.65) | 3.20 (0.86) | 3.41 (0.95) | 3.70 (0.51) | 19.45 | <0.001 |
| Staffing | 2.41 (0.92) | 2.53 (0.95) | 2.20 (0.69) | 2.96 (1.00) | 3.69 (1.39) | 2.59 (0.66) | 20.89 | <0.001 |
| Handoffs and transitions | 2.39 (1.10) | 2.36 (1.08) | 2.24 (0.70) | 2.79 (1.30) | 1.9 (0.93) | 2.38 (0.69) | 10.08 | <0.001 |
| Nonpunitive response to errors | 2.10 (0.98) | 2.30 (0.97) | 1.94 (0.68) | 2.46 (1.12) | 2.75 (1.37) | 2.13 (0.69) | 12.36 | <0.001 |
SD, standard deviation.
Differences in mean scores of PSC dimensions by profession
4.4. Predictors of Staff Overall Perceptions of Patient Safety
Table 5 summarizes the results of hierarchical linear regression analysis for variables predicting staff perceptions of PSC. In Model 1, hospital variable, as a controlled variable, has no significant effect on the overall perceptions of patient safety. After the inclusion of PSC dimensions in Model 2, five PSC dimensions were found to be significant predictors of staff overall perceptions of PSC. These dimensions are (1) teamwork within units, (2) organizational learning, (3) management support, (4) teamwork across units, and (5) nonpunitive response to errors. By contrast, hospital variables turned significant. The Nagelkerke R2 was 0.49; hence, these variables explained 49% of the variance in the overall perceptions of PSC.
| Variables | Model 1 | Model 2 |
|---|---|---|
| β | β | |
| Step 1. Controlled variable | ||
| Hospital | 0.03 | –0.09** |
| Step 2. Patient safety culture dimensions | ||
| Teamwork within units | 0.16*** | |
| Supervisor/manager expectations | 0.04 | |
| Organizational learning | 0.13*** | |
| Hospital management support | 0.08* | |
| Feedback and communication about error | 0.01 | |
| Communication openness | 0.07 | |
| Teamwork across units | 0.21*** | |
| Staffing | 0.01 | |
| Hospital handoffs and transitions | 0.01 | |
| Nonpunitive response to errors | 0.35*** | |
| Total R2 | 0.001 | 0.49 |
p < 0.05;
p < 0.01;
p < 0.001.
Hierarchical linear regression analysis for predictors of staff perceptions of Patient Safety Culture (PSC)
5. DISCUSSION
This study aimed to assess the current status and predictors of PSC as perceived by 1460 healthcare providers in Qassim hospitals. The first objective of the study was to assess staff perceptions of PSC, using a cutoff point of ≥3.00/5.0 on a Likert scale.
Dimensions were dichotomized as either areas of strengths or weaknesses to be addressed in future objectives. Results showed that six out of 10 dimensions were perceived positively by the participants overall; therefore, they can be viewed as areas of strengths. Similar to recent data reported from United States hospitals [15], teamwork within units had the highest score, with an equivalent mean score of 3.95. Organizational learning had the second highest scores, replicating the results of previous regional studies [16,17] and emphasizing the importance of teamwork within units and organizational learning in fulfilling positive prescriptions toward PSC. By contrast, teamwork across units, staffing, handoffs and transitions, and nonpunitive response to errors can be viewed as areas of improvement and continued development. The nonpunitive response to error received the lowest score in our study (mean = 2.25), the result is in line with another study among Lebanon’s staff, where the same dimension scored lowest among all dimensions [18]. It is important for healthcare organizations to consider errors made by staff as learning and improvement opportunities, thereby increasing their perception of PSC and helping to prevent future errors [19]. Contrary to the recent data from U.S. hospitals, going back to their data decade ago (cited from Rogers et al. [7]) will show that both handoffs and transitions, nonpunitive response to errors were perceived negatively at that time. Therefore, we can draw lessons for improvements on their real experiences.
With respect to the finding that PSCCQ had more positive perceptions than other hospitals, it should be noted that PSCCQ is a tertiary referral center with only 50 beds. Previous research has concluded that smaller hospitals are more likely to have stronger staff commitment, to provide timely quality services, and to have higher patient experience scores [20–22].
The second objective was to analyze the differences in staff perceptions of PSC according to the years of experience and position. Our results showed that in most cases, new hires (<1 year) had the lowest perception of PSC. New hires should therefore be made familiar with policies and guidelines and given appropriate safety awareness and training immediately. By contrast, staff with 11–15 years had the highest perception of PSC more frequently. Our results are in agreement with earlier studies, which found that years of experience had positive impact on the perception of patient safety [23]. Staff awareness about safety practices in their facilities correlates positively with their working experience. Nevertheless, when the perception of safety has an inverse relationship with years of experience, it may show that the staff disagree that the patient safety practices act as barriers to errors and problems. A study conducted by Bodur and Filiz [24] showed that PSC scores declined as seniority increased, which could be justified either by older staff frustration with the regulations or increasing their alertness regarding safety problems.
With respect to differences in staff perceptions of PSC according to their positions, pharmacists significantly had the lowest perception of PSC in most cases. This finding is inconsistent with a recent integrative review reporting that the profession of physicians held the lowest PSC scores among different professions [25]. Meanwhile, another earlier study (cited in the work of Abdulkadir et al. [26]) mentioned that collaboration with other health professionals is a relatively new concept for pharmacists, suggesting that the amounts of participation and interaction between pharmacists and other staff are not adequate. Participation fosters knowledge creation needed for achieving safety. It should be emphasized that a pharmacist is a partner, and efforts should be paid to strengthen the relationships between all the partners in patent’s care. With regard to the finding that administrative staff most frequently had higher perceptions of PSC, based on the analysis several administrative implications can be recommended. First, administration may be attentive about the effectiveness of improving PSC by showing their heartfelt commitment on leading safety improvement. Researchers in this field suggested that administrators need to show their obligation through their actions and behaviors to enhance staff perception of PSC (backup behaviors) [27,28]. As such, some experts recommend to start with improving teamwork climate since teamwork climate mediates perception on safety climate [29].
The third objective was to identify predictors of staff perceptions of PSC. Our results are partially consistent with the results of a previous study [9] among nurses of King Fahad Medical City, which explained 32% of the variance in perceptions of PSC. The study identified six PSC predictors, including organizational learning, nonpunitive response to error, and hospital management support. A recent study from Oman [17] has reported that perception of PSC was predicted by multiple dimensions including teamwork within units, organizational learning, management support, and teamwork across units. The explained amount of variance was 46%, which is very close to our results.
5.1. Limitations and Strengths
The major limitation of our study concerns the degree to which study’s findings can be generalized to all hospitals in Qassim Region. This needs to be confirmed in the upcoming Qassim Cluster-based studies. Truth be known, PSC is not a simple paradigm; more studies might be required based on other validated instruments or newly constructed surveys. Furthermore, it should be noted that it is a provocation to assess the variance of predictors for multilevel modeling studies as regression coefficients per se might not be adequate [15]. Nonetheless, we believe that our study has strength aspects represented by the large sample size (n = 1460), in addition to the recruitment of different categories of healthcare providers in the study.
5.2. Practical Implications
Although patient safety is everyone’s concern, in practical terms it is not easy for every healthcare provider to understand this concept. Applying modifications, or even changes, to the healthcare systems remains vital to improve safety at various levels. Following our results, we recommend a number of simple strategies to enhance PSC in our settings. First, patient safety leadership and management are highly crucial in achieving PSC. As such, senior management in any healthcare facility is the one able to create PSC and build the necessary commitment to overcome any barriers that may affect patient safety. Second, it is important to build an environment that support staff to speak up freely about their concerns about any safety issues. This will foster reporting safety incidents, learning of lessons, and ultimately decreasing the recurrence of such mistakes in the future. Third, having feedback mechanisms that ensure providing information about any improvements made after safety issues helps in building a strong safety culture. Fourth, it is recommended to conduct additional national studies with bigger matched samples of pharmacists to increase the reliability and generalizability of our findings, and to precisely evaluate perceptions of other pharmacists working in different hospitals. Finally, and most importantly, to provide appropriate and adequate education and training for healthcare providers to manage and minimize potential risks and harms at all levels of care. Of special concerns are new hires and pharmacy professionals. Interprofessional education, multidisciplinary education, and continuing professional development are required. Both formal and informal methods of education can be utilized to build staff capacity to improve PSC.
6. CONCLUSION
Patient safety culture of any healthcare setting is not a simple paradigm; applying system changes to the healthcare systems remains vital to improve safety. It is important to build an environment that support staff to speak up freely about their concerns regarding any safety issues. Appropriate and constant education and training of healthcare staff, especially new hires and pharmacy professionals, will remain central to PSC.
CONFLICTS OF INTEREST
The authors declare they have no conflicts of interest.
AUTHORS’ CONTRIBUTION
MF, TI, AA, AE and FA contributed in study conceptualization and writing the original draft of the manuscript. MF contributed in data curation, formal analysis and writing. AA and FA contributed in project administration and supervised the project. AA and MF contributed in final review and editing of the manuscript.
FUNDING
No financial support was provided.
ACKNOWLEDGMENTS
The authors would like to acknowledge and thank the management of the following hospitals for facilitating data collection: KFSH, MCH, MHH and PSCCQ.
Footnotes
REFERENCES
Cite this article
TY  - JOUR
AU  - Ayed AlReshidi
AU  - Majeda Farajat
AU  - Tarek Ibrahim
AU  - Abdulaziz Alresheedi
AU  - Aliaa Elnefiely
AU  - Faisal Alforaih
PY  - 2020
DA  - 2020/06/22
TI  - Current Status and Predictors of Patient Safety Culture in Hospitals of Qassim Region, Saudi Arabia
JO  - Dr. Sulaiman Al Habib Medical Journal
SP  - 76
EP  - 82
VL  - 2
IS  - 2
SN  - 2590-3349
UR  - https://doi.org/10.2991/dsahmj.k.200618.001
DO  - 10.2991/dsahmj.k.200618.001
ID  - AlReshidi2020
ER  -