
The Control of Greenhouses Based on Fuzzy Logic Using Wireless Sensor Networks
Corresponding author. Email: aberdem@firat.edu.tr
- DOI
- 10.2991/ijcis.2018.125905641How to use a DOI?
- Keywords
- Wireless sensor network; Fuzzy logic; Internet of things; Smart greenhouse; Greenhouse climate control
- Abstract
Greenhouses cannot be easily controlled because their climate parameters are interrelated. This study contributes to increasing the quality and yield of greenhouses by saving time, energy, light and water consumption via measuring and controlling the climate parameters that are effective in forming climate factors in greenhouses. The greenhouse climate variables including temperature, relative humidity, soil moisture and light intensity were measured by a realistic sensor application. In this way, several sensor nodes, that belong to the nodal packages were distributed to a wireless sensor network (WSN) constructed in a star topology. In addition, the data obtained from the nodes, have been controlled and monitored with the fuzzy logic-based control strategy proposed as a developing, smart and remotely accessible Android-based interface. The proposed method has been analyzed, and its performances have been evaluated in terms of the benefits of both the user and the greenhouse.
- Copyright
- © 2019 The Authors. Published by Atlantis Press SARL.
- Open Access
- This is an open access article distributed under the CC BY-NC 4.0 license (http://creativecommons.org/licenses/by-nc/4.0/).
1. INTRODUCTION
Smart systems have been used in many areas in recent years as a result of the development of information technology. Many technologies are utilized in the operation of these systems. The most important element of the smart systems is the communication phase. The technologies used for this area are of great importance. The Internet of Things (IoT) may be essential for making people’s lives easier, saving energy, developing real-time applications and so on. One of the areas where the IoT is applied is smart agricultural practices. Thus, remotely accessible greenhouse applications have been developed for a long time in these fields [1].
Li et al. [2] designed a smart greenhouse control system based on Programmable Logic Controllers (PLCs) and used KingView software to meet the temperature, humidity and light requirements of the plants. In their study, they obtained an accurate control assessment using the fuzzy logic method to address the problem of controlling greenhouses and performance-measuring. Experimental results showed that the proposed greenhouse system provided better solutions for the controlling conditions of crops. Furthermore, the design control of the smart greenhouse provides stable performance, convenience and versatile characteristics, and the proposed system can be used in future applications. Lima et al. [3] controlled the amounts of relative humidity and temperature to improve the energy efficiency of air conditioning systems. In addition, they controlled the evaporation pressure using the existing technique based on the Evaporation Pressure Control Pressure (EPCP) method. Afterwards, they developed an evaporation pressure control approach based on the Evaporation Pressure Control Relative Humidity (EPCR) method. EPCR moves to another phase according to the evaporation pressure, the temperature and the relative humidity of the air. The results showed that the EPCR method improved the thermal comfort and energy efficiency of the indoor air.
Revathi and Sivakumaran [4] measured the temperature in a greenhouse and calculated the heating power of the greenhouse based on the energy balance of its basic volume using smart control devices. The simulation results of the greenhouse dynamics demonstrated the accuracy of their method without formulating the mathematical model of the system. Castellini et al. [5] developed a general architecture for automatic greenhouse control. They studied a preliminary model to predict the risk of immature basil mold infections on sweet basil. They designed three main innovation elements in the architecture: new types of sensors were used to obtain information about the state of the plants, prediction models were constructed using the information obtained, and automation techniques. Mat et al. [6] used a Wireless Moisture Sensor Network (WMSN) to provide efficient irrigation in precision agriculture. In their study, they defined the IoT and WMSN methods especially for agricultural applications in a greenhouse environment. This study explained and proved the feedback control method for the irrigation of greenhouse plants. They performed a test to check whether the performance of the two methods differed. The methods used for irrigation were either program-based or feedback-based. The irrigation program supplied water for the plant at certain times. The feedback-based irrigation method irrigated the plant when the moisture or wetness level reached a threshold value, in which a saving of 1 500 mL/day/tree has been determined as a result of several tests. Pahuja et al. [7] presented an implementation of a rule-based temperature control system that used general Virtual Instrumentation (VI) technology with a wireless sensor network (WSN). With the help of software developed on the Graphical User Interface (GUI) installed on the host computer, the temperature was constantly monitored and intelligently controlled. Azaza et al. [8] developed a method that contains fuzzy logic techniques using temperature and humidity values for controlling the energy consumption and water usage. The method they developed provided 22% savings on energy efficiency and 33% savings on water use. Manonmani et al. [9] controlled the temperature and humidity values of a greenhouse by developing an artificial neural network (ANN) model to produce efficient and high-quality pepper cultivation in a greenhouse environment. It was assumed that the temperature of the greenhouse was between approximately 32°C and 35°C for winter conditions and the moisture value was between 12 and 8 g/kg. According to these assumptions, it was observed that the quality and the efficiency of pepper grown in the greenhouse increased in the controlled ANN design using a nonlinear autoregressive time series. Maurya and Jain [10] proposed the use of a remote-control method for irrigating farms using a fuzzy logic control system with the temperature and humidity data obtained from the sensors they installed, which aimed to facilitate and improve the control of the indoor climate parameters in greenhouses.
In this study, a fuzzy-based control system has been proposed to manage energy, light and water consumption more efficiently and economically in the greenhouse. Thanks to this system, users can be kept informed about the status of the greenhouse.
The features of the proposed method are as follows:
Effective control over the entire greenhouse area is provided by nodal packages containing evenly deployed sensor nodes of different types installed in the greenhouse using a star network topology.
Sensors are used to provide data input to the fuzzy logic system.
The temperature, light and moisture control of the greenhouse is achieved by a remote-control system. In contrast to other studies, this study also controlled factors such as heating, cooling, irrigation, lighting and shading in a greenhouse.
This study collected temperature, relative humidity, soil moisture and light intensity over a four-month period (between 01.12.2017 and 31.03.2018) from the nodal packages through the WSN formed in the greenhouse. The data obtained were sent to a coordinator node and then transferred to the database formed in the computer environment via serial communication. The data stored in the database were used as the input data of the proposed fuzzy logic system. In the fuzzy logic system, output values were generated according to the input values based on the rule tables determined by an expert [11]. Based on the output values generated, the users were able to perform remote control of the greenhouse via a mobile Android-based application.
In the proposed fuzzy logic system, the data obtained from sensors were used for the state variable of the system while the heating, cooling, irrigation, lighting and shading factors for controlling the greenhouse were generated as control variables of the system. In such a system, it is important to establish the relationship between state and control variables properly. Rule tables created by experts were used to establish this relationship and thus generate appropriate outputs.
The definitions of the study’s sections are as follows: Section 2 explains greenhouses and greenhouse control units. Section 3 gives the details about the traditional methods and techniques. Section 4 discusses the general architecture of the smart greenhouse system created. Section 5 outlines the suggested fuzzy logic system and Section 6 presents the experimental findings obtained from the application in detail. Section 7 explains the mobile application developed for remote control of the greenhouse. Section 8 compares the proposed system with eight different studies about smart greenhouse systems. Finally, Section 9 concludes the proposed work.
2. GREENHOUSES AND THEIR CONTROL UNITS
Greenhouses are factories where vegetable production is carried out. They function as industrial scales and the advanced management rules are applied on them. The provision of a suitable climate in the greenhouse primarily depends on the greenhouse construction and equipment. Greenhouse equipment, i.e. environmental units, is designed according to the size and volume of the greenhouse. Greenhouse environmental units consist of heating, ventilation, cooling, shading, and fogging and irrigation–fertilization systems [12]. In the greenhouse, air temperature, relative humidity, light intensity and soil moisture are effective climate factors. A sample greenhouse is shown in Figure 1.
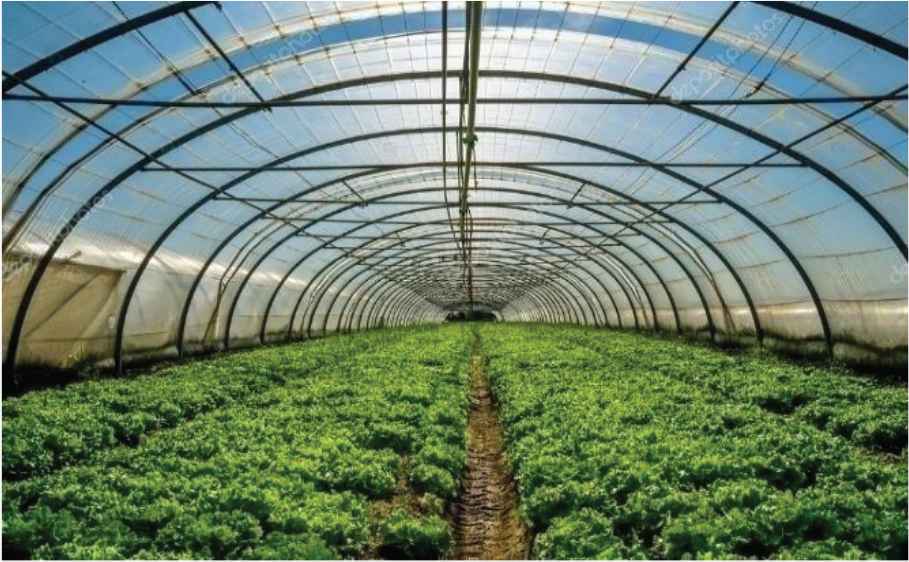
The view of a sample greenhouse.
The heating of the greenhouse is carried out by applying different heating methods according to the type of plants being cultivated, the patterns of the crops and the climate conditions. Heating is not a technical problem today, but the real problem is whether the heating method used is economical. Rising energy costs due to an increase in energy usage, are forcing structural changes in greenhouse cultivation and the use of automation and control technology. The manufacturer should check the short-term and long-term costs.
One of the essential factors for greenhouses is light. Photosynthesis has a strong and direct relationship with light. Several models are presented to explain this relationship. For instance, it has been suggested that a light intensity of about 100–250 μmol/m2/day/kg of tomato would be sufficient [13].
On the other hand, the shading system is used in cases where the light intensity outside the greenhouse is too high or where it is desired to slow down the growth process by reducing the light intensity.
If the plants are given too little or too much water than required, it causes a drop in the yield quality. This leads to a failure in meeting the expected benefits from the greenhouses that require very large investments and high inflows, and therefore causes some loss of investment [1].
Greenhouses are ventilated for various reasons. A greenhouse is ventilated so that the outside air replaces the air inside the greenhouse, which is rich in oxygen and poor in carbon dioxide. Plants need carbon dioxide for growth, thereby the ventilation system must provide carbon dioxide entrance into the greenhouse, and balance the internal temperature of the greenhouse, which means reducing high temperatures caused by excessive sunlight exposure. In addition, relative humidity in the greenhouse must be balanced [13].
3. CONVENTIONAL METHODS USED IN GREENHOUSES
Because the financial yields of greenhouses depend on the annual production volume and cost, equipment such as air conditioners used in the greenhouse should be operated sensibly to achieve the expected production and increase the quality of the product. In order to achieve this, energy and climate management in the greenhouse should be controlled. Heating, cooling, shading, irrigation and lighting are the climate parameters that need to be controlled.
In the calculations for heating greenhouses, a heat-balance conduction should be taken into consideration for heat losses. Calculations are carried out by noting down the known values on Figure 2 [14].

The heat loss chart.
The value of Zd depends on whether the heating is continuous or not. This represents an increase in heat capacity and should be considered in order to bring the cooling and the heating system back to their original temperature in the event of intermittent heating of the building. Zr is the height of the building floor to be heated. Zh indicates the direction the structure to be heated is facing in. This value is fixed at five because the greenhouse faces in a northerly direction.
The features of the greenhouse are such that compared to a comfort temperature of 25°C, the measured temperature was −10°C and the soil temperature was −4°C. The dimensions were 7 × 25 × 7 m3, and the greenhouse had an outer metal door with dimensions of 1 × 2.1 m2. It faced in a northerly direction and it was constructed of plastic (pvc). The natural heat loss from the doors, walls and ceiling was 5 476 kcal/h with a Zd value of 7%. The value of Zr is not calculated because the greenhouse is a single-story building, while the Zh value was 5% and the total increase amount (Z) was 1.12%. The heat energy was calculated to be 6 134 kcal/h by using the natural heat loss and the total amount of increase, with a further 2 229 kcal/h calculated by using the field and total heat transfer coefficients. The total heat energy required came to 8 363 kcal/h, accordingly, the amount of heat the greenhouse needs is calculated to be 9.72 kW using the table in Figure 2.
Cooling by evaporation is generally used for cooling greenhouses. Temperature and humidity are effectively monitored while cooling by evaporation. The most commonly used evaporation system is the Fog/Mist system. This system is based on spraying small high-pressure droplets (2–60 μm droplet diameter) [15]. The amount of water to be sprayed onto the environment is calculated by using a psychrometric diagram according to the desired humidity, based on the maximum temperature and minimum humidity determined by the greenhouse’s volume and climate conditions of the geographical region where the greenhouse is located.
Shading systems prevent unwanted light radiation and do not allow photosynthetic active radiation, which is essential for photosynthesis [15]. Shading is usually provided by opening and closing the top windows which are constructed for cooling or ventilation [16].
For irrigation systems, the water requirement is usually measured according to the reading values on the tensiometers placed on plant roots. It is accepted that the water requirement is successfully met over the pressure range of 15–20 kPa [17].
For lighting systems, the values read from the Light-dependent resistance (LDR) sensors are generally used, and lighting is achieved by controlling the amount of shading film and light fill according to the light saturation points of the plants [18]. The LDR is a passive sensor, and a type of variable resistance. LDR provides an output corresponding to varying resistor values in the circuits. The LDR acts as a sensor because it performs this change as a result of a physical change that occurs in the external environment. Light has an intensity characteristic that can be measured in a number of different ways. In this study, the amount of light was measured according to the change in the resistance value between the two ends of the LDR. By establishing a resistance circuit, the light level detected (analog value) from LDR has been converted to a numerical value. This resistance variation affects the light intensity, and the LDR resistance formula is given in Equation 1. RLDR is LDR resistance, Rnight is the LDR resistance without light, L is the light intensity in Lux and b is the constant that depends on the metallic characteristic of the material. In addition, the light intensity in Lumens at a distance d from the light source can be calculated as shown in Equation 2. In this way—due to the fact that the value in Lux produced in the A2A7Y light sensor module unit follows the listed formula—the L value (in Lux units) takes the light intensity measurement into consideration.
4. THE SMART GREENHOUSE SYSTEM ARCHITECTURE
In this study, a 7 × 25 × 7 m3 greenhouse with a cradle roof covered with plastic roofing material in Elazig, Turkey was selected as the application environment.
The type and characteristics of the greenhouse used are shown in Table 1 and a view of the greenhouse is shown in Figure 3. Tomato was selected as the crop to be grown in the greenhouse. The optimum temperature for tomato growing is approximately varied from 25°C to 27°C, and the humidity value is in the 50% –70% range. The optimization of the fuzzy control system, which is designed by considering the climate conditions required for the growth of tomatoes, focuses on the correlation state of the input parameters. Combinations of control decisions were selected appropriately.
| Greenhouse type | Width | Length | Height | Cover material |
|---|---|---|---|---|
 Wide Span | 7 m | 25 m | 7 m | Plastic |
The properties of the greenhouse.
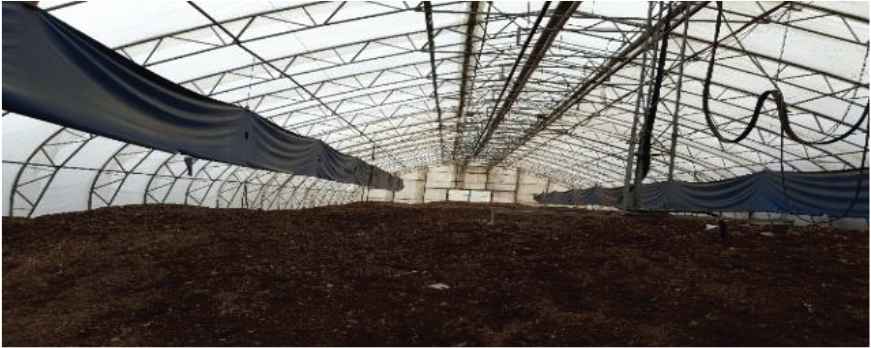
A view of the greenhouse.
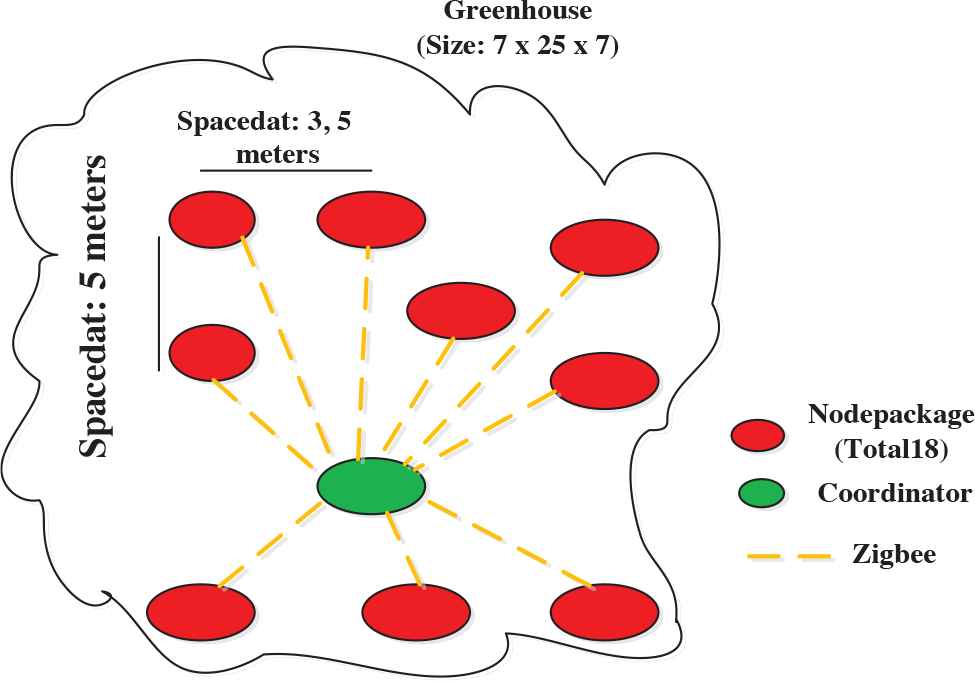
In this study, the nodal packages—designed as part of the WSN formed in the greenhouse—transmitted the data to the coordinator Xbee node using the Zigbee protocol. It is an application developed to enable remote control of the greenhouse by the user. The designed WSN architecture is shown in Figure 4. The used nodal packages were deployed as a star topology meaning they can only send data to the coordinator node. The contents of a nodal package and a block diagram of the connection to the coordinator node Xbee are shown in Figures 5 and 6, respectively.
The block diagram of the smart greenhouse system.
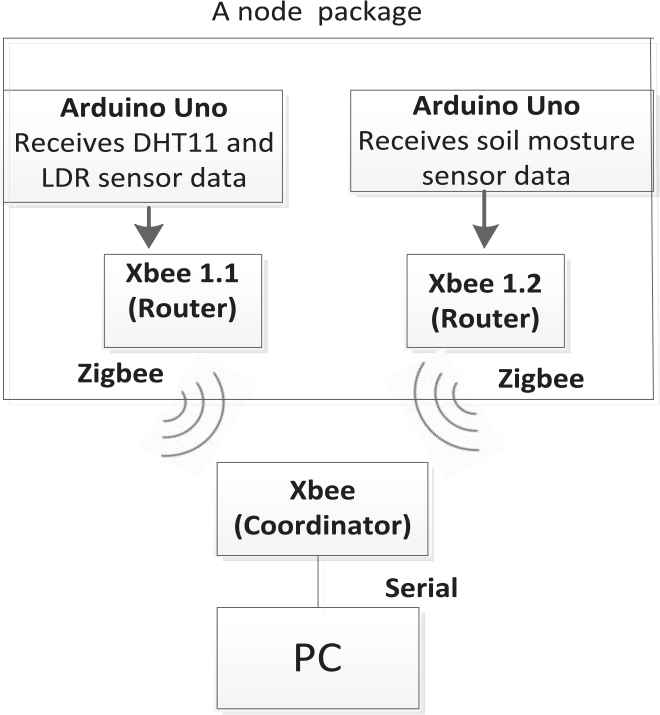
The network block diagram for a nodal package.
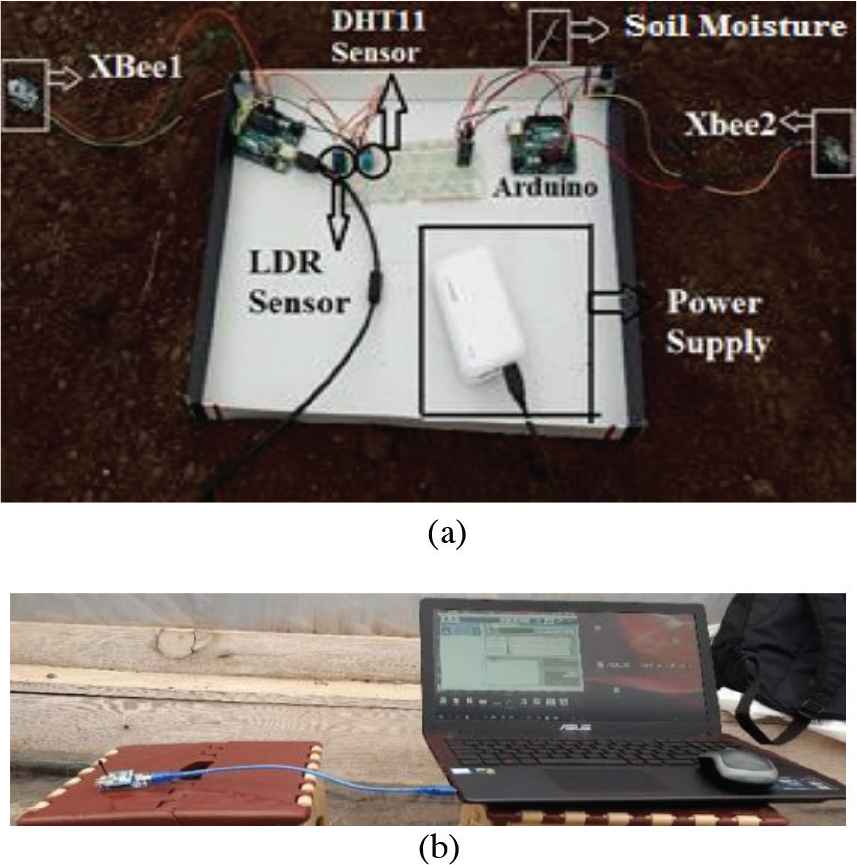
The setup components: (a) The contents of a nodal package, (b) The coordinator Xbee node.
According to the results obtained by processing the collected data in the fuzzy logic control unit.
Over four months (between 01.12.2017 and 31.03.2018), data on the temperature, relative humidity, soil moisture and light intensity were obtained using sensors connected to the nodal packages placed in the greenhouse and subsequently collected in the coordinator Xbee node. The coordinator Xbee node calculated the average of the data obtained from the nodal packages and presented this data as an input to the fuzzy logic control system created by recording this data in the database. The user could remotely manage the greenhouse manually or automatically via the mobile interface developed by calculating the output value corresponding to the input data to the fuzzy logic system. The block diagram of the smart greenhouse system developed is shown in Figure 7.
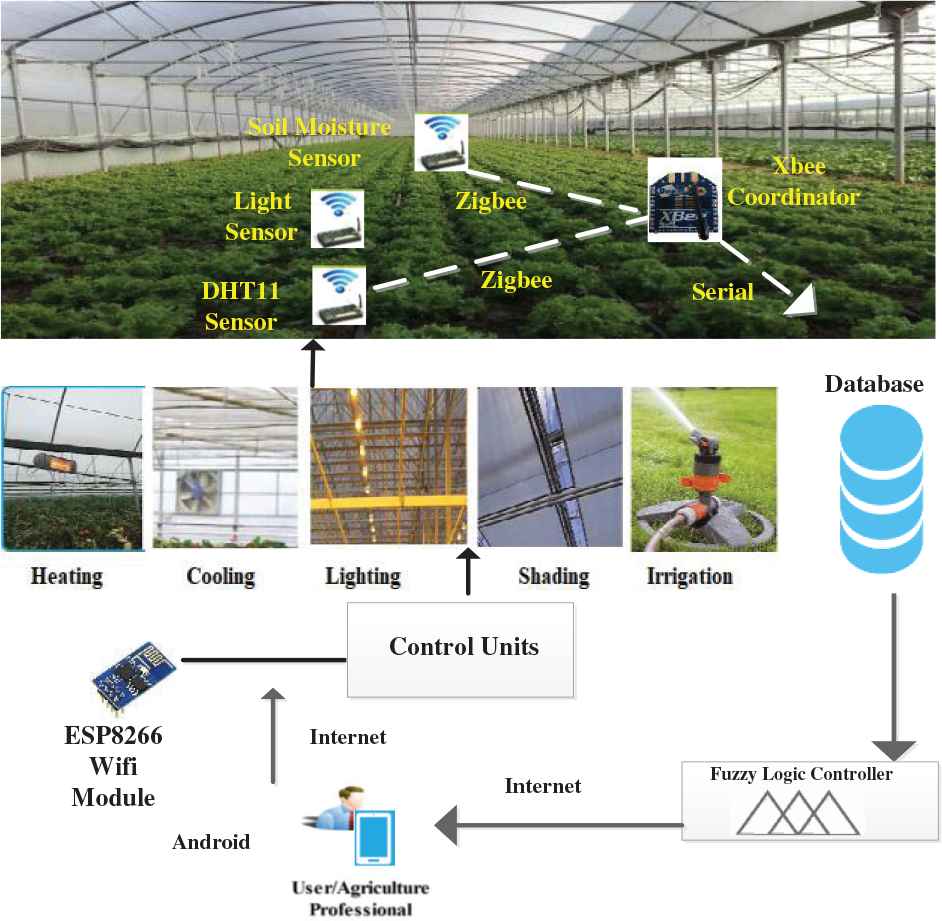
The block diagram of the smart greenhouse system.
Some variable conditions, such as temperature, relative humidity, light intensity, soil moisture etc. must be monitored continuously in greenhouses. For this, 18 nodal packages were placed in the greenhouse at equally spaced intervals. Nodal packages consisted of the sensors to measure the value, an Arduino Uno card to process the values read from the sensors, an Xbee module to transfer the received data to the coordinator node and a power supply. WSN facilitates both sensing and communication requirements. Small sensor nodes collectively form a sensor network which is used for the remote wireless communication [19].
DHT11 (Digital Humidity and Temperature) sensor senses the temperature and humidity of the surrounding and gives a calibrated digital signal output [20]. A soil moisture sensor (YL69), which is an electrical resistance sensor, was used to determine the moisture content around it. If the amount of water in the soil is high, then resistance will be low, thus, more current will pass through it [21]. The LDR light sensor module (A2A7Y) was used to determine the light intensity of the greenhouse. LDR light sensors are low-priced and have both an analog output and a digital output. In the presence of light, the resistance of the LDR will decrease according to the intensity of the light [22]. The data read from the sensors were transferred to the Xbee S2C sensor nodes, which function as a router connected to the Arduino Uno cards. The Router Xbee nodes transferred the data to the coordinator Xbee node, which is connected serially to the computer via the Zigbee protocol. Xbee modules are embedded solution modules that provide wireless end-point connectivity to devices. These modules use the IEEE 802.15.4 networking protocol for fast, point-to-multipoint, or peer-to-peer network communications. They use the standard Zigbee protocol because it is designed for high-efficiency applications requiring low time lag and predictable timing communication [23]. Zigbee is a global, standards-based wireless solution that can comfortably and economically control a wide range of devices to enhance comfort, safety and convenience for consumers [24]. The content of a nodal package is shown in Figure 6(a) and the coordinator node is shown in Figure 6(b).
The flow chart of the system is shown in Figure 8. The steps applied in the flow chart of the system are listed as follows: The flow chart of the system.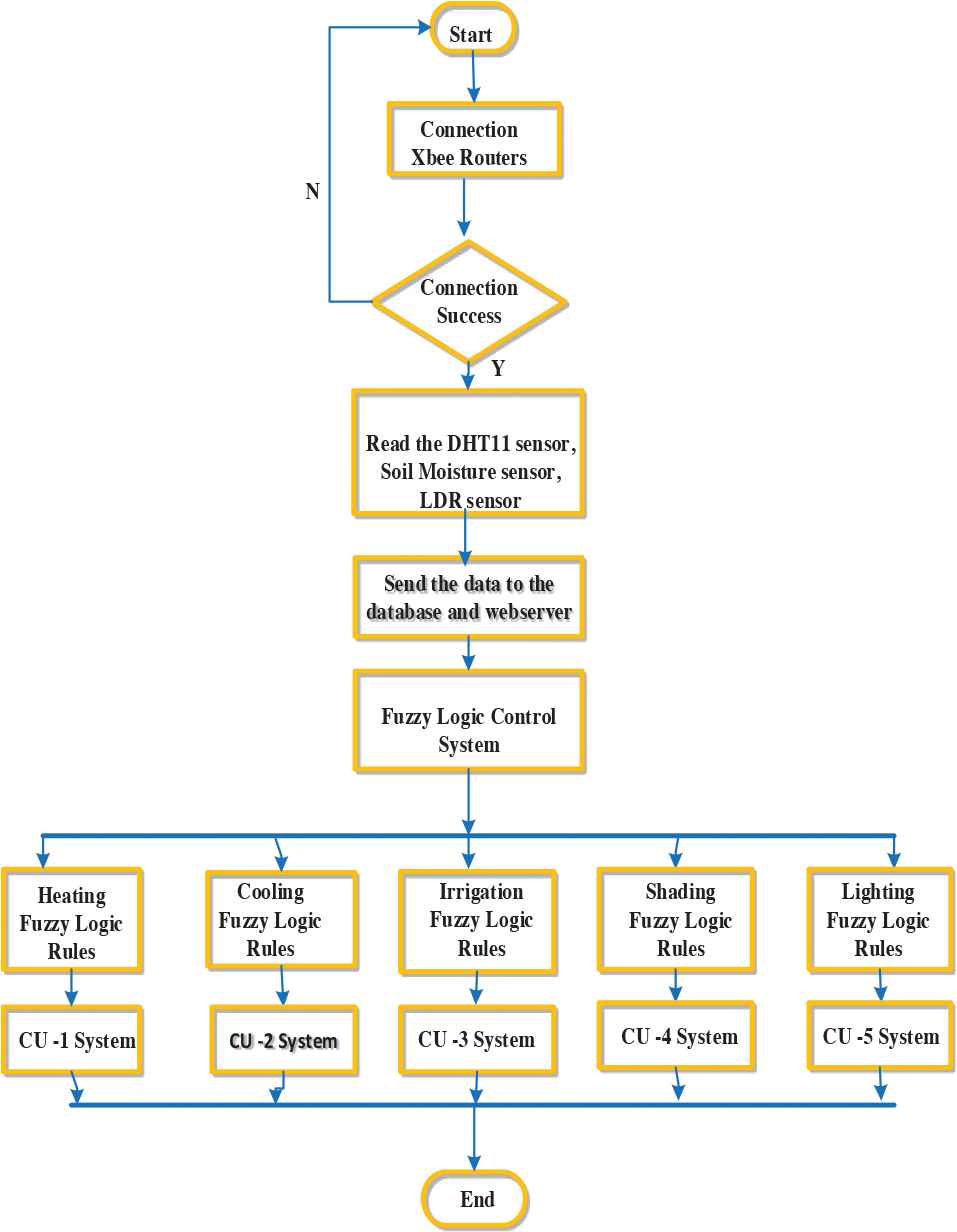
Step 1. Start
Step 2. The connection is established with the Router Xbee nodes. Serial number information of the Xbee modules is in the Serial Number High (SH) and Serial Number Low (SL) sections. The serial number information of the last device communicating with the coordinator module is entered in the Destination Number High (DH) and Destination Number Low (DL) sections. The connection of the coordinator Xbee module to the computer is provided using a serial communication. After entering the interfaces of the modules through the X-CTU software, the serial number information of the last device is written in the DH and DL sections in the coordinator.
Step 3. A connection is checked every 60 seconds. If the connection is successful, go to Step 4, otherwise go to Step 1.
Step 4. Read data from the sensors connected to the Arduino Uno cards and collect them on the Xbee router nodes.
Step 5. The Xbee Router nodes transfer the data obtained to the coordinator Xbee node by using the Zigbee protocol and then the coordinator Xbee node sends the collected data to the database via serial communication.
Step 6. The data taken from the database is sent to the generated fuzzy logic system.
Step 7. Output values are calculated by applying the rule tables according to the input data.
Step 8. End.
Approximately 52 000 four-dimensional vectors including a total of 208 000 values about the temperature, relative humidity, soil moisture and light intensity were measured hourly from 18 nodal packages evenly placed in the greenhouse between 01.12.2017 and 31.03.2018. By taking the average of the data received from the evenly distributed nodal packages, an overall value was calculated for the greenhouse each hour. Calculated values were recorded in the database. Because the temperature difference is high between daytime and nighttime in the implementation environment, data were calculated separately for each. The data measured during the hours between 06.00 and 17.00 hours were used as daytime data, while data measured between 18.00 and 05.00 hours were used as nighttime data. By using the values measured each day at the determined time intervals, the average values of the daytime and nighttime data were taken, and two average data sets—daytime and nighttime—were calculated for each day.
Later, using these values, daytime and nighttime average values were calculated monthly. The calculated values were recorded in a MySQL environment.
5. FUZZY LOGIC CONTROL OF THE SMART GREENHOUSE SYSTEM
This section explains the proposed solution for controlling climate parameters (temperature, relative humidity, soil moisture content and light intensity) of the greenhouse. The model was implemented so that the membership functions of the state–control variables of the system were configured according to the fuzzy logic table generated by an expert. Fuzzy clusters were determined based on deep human expertise and knowledge. Fuzzy logic is a soft computational method used for nonlinear, complex situations involving difficult or uncertain modeling information. It works according to interval values, such as very long, long, medium, short and very short, as in human logic [25]. In a universe of discourse represented by X, a fuzzy subset A of X is a set defined by a membership function fA(x) that maps each element x in X to a real number in the closed interval [0, 1]. The triangular fuzzy numbers are often used to characterize the fuzzy values of data and linguistic terms used in fuzzy reasoning [26].
The fuzzy logic structure can be fundamentally divided into the steps shown in Figure 9. The fuzzification interface is the process of converting the input information taken from the system into symbolic values that are linguistic qualifiers. A decision-making unit is a process that generates and maps output from the input through the use of fuzzy logic. Fuzzy rules are generated with an if-else condition, which has a state and target to address the control of the output according to fuzzy logic rules. Defuzzification is achieved by applying various methods such as maximum membership and averages from the fuzzification results to obtain net (numerical) values [27].
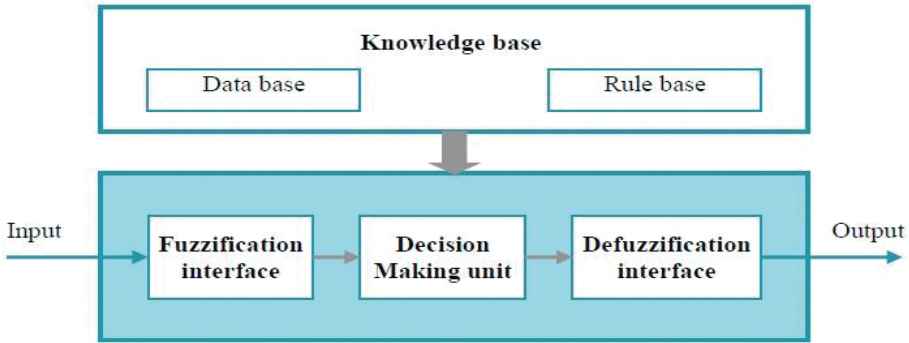
The fuzzy logic structure.
The fuzzy logic control system used in the proposed system consists of four inputs and five outputs. Input data were temperature (ºC), relative humidity (%), soil moisture (%) and light intensity (Lux), while output data were heating (W), cooling (μm), irrigation (Lt), lighting (Lux) and shading (cm). The inputs and outputs of the system and its properties are shown in Table 2. In this table, VL is Very Low, L is Low, M is Medium, H is High and VH is Very High.
| Variables | Value Range | Linguistic Variables | |
|---|---|---|---|
| State | Temperature | −10–50°C | VL, L, M, H, VH |
| Relative Humidity | 0–100% | VL, L, M, H, VH | |
| Soil Moisture | 0–100% | VL, L, M, H, VH | |
| Light Intensity | 0–20 000 lux | VL, L, M, H, VH | |
| Control | Heating | 0–10 kW | VL, L, M, H, VH |
| Cooling | 0–25 μm | VL, L, M, H, VH | |
| Irrigation | 0–45 Lt | VL, L, M, H, VH | |
| Lighting | 0–20 000 lux | VL, L, M, H, VH | |
| Shading | 0–250 cm | VL, L, M, H, VH |
General properties of the suggested fuzzy logic system.
Five control units were determined to define levels related to the state and control variables. The general structure of the units that were developed is shown in Figure 10.
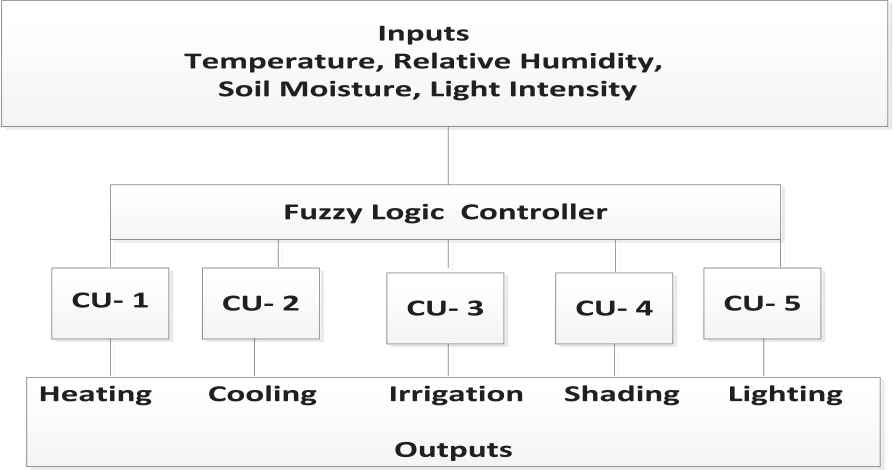
The general structure of the system.
Membership functions are the most fundamental difference between traditional logic and fuzzy logic. By using membership functions, the weights of the state and control variables are expressed continuously in the range of 0–1.
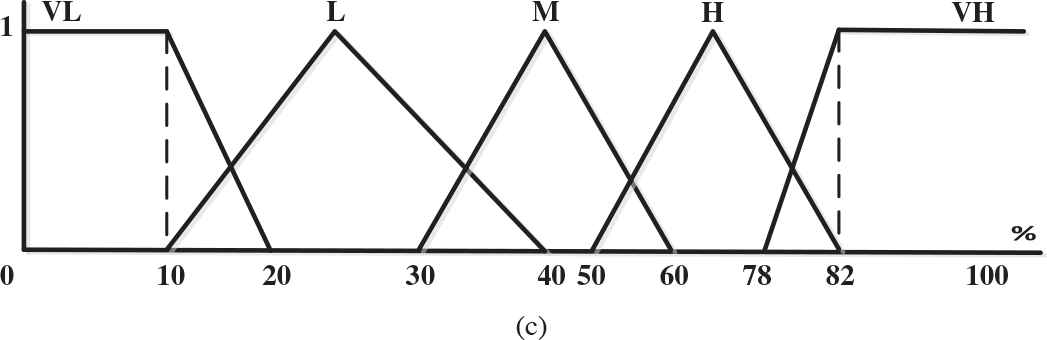
The fuzzy logic control units of the state and control variables of the system are shown in Figure 11. The input membership functions used are shown in Figure 12 while the output membership functions are shown in Figure 13.
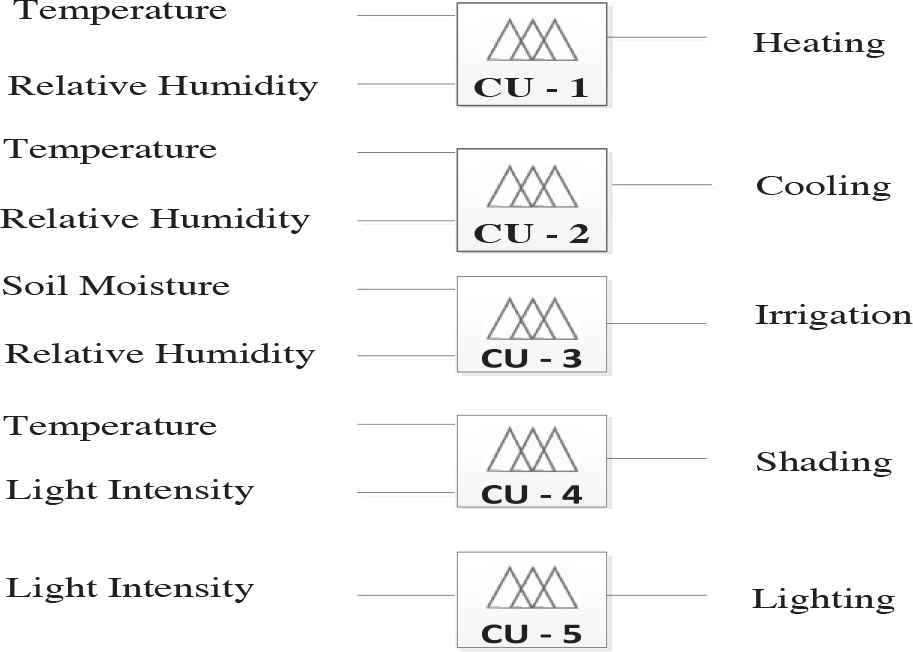
Fuzzy logic control units.

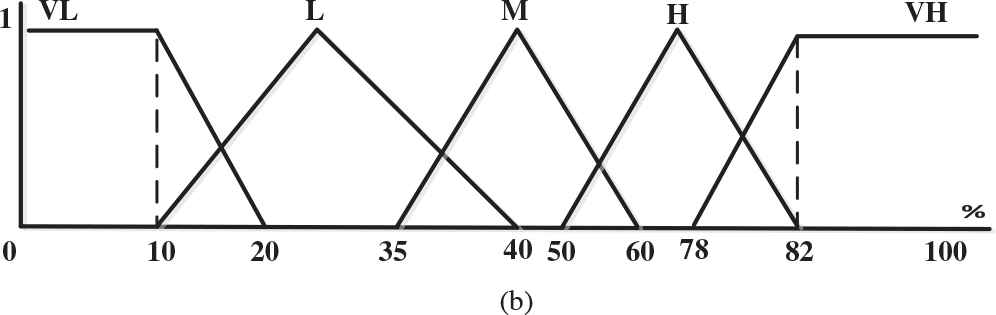
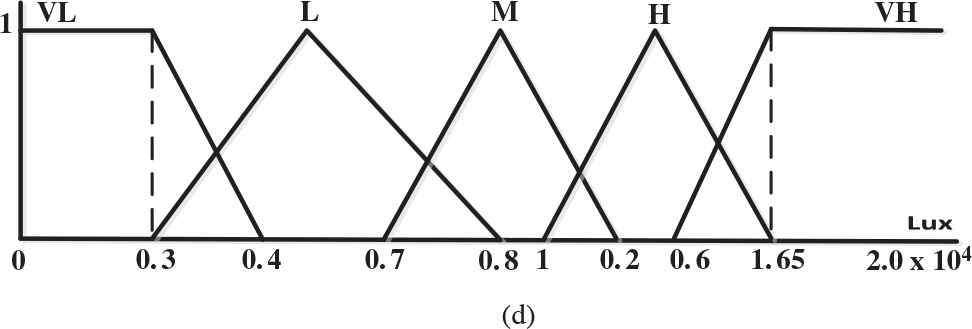
State variables used: (a) Temperature, (b) Relative humidity, (c) Soil moisture, (d) Light intensity.
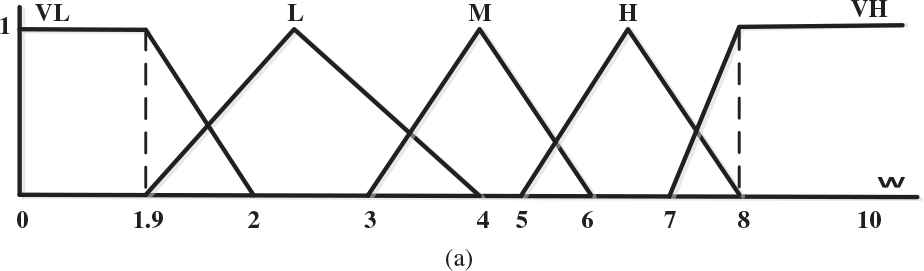
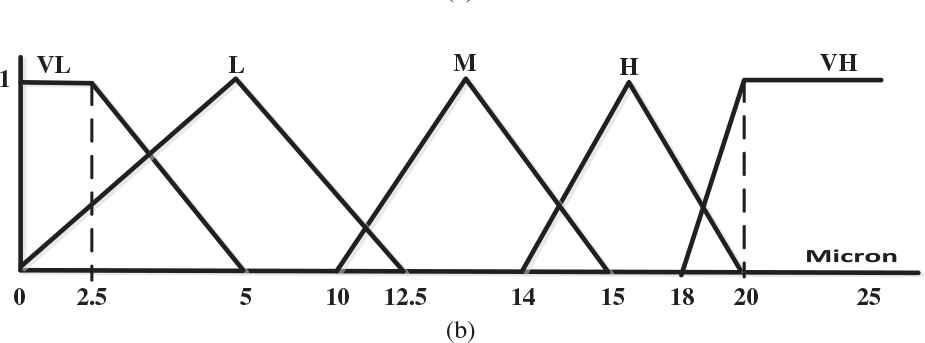
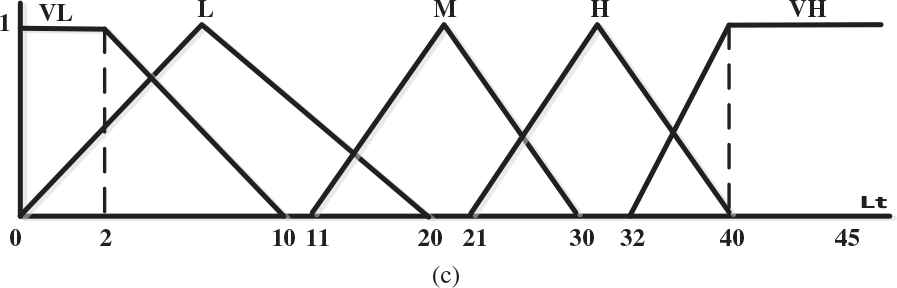
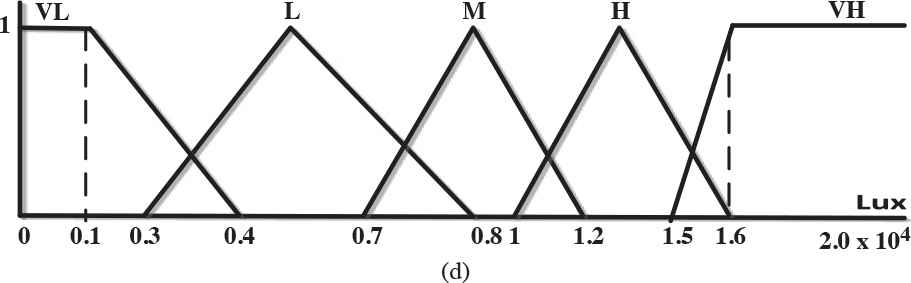
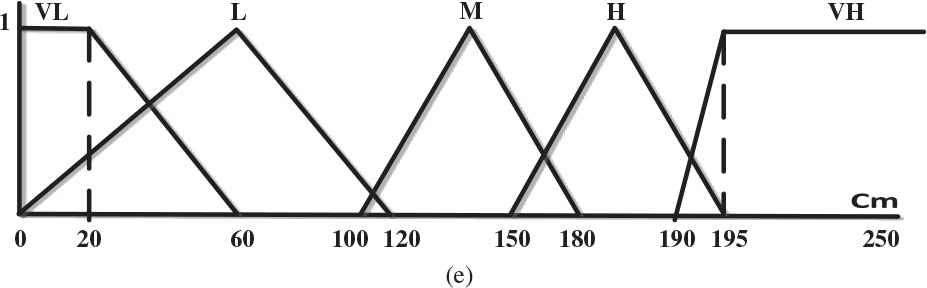
Control variables used: (a) Heating, (b) Cooling, (c) Irrigation, (d) Lighting, (e) Shading.
After defining membership functions, the next step is to set up a rule base where the control variable is set according to the state variable. The rules set up for the inputs and outputs are shown in Table 3. According to this figure, the effects of temperature and relative humidity values on the CU-1 heating system are shown in Table 3(a), the effects of temperature and relative humidity values on the CU-2 heating system are shown in Table 3(b), the effects of soil moisture and relative humidity values on the CU-3 irrigation system are shown in Table 3(c), the effects of temperature and light intensities on the CU-4 shading system are shown in Table 3(d) and the effects of light intensities on the CU-5 lighting system are shown in Table 3(e).
| RH | VL | L | M | H | VH |
|---|---|---|---|---|---|
| T | |||||
| VL | VH | VH | H | H | H |
| L | H | H | H | M | M |
| M | M | M | M | M | L |
| H | L | L | L | L | L |
| VH | VL | VL | VL | VL | VL |
(a) Temperature and relative humidity input values for the heating (CU-1) effect
| RH | VL | L | M | H | VH |
|---|---|---|---|---|---|
| T | |||||
| VL | VL | VL | VL | VL | VL |
| L | L | L | L | L | L |
| M | L | M | M | M | M |
| H | M | M | H | H | H |
| VH | H | H | H | VH | VH |
(b) Temperature and relative humidity input values for the cooling (CU-2) effect
| RH | VL | L | M | H | VH |
|---|---|---|---|---|---|
| SM | |||||
| VL | VH | H | H | M | VL |
| L | VH | H | M | M | L |
| M | H | H | M | M | M |
| H | H | M | M | L | VL |
| VH | M | M | L | L | VL |
(c) Soil moisture and relative humidity input values for the irrigation (CU-3) effect
| LI | VL | L | M | H | VH |
|---|---|---|---|---|---|
| T | |||||
| VL | VL | VL | L | M | M |
| L | VL | L | L | M | H |
| M | VL | L | M | M | H |
| H | L | L | M | H | H |
| VH | L | M | M | H | VH |
(d) Temperature and light intensity input values for the shading (CU-4) effect
| LI | VL | L | M | H | VH |
|---|---|---|---|---|---|
| VH | H | M | L | VL |
(e) Light intensity input value for the lighting (CU-5) effect
Fuzzy logic rule tables
6. EXPERIMENTAL RESULTS
6.1. Findings
The values obtained from the nodal packages on the network by calculating the average of the data are shown in Figure 14. When these data are given as state variables to the fuzzy logic system, the outputs from the control units are shown in Figure 15. Considering average nighttime and daytime values, the values between 06.00 hours and 17.00 hours were accepted as daytime values while the values between 18.00 hours and 05.00 hours were accepted as nighttime values and the average nighttime and daytime values for each day were calculated.
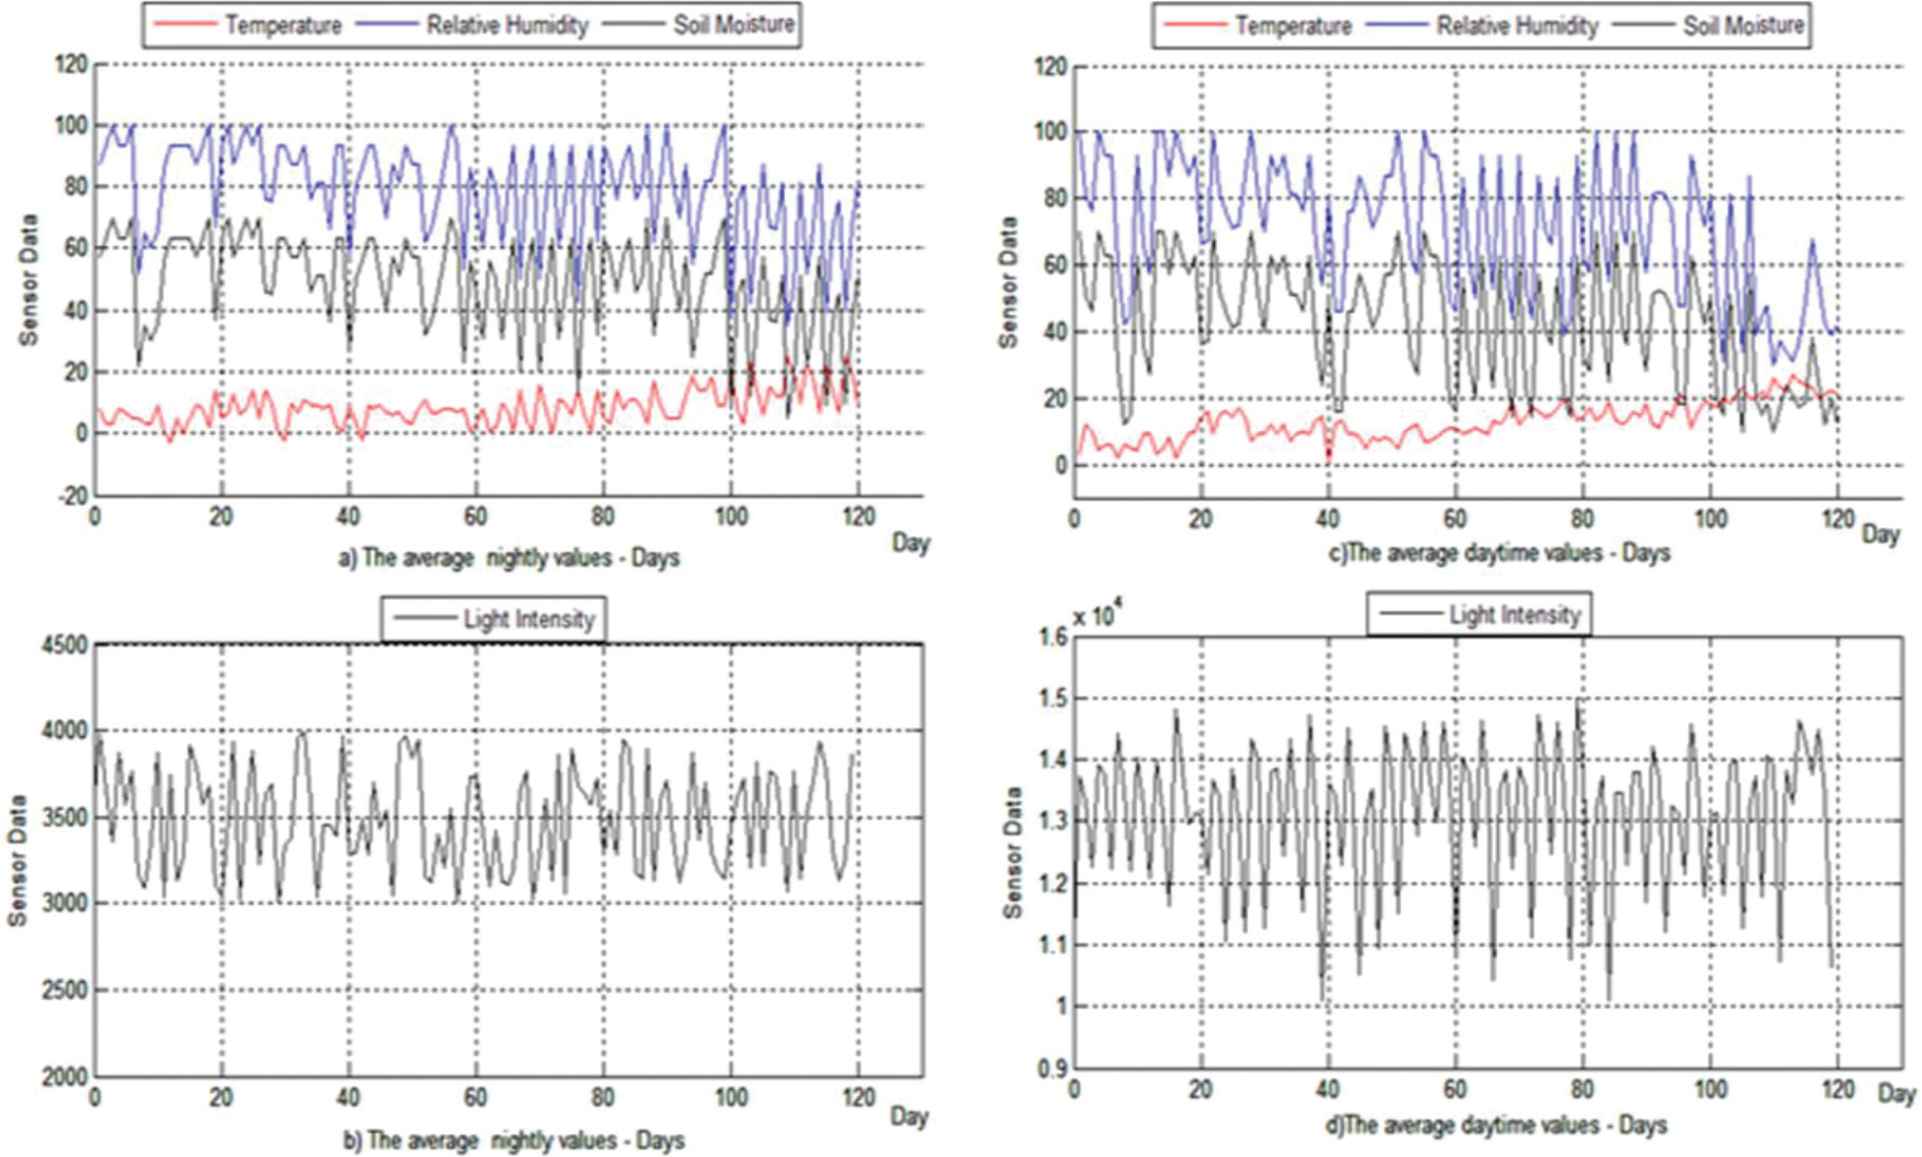
Illustration of the daily input data: (a) The graph of average temperature, relative humidity and soil moisture computed at night, (b) The graph of average light intensity computed at night, (c) The graph of average daytime temperature, relative humidity and soil moisture, (d) The graph of average daytime light intensity.
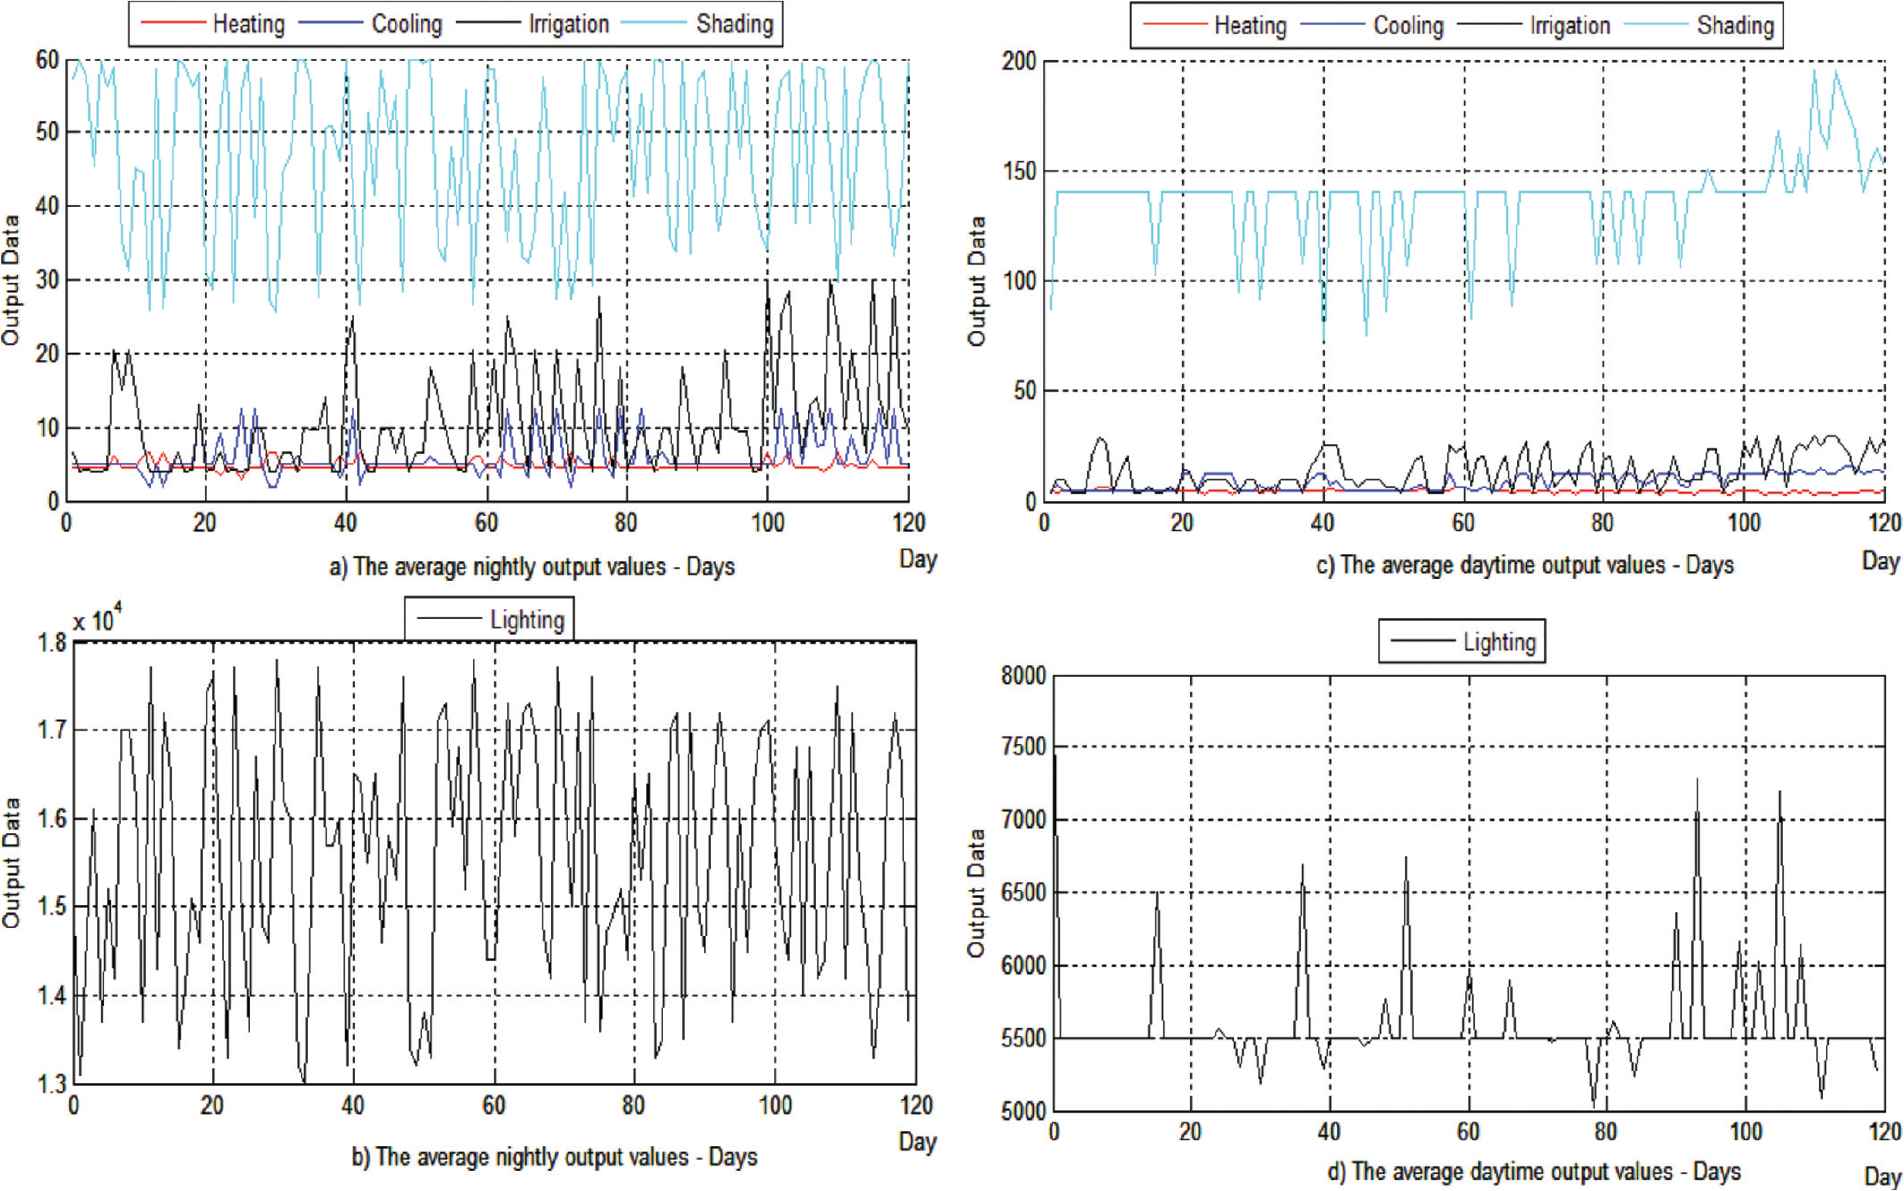
Illustration of the daily output data: (a) The graph of average heating, cooling, irrigation and shading at night, (b) The graph of average lighting at night, (c) The graph of average daytime heating, cooling, irrigation and shading, (d) The graph of average daytime lighting.
It was observed that according to Figure 14(a), the average night temperature value varied between −3°C and 15°C, the relative humidity value changed between 100% and 40%, the soil moisture value was between 70% and 20%; according to Figure 14(b), light intensity varied between 3 000 and 4 000 lux; according to Figure 14(c), the average daytime temperature was between 3°C and 27°C, the relative humidity was between 100% and 30%, and the soil moisture value was between 70% and 15%; according to Figure 14(d), the light intensity value changed between 10 000 and 15 000 lux.
According to Figure 15(a), the average amount of heating at night was between 3 and 7 kW, the amount of cooling was between 1 and 13μm, the amount of irrigation was between 4 and 30 L, the amount of shading was between 25 and 60 cm; according to Figure 15(b), the lighting amount was between 13 000 and 18 000 lux and according to Figure 15(c), the daytime average heating amount was between 3 and 6 kW, the cooling amount was between 5 and 15μm, the irrigation amount was between 4 and 30 L and the shading amount was between 85 and 195 cm; according to Figure 15(d), the amount of lighting changed between 5000 and 7000 lux.
Table 4 shows the output units and output values of the fuzzy logic control system, which has been formed according to the average daytime and nighttime values calculated on a monthly basis.
| Inputs | Outputs | ||||||
|---|---|---|---|---|---|---|---|
| (Months) | (Temperature, Relative Humidity, Soil Moisture, Light Intensity) | Heating Methods | CU-2 (μm) | CU-3 (l) | CU-4 (cm) | CU-5 (lux) | |
| Heat loss-gain | CU-1 (kW) | ||||||
| December Night | T = 3.7°C RH = 83.1% SM = 55.7% LI = 3 512 lux | 7.01 | 4.58 | 5.42 | 8.99 | 53.7 | 15 400 |
| December Daytime | T = 7.2°C RH = 82.8% SM = 50.1% LI = 11 422 lux | 6.62 | 4.39 | 5.17 | 9.9 | 103 | 6 930 |
| January Night | T = 5.9°C RH = 83.4% SM = 67.9% LI = 4 200 lux | 6.84 | 4.5 | 5.36 | 4,49 | 58 | 13 000 |
| January Daytime | T = 8.2°C RH = 74.3% SM = 42.4% LI = 10 768 lux | 6.51 | 4.23 | 5.5 | 10 | 82 | 8 020 |
| February Night | T = 5.9°C RH = 81.1% SM = 62.7% LI = 4 555 lux | 6.84 | 4.28 | 5.08 | 4.73 | 62 | 13 200 |
| February Daytime | T = 13.9°C RH = 66.9% SM = 42.5% LI = 10 467 lux | 5.85 | 2.84 | 12 | 10.5 | 136 | 8 520 |
| March Night | T = 14°C RH = 67.6% SM = 40.1% LI = 4 222 lux | 5.8 | 2.8 | 12.5 | 10.8 | 60 | 13 050 |
| March Daytime | T = 18.2°C RH = 56.6% SM = 23.4% LI = 10 680 lux | 5.3 | 2.1 | 12.8 | 20.5 | 140 | 8 160 |
Average input and output values that were measured as monthly.
When the average nighttime values for December were calculated such that the temperature was 3.7°C, the relative humidity was 83.1%, the soil humidity was 55.7% and the amount of light was 3512 lux; the corresponding heating value was 4.58 kW, the cooling value was 5.42 μm, the irrigation value was 8.99 L, the shading value was 53.7 cm and the amount of lighting was 15 400 lux. Considering these values in the heat loss-gain method, the heating value was calculated to be 7.01 kW.
The average daytime values for December were as follows: the temperature was 7.2°C, the relative humidity was 82.8%, the soil moisture was 50.1% and the amount of light was 11 422 lux; the corresponding heating value was 4.39 kW, the cooling value was 517 μm, the irrigation value was 9.9 L5.17 the shading value was 103 cm and the amount of lighting was 6 930 lux. Considering these values in the heat loss-gain method, the heating value was calculated to be 6.62 kW.
The heat loss-gain method used for heating a conventional environment and the fuzzy logic system proposed for the heating method were compared. The traditional method equalizes the amount of heat that must be released to the environment with the amount of heat lost from the environment. Therefore, it calculates the temperature of the environment based on the heat transfer coefficients of the materials used and the size of the environment. On the other hand, the proposed fuzzy logic system calculates the amount of heat by considering the temperature and relative humidity needed by the plant. When these input values were used, the CU-1 system was compared with the heat loss-gain method that was considered to be the general heating method. Because the heat loss-gain method changes only according to the ambient temperature relationship and does not consider the amount of moisture in the environment, it calculated the same heating power at the same temperature but at a different relative humidity.
By comparing the two methods, it was observed that the proposed fuzzy logic system works more efficiently. When the average night heating values were considered, the CU-1 heating system consumed 16.16 kW, and the heat loss-gain heating system consumed 26.49 kW of heat energy. The CU-1 system worked better with an efficiency of about 25%. When the average daytime heating values were considered, the CU-1 heating system consumed 13.56 kW while the heat loss-gain heating system consumed 24.28 kW of heat energy. The CU-1 system worked better with an efficiency of about 40%. When the whole system was compared in general, the CU-1 heating system consumed 29.72 kW while the heat loss-gain heating system consumed 50.77 kW of heat energy. The CU-1 system worked better with an efficiency of about 25%.
The user saves about 25% of the heat energy when heating the greenhouse. In addition, the system can be adapted depending on the properties of the crop in the greenhouse. So, it can vary and be profitable according to each crop by using the appropriate amounts of heat energy each time with a subsequent increase in quality and efficiency per crop.
6.2. Evaluation
The proposed control system was evaluated according to its effect on energy, light and water savings. New developments in greenhouse cultivation are emerging in parallel with efforts to maintain sustainability in this sector. These efforts can be summarized as the improvement of the structural characteristics of greenhouses, utilization of the climate and alternative energy sources, production under controlled conditions, the introduction of soilless agriculture, integrated disease and pest management, and certified safe and traceable food production.
Heating is another measure that can be taken to solve the problem of low temperature and high humidity in greenhouses. Excessive amounts of chemicals are used against diseases caused by high humidity in greenhouses. Excessive pesticide use in unheated greenhouses affects consumer health and the environment negatively. Low temperature and high humidity create physical, chemical and aromatic quality deficiencies and also necessitates the use of heavy pesticides and hormones. Heating is necessary when the temperature falls below the specified threshold in order to obtain qualified and quantitative yield in greenhouses. For this reason, heating of greenhouses allows for the cultivation of high quality and efficient crops by preventing high humidity and consequently avoids the excessive use of pesticides and hormones.
The cool and humid air obtained by cooling greenhouses is used to keep them within the desired climate conditions. This minimizes the negative air conditions for the plant (a living being) that can occur in the greenhouse. More suitable conditions are therefore created for the working environment and plant growing due to decreases in temperature, the rate of wastage reduces, and productivity subsequently increases. In the cooling process using water sprays, the sprayed water particles physically change into the gas phase quickly, and plants can be provided with the air they need without getting wet. This will prevent suberification and putrefaction that may occur due to wetting.
Plants will not be able to grow without sufficient irrigation, which will result in a decrease in yield and quality. Over-irrigation causes a reduction in the yield and quality because it increases air humidity, forms an environment conducive to the reproduction of diseases and pests, prevents root systems of plants ventilating, and thus the plant cannot find enough nutrients.
Another input required for plants to grow is light energy. Plants grow and survive by photosynthesis with natural light from the sun under normal conditions. Thus, the lighting of greenhouses is essential for plants to complete the photosynthesis process. The aim of shading is to reduce the temperature in the greenhouse by preventing sunlight from entering the greenhouse.
The amounts of heating, cooling, light and water to be supplied to the greenhouse corresponding to the input data obtained were calculated. Because these values were calculated taking into account the appropriate temperature, humidity, light and water amounts for the crop, the results obtained provide the required conditions for the crop to grow at an optimum level. Therefore, it reduces diseases that can be caused by excessive heat or moisture, suberification, putrefaction and the use of chemical substances or hormones. Adequate light levels help plants to complete the photosynthesis process. The greenhouse should only be lightened as far as necessary because the temperature rises in the greenhouse as the amount of sunlight increases.
7. REMOTE ACCESS MODULE
The application consists of two subsystems. The first subsystem is the control platform operating via the Zigbee protocol. This system consists of a detection part and a short-range communication system. The second subsystem is the part where the data is recorded and the remote control is provided via the Internet.
The Xbee node designated as the coordinator calculates the average value of the data received from the nodal packages on the WSN and then transfers these values to the generated database via serial communication. In the fuzzy logic system designed in the MATLAB environment, the output values were calculated by using the rule tables created by Ödük [11].
Later, an Android-based mobile application was developed to manage the greenhouse. To use the application, it is necessary to know the IP address of the ESP 8266 WiFi module in the greenhouse [28]. After the IP address is entered, the calculated average values are read and then the output values obtained from the fuzzy logic unit according to these values are sent manually.
The ESP 82266 module is a self-contained system with a Transfer Control Protocol (TCP)/IP protocol widely accessible to any WiFi network with any micro-controller [29]. The flow chart for the developed mobile application is shown in Figure 16, while the interface of the Android mobile application is shown in Figure 17. In the initial application interface, the user enters the system using their user name and password. After that, the user connects to the greenhouse with their IP address.
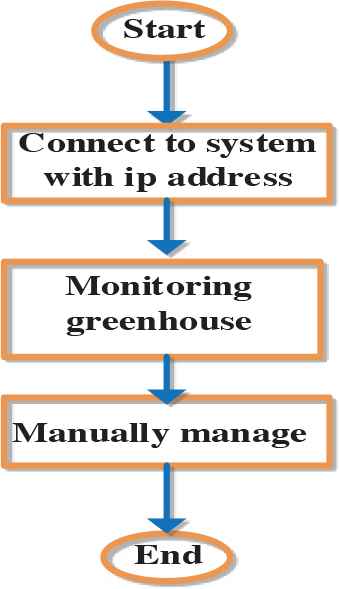
The flow chart for the mobile application.
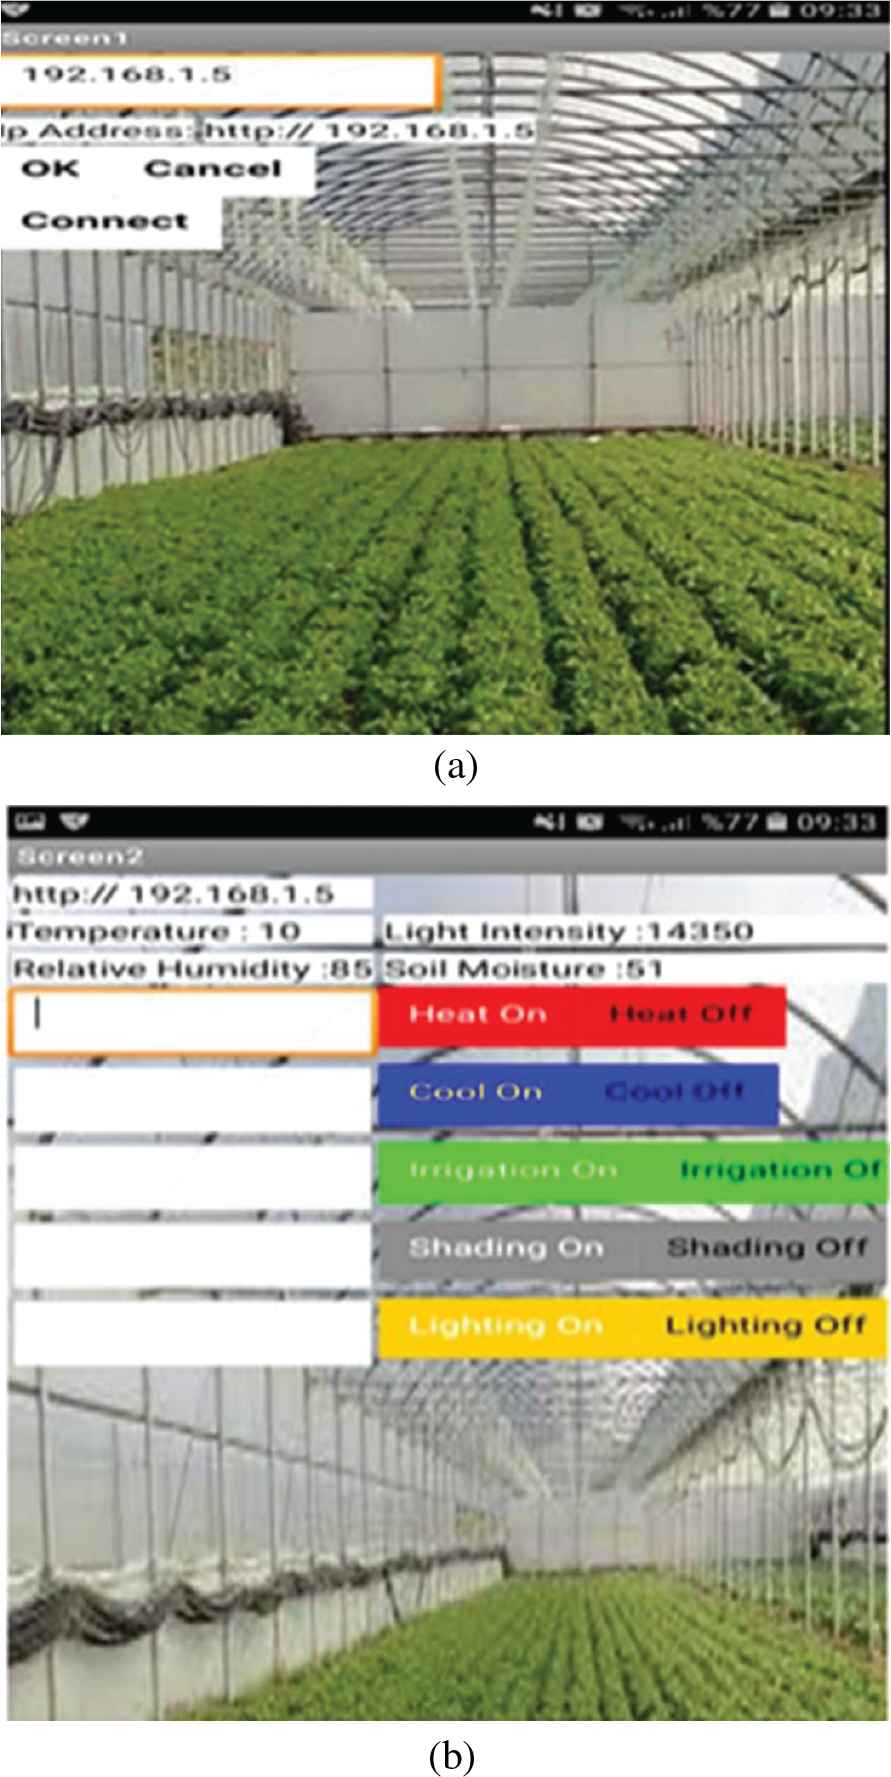
The interface for the mobile application (a) Connecting to the greenhouse, (b) Monitoring the greenhouse.
The steps applied in the flow chart of the mobile application are as follows:
Step 1. Start
Step 2. The connection is established with the greenhouse after entering its IP address.
Step 3. Through the developed mobile interface, the user displays the measured parameter values and output values of the fuzzy logic control unit corresponding to these input values.
Step 4. If the system is in the calculated auto-activation value range, the greenhouse is automatically set or the user manually controls the greenhouse.
Step 5. End.
Considering the value ranges of the control variables given in Table 2 and the output values calculated in Table 4, the values that automatically activate or deactivate the control units are shown in Table 5. The system is automatically activated under the following conditions: the CU-1 heating system is 3.7 kW or higher, the CU-2 cooling system is 12 μm or higher and the CU-3 irrigation system is 8.9 L or more, the CU-4 shading systems is 100 cm or higher and the CU-5 lighting system is 10 000 lux or higher.
| State | CU-1 | CU-2 | CU-3 | CU-4 | CU-5 |
|---|---|---|---|---|---|
| CU | |||||
| Active | CU-1 > 3.7 | CU-2 > 12 | CU-3 > 8.9 | CU-4 > 100 | CU-5 > 10 000 |
| Passive | CU-1 < 3.7 | CU-2 < 12 | CU-3 < 8.9 | CU-4 < 100 | CU-5 < 10 000 |
The activation values for the control units.
8. COMPARISON WITH OTHER RELATED SYSTEMS
Over the years, various algorithms and technologies have been used to achieve greenhouse management with low energy, low hardware costs and high reliability. A comparison of the studies in published literature performed on a smart greenhouse application against this study is shown in Table 6.
| Reference | Technology Used | Method Used | Variable(s) Used | Purpose of Use | Performance |
|---|---|---|---|---|---|
| [2] | PLC, KingView | Fuzzy Logic | Humidity, temperature, light intensity, CO2 | Heat, shade, light and moisture | Success |
| [3] | - | EPCR | Temperature and humidity | Evaporation | Success |
| [4] | - | Fuzzy Logic | Temperature | Heating | Success |
| [6] | WMSN, IoT | Volumetric Water Content | Temperature, humidity and moisture | Irrigation | Success |
| [7] | WSN, Zigbee | Fuzzy Logic | Temperature | Temperature control | Success |
| [8] | WSN | Fuzzy Logic | Temperature and humidity | Energy and water | Success |
| [9] | Sensor | Proportional Integral Derivative (PID), ANN | Temperature and humidity | Heating, ventilation | Success |
| [10] | WSN | Fuzzy Logic | Soil temperature, soil moisture and air humidity | Irrigation | Success |
| Proposed Method | WSN, Zigbee, Wi-Fi, IoT, Android | Fuzzy Logic | Temperature, relative humidity, soil moisture and light intensity | Heating, cooling, irrigation, lighting, shading | Success |
Comparison of smart greenhouse applications.
In this study, 18 nodal packages on the WSN created in the greenhouse used the Zigbee communication protocol to communicate with the coordinator node. The Zigbee protocol provides fast and easy set-up, safe operation and low power consumption. The WiFi communication protocol is used because it has high speed monitoring and enables the user to remotely and flexibly interact with the greenhouse. The developed Android mobile application provided flexibility to the user regarding time and location. Logic is not enough on its own because greenhouse climate parameters are a complex process to check as they are interrelated. Therefore, the fuzzy logic control method is considered as a more suitable method because it is designed to consider all situations and interconnections. All the requirements that the crop needs should be met in order to increase the quality and yield of greenhouse crops. Because it is very difficult to create a natural environment, the environment must be prepared in accordance with the specified conditions. Therefore, the environment must be controlled to achieve this. The crop needs specific amounts of temperature, relative humidity, soil moisture and light. These are the functions of greenhouses—such as heating, cooling, irrigation, shading and lighting. The properties that the crops need are controlled by the proposed system.
The developed system covers most of the climate parameters measured in the greenhouse and consequently provides control of more systems within the greenhouse. The system has expandable flexibility with WSN, Zigbee and WiFi protocols. The system uses Zigbee technology in the greenhouse because there may be a problem with supplying power to the nodal packages. In order to provide IoT support to the user, the WiFi (Internet) protocol is used for remote access to the greenhouse. The problems of the user regarding time and location limitations are solved through the developed Android mobile application.
According to Table 6, when compared to the previous systems, the system developed contains more new technologies and provides a more controllable environment for users to monitor and intervene in the greenhouse remotely by using more sensor types and thus providing better feature control.
9. CONCLUSION
In this study, an application has been developed to monitor and manage a greenhouse effectively with fuzzy logic control and mobile application support using sensor nodes designed with a WSN structure. In the developed system, the sensor nodes used Zigbee wireless communication technology to read indoor climate parameters of the greenhouse. The structure provided some advantages to the system, such as increasing the number of sensor nodes, the use of these sensor nodes distributed over a large area, and the continuity of operation of other sensor nodes when a sensor node fails. The Zigbee technology used in communicating between the sensor nodal packages and the coordinator node increased the durability of the network and reduced costs considerably by providing flexibility during installation.
It has been emphasized that the application developed in this work allowed for man–machine interaction, offering access to the configuration, monitoring and control of a fuzzy system [30].
The management of greenhouse climate parameters has been achieved by using the fuzzy logic method in the control system for the greenhouse. Because the developed fuzzy logic system was designed to consider the climate parameters required by the plant, it was more efficient in its operation than the conventional method.
The proposed scheme provided several advantages to the user enabling them to remotely monitor the greenhouse using the mobile application and manage the climate parameters. It has solved the limitations of time and location that users encounter. It has created great convenience to the user in terms of time, energy consumption, water usage, safety, access and management. The system developed in the study saved the user approximately 25% of the heat energy that the user would have spent to heat the greenhouse. Products grown in greenhouses have specific growing conditions. Some properties of the greenhouse (such as temperature and humidity) must be checked in order to provide the optimum conditions for the product grown. The minimum consumption quantities that these parameters can generate are calculated. In this study, the amount of heating needed to provide the necessary cultivation conditions for the tomato plant was determined. A fuzzy logic method and heat loss gain method were both analyzed. Both methods were compared with each other in terms of heat energy depletion. A gain was achieved in heat energy used as the two heating methods consumed 25% less heat energy than others. With this system, the farmer’s planting was improved by meeting the plants’ needs. It has also provided various additional benefits, such as higher yield, shorter production time, better quality production and less use of preservative chemicals.
COMPETING OF INTEREST
The authors declare that there are no conflicts of interest regarding the publication of this paper.
ACKNOWLEDGMENTS
This work was not supported any financial institutions.
REFERENCES
Cite this article
TY  - JOUR
AU  - Özlem Alpay
AU  - Ebubekir Erdem
PY  - 2019
DA  - 2019/01/14
TI  - The Control of Greenhouses Based on Fuzzy Logic Using Wireless Sensor Networks
JO  - International Journal of Computational Intelligence Systems
SP  - 190
EP  - 203
VL  - 12
IS  - 1
SN  - 1875-6883
UR  - https://doi.org/10.2991/ijcis.2018.125905641
DO  - 10.2991/ijcis.2018.125905641
ID  - Alpay2019
ER  -