
Intelligent Biological Alarm Clock for Monitoring Autonomic Nervous Recovery During Nap
Corresponding author. Email: cwenwanh@swu.edu.cn
- DOI
- 10.2991/ijcis.d.190304.001How to use a DOI?
- Keywords
- Intelligent biological alarm clock; ECG; Heart rate; Heart rate variability; Autonomic nervous system
- Abstract
Nap is an effective way to reduce daily-level fatigue after several hours of work. However, no alarm clock, which intelligently manages the nap duration with good autonomic nervous recovery (ANR) from fatigue, has been reported in literature. In this work, an intelligent biological alarm clock algorithm was designed on the basis of electrocardiogram (ECG) and electroencephalogram (EEG) data acquisition and analysis. ECG data samples were collected from 31 subjects in 278 times of nap experiments and categorized into good, moderate, and poor ANR datasets according to the degree of sympathetic withdrawal and parasympathetic activation during the nap. In practice, the alarm clock automatically classified the new-coming ECG data as good, moderate, or poor ANR with a classifier trained by the abovementioned ANR datasets. A prototype system of the intelligent alarm clock algorithm was implemented and validated in real-scene naps. The prototype system detected falling asleep during the closed-eye naps with a true positive rate of 93.55% and a true negative rate of 100%.
- Copyright
- © 2019 The Authors. Published by Atlantis Press SARL.
- Open Access
- This is an open access article distributed under the CC BY-NC 4.0 license (http://creativecommons.org/licenses/by-nc/4.0/).
1. INTRODUCTION
Fatigue [1, 2] is extreme tiredness arising from mental or physical efforts, associated with a significant level of physical and psychosocial morbidity. Daily level of fatigue, which is a highly prevalent phenomenon, usually has the symptoms of tiredness, sleepiness, difficulty in concentration, less strength in muscles. [3]. Fatigue-inducing mental task experiment [4, 5] has shown that fatigue decreases parasympathetic activity and increases sympathetic activity [5, 6], causing certain degree of autonomic imbalance harmful to the health of the people [7]. There are many fatigue intervention methods at certain situations, for example, driving [8]. However, sleep is the most generalized way to recover from daily-level fatigue [9]. Although the biological meanings of sleep process do not have a final conclusion, compared with those during wakefulness, most biological functions of the body change during sleep, and sleep depriving can cause significant cardiometabolic and neurological sequelae [10, 11]. Heart rate decreases during nonrapid eye movement (NREM) sleep and increases during rapid eye movement (REM) sleep [11]. Besides, a predominant parasympathetic modulation is observed during NREM sleep, and the sympathetic control is significantly predominant during REM sleep [11]. Considering the opposite influences of fatigue and NREM sleep on the autonomic nerve system, a daytime nap is a promising way to reduce daily-level fatigue after several hours of work. The decreased heart rate and increased heart rate variability during the NREM sleep are the signs of sympathetic withdrawl and parasympathetic activation [11], and we call this the autonomic nervous recovery (ANR) from fatigue-caused autonomic imbalance. For most people, the length of the daytime nap is no more than one hour [12, 13], and the best wake-up time is during the second phase of the NREM sleep [13]. Although the actigraphy software is an effective way to detect the nap status of people [14], its accelerometer-based data acquisition cannot obtain the autonomic activity during the nap. Given the variable sleep latency of each time of the naps, current mainstream electronic alarm clocks cannot guarantee that the user will be awakened during the NREM sleep, not to mention the monitoring of ANR during the nap. In fact, accurate sleep status detection can be achieved by using the polysomnography in which the brainwave rhythm is an important index to judge the sleep status. However, the application of polysomnography is expensive and not convenient, hindering its use in daily life.
Therefore, the aim of this work is to design an intelligent alarm clock based on the electrocardiogram (ECG) signal. The basic function of the intelligent alarm clock is to monitor the ANR during the nap and awaken the user after good ANR has been detected. HR and HRV are effective markers of the autonomic nervous activity [15–18], and they can be derived from the ECG signal conveniently acquired through wearable ECG devices. The conventional indexes of HR and HRV are the mean of the RR intervals, standard deviation of the RR intervals, square root of the mean of the squares of differences between successive RR intervals (RMSSD), low frequency power (0.04 Hz–0.15 Hz), and high frequency power (0.15 Hz–0.4 Hz) [18]. The intelligent alarm clock in practice will process the real-time ECG data, calculating the RR intervals and inferring the ANR with as short delay as possible. Therefore, new HR and HRV indexes with low calculation cost will be explored, in order to describe different levels of ANR in a refined form.
The following sections are structured as follows: The second section is the design of the intelligent alarm clock algorithm; the third section is the ECG data acquisition during the nap and data analysis; the fourth section shows a prototype system of the biological alarm clock and the validation of the alarm clock in practice; finally, the fifth and sixth sections are the discussion and conclusion.
2. ALGORITHM DESIGN
As a biological alarm clock, the algorithm firstly receives ECG data from the wearable ECG device. Then, RR intervals are calculated from the ECG data by using the real-time RR interval calculation algorithm in [19]. As an intelligent alarm clock, the algorithm extracts the HR and HRV features from the new-coming data, classifies the new-coming data into certain category of ANR with the classifier trained by the experimental ECG dataset, and finally determines whether it is the right time to awaken the user by using the alarm rule. The flow chart of the algorithm is shown in Figure 1.
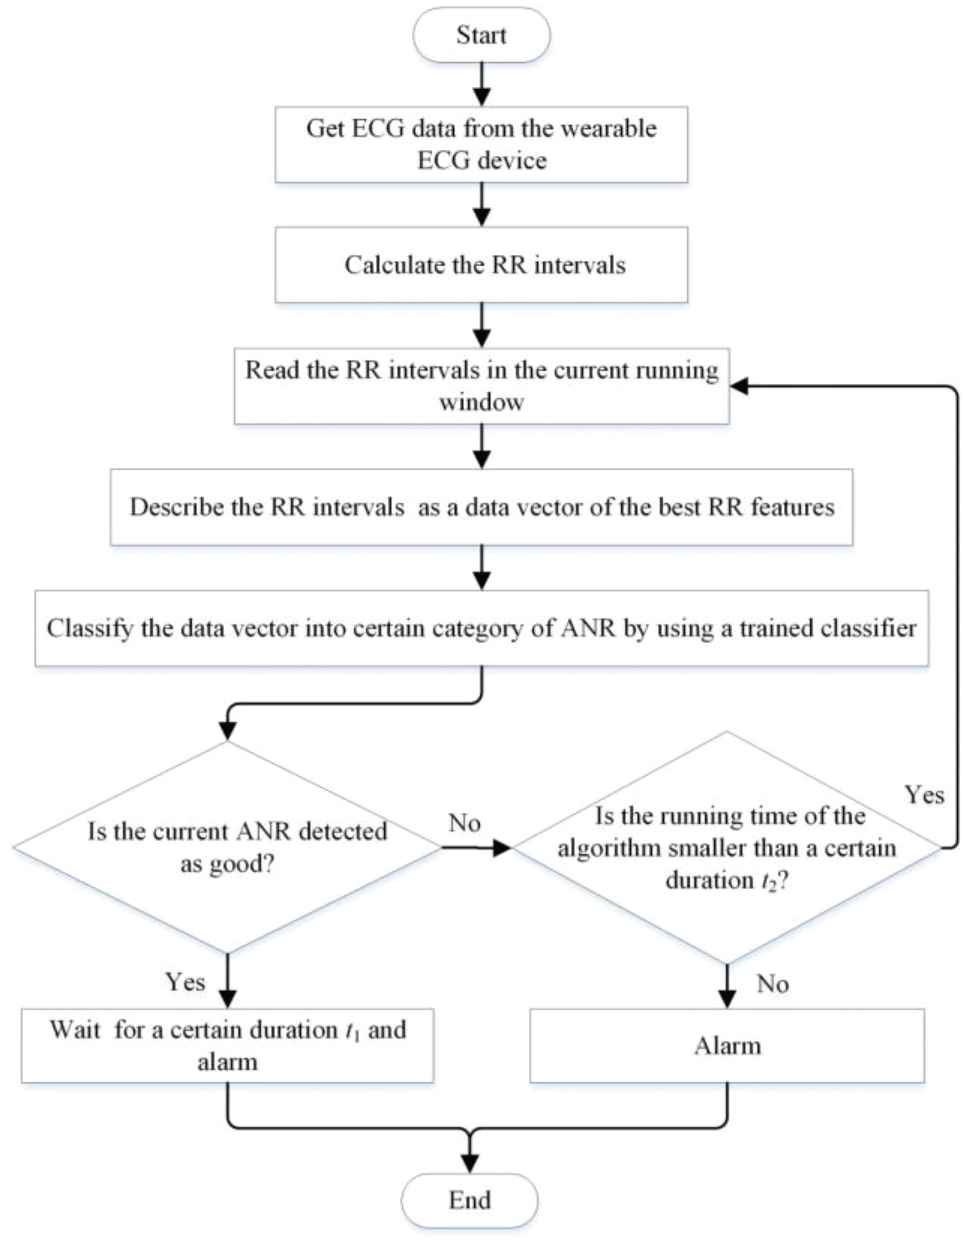
The flow chart of the intelligent biological alarm clock algorithm.
The real-time RR interval calculation algorithm includes the following: (1) store the ECG data into a buffer with certain length, for example, 4 seconds; (2) after the buffer is full, read the ECG data; (3) eliminate the baseline drift of the ECG data by wavelet decomposition and reconstruction; (4) find the maximum of the ECG data as the R peak in a running window with adaptive window length adjusted by the latest normal RR interval and the empirical largest normal RR interval; (5) calculate the duration between two successive R peaks as the RR interval.
The length of the running window in the third execution block is set to be 300 RR intervals, about 5 minutes. The running step of the running window is set to be 10 RR intervals. As the running window moves along the time with the given running step, the detected ANR is renewed by using the new-coming RR intervals.
The HR and HRV features and the trained classifier used for ANR status recognition are obtained by analyzing the experimental ECG data acquired during the naps of a group of subjects. The experimental ECG data acquisition and analysis will be explained in the next section.
There are two alarm rules in the algorithm: (1) if good ANR is detected for the first time, wait for a certain duration t1 and then alarm; (2) if good ANR is not detected in a certain duration t2, alarm without more waiting. The first alarm rule is to ensure that, if the user has fallen asleep, let the user wake up at certain phase of the NREM sleep. The purpose of the second alarm rule is that, if the sleep latency is too long, let the user get up before he/she feels dizzy after a long time in bed.
3. EXPERIMENT PROCESS AND ECG DATA ANALYSIS
3.1. Participants
Thirty-one healthy Master Degree Candidates (age, 24.2 ± 1.2 years [mean ± SD]; weight, 60.7 ± 12.6 kg; height, 167.8 ± 9.9 cm; body mass index, 21.8 ± 0.4; 16 males and 15 females) from the school of electronic and information engineering at Southwest University were recruited in the experiment. To be included in the experiment, the participants would be obliged to the following criteria: (1) do not have a history of diagnosed mental sickness or cardiac respiratory disease; (2) do not take any medications for fatigue, such as Amantadine, Modafinil, and Fampridine; (3) get up before eight every morning; (4) do not drink alcoholic or caffeinated beverages, nor use tobacco products during the whole session of experiment. The experimental agreement was approved by the affective computing laboratory at Southwest University, and all participants provided written informed consent.
3.2. Experiment Process
The experiment was to let the participants have a nap of 20 minutes after they worked hard successively for about 6 hours except for a short lunch time. Before the nap, the participants should have the fatigue feeling. During the nap, the participants reclined on a chair with their eyes closed. After the nap, the participants reported whether they had fallen asleep and whether their fatigue had been reduced by the nap. The air temperature in the experiment room was controlled to be 26–27°C.
The ECG signal was recorded during the nap with a Shimmer3 ECG device. The sampling rate of ECG data acquisition was set to be 512 Hz. Most data acquisition was around 2 P.M. when the participants felt tired of several hours of cognitive task and could not concentrate on their work. Each participant took part in the experiment 9–10 times, only having one nap at one day. After the electrode-failure ECG recordings were excluded, 278 normal ECG recordings were collected from 31 participants.
3.3. ECG Data Analysis
The original ECG had baseline drift, as shown in Figure 2(a). Without baseline drift, fast R peak location could be realized through maximum value detection with a running window having a length longer than one normal RR interval and shorter than two normal RR intervals. The adaptive length of the running window was controlled by the latest normal RR interval. If the latest RR interval was not a normal one, the length of the running window was set by using an empirical normal RR interval, for example, 1.5 seconds. In order to fast locate the R peak, the baseline drift of the ECG data was eliminated by a wavelet method. Firstly, we decomposed the ECG data with certain wavelet; secondly, we set the approximation coefficients at the last level of decomposition to be 0; finally, the ECG data were reconstructed from the revised decomposition structure, as shown in Figure 2(b). After R peak locating, the RR intervals were calculated as the durations between two successive R peaks, as shown in Figure 2(c).
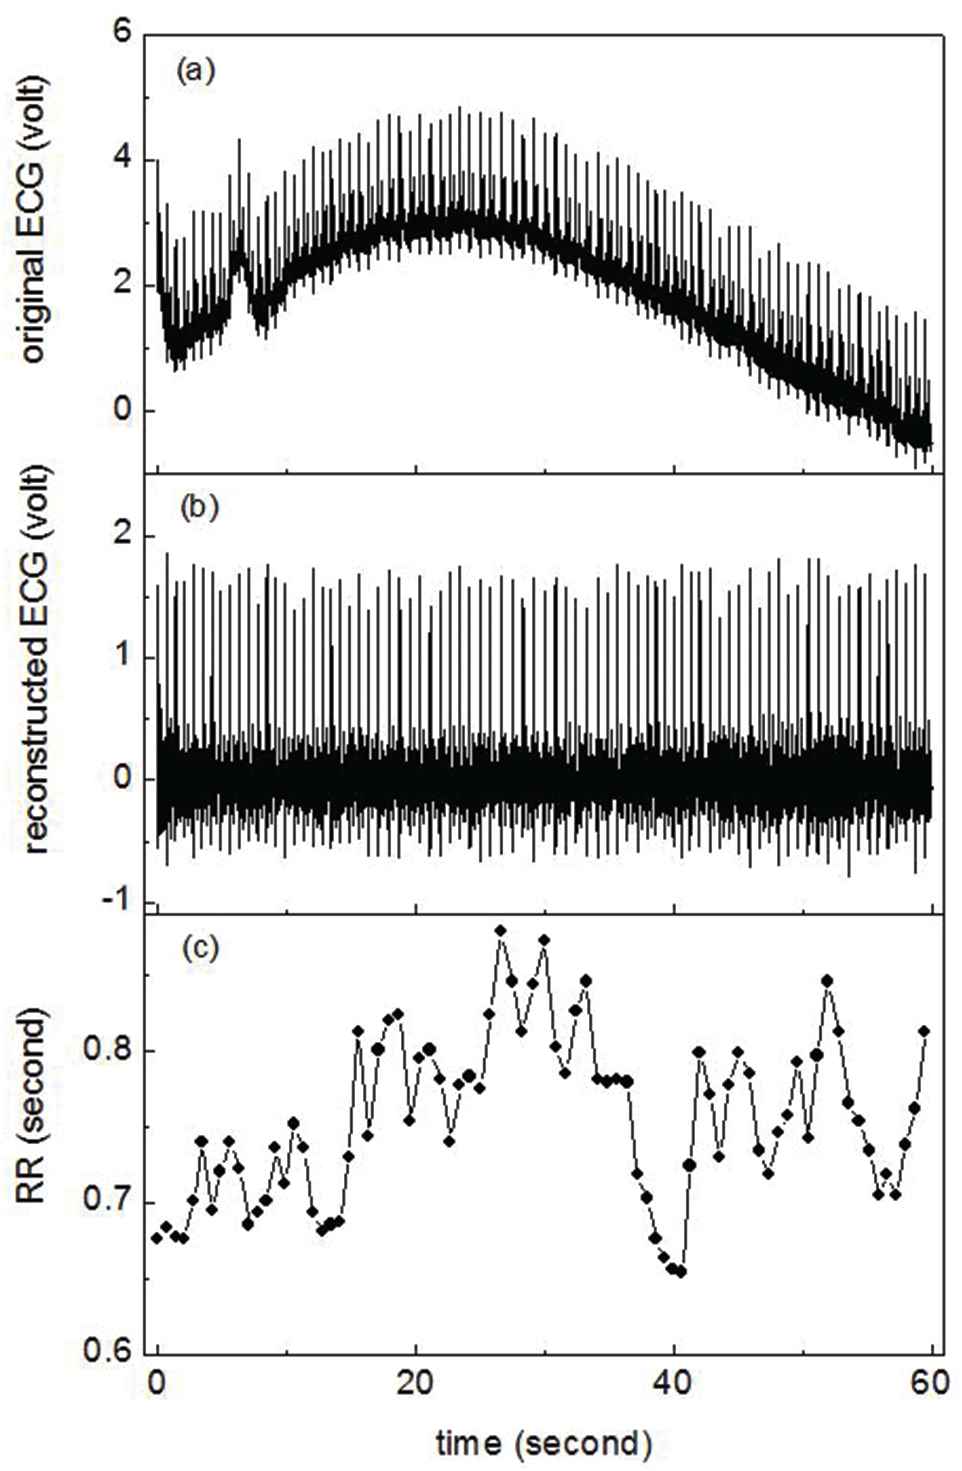
Original electrocardiogram (ECG) (a), reconstructed ECG (b), and RR interval series (c) calculated from reconstructed ECG.
Figure 3 shows three RR interval series calculated from the ECG data of the nap experiments. The data in Figure 3(a) belongs to a participant who had fallen asleep during the nap and recovered from the fatigue after the nap; the data in Figure 3(b) belongs to a participant who was not sure that he had fallen asleep during the nap, but he felt the fatigue had been relieved after the nap; the data in Figure 3(c) belongs to a participant who had not fallen asleep during the nap, and he felt more tired after the nap. The RR interval series in Figure 3(a) show the largest small-scale fluctuations among those in the three subfigures of Figure 3, and the RR interval series in Figure 3(c) have the least small-scale fluctuations. In order to visualize the differences of the three RR interval series in Figure 3, the Poincare section scatter plots of these RR interval series are given in Figure 4. The scatter plots in the (a), (b), and (c) subfigures of Figure 4 are respectively corresponding to the RR interval series in Figure 3(a), (b), and (c). Along the diagonal line, the centroid of the scatter plot in Figure 4(a) is the highest, and the length of the scatter plot is also the longest among those in the three subfigures. That is to say, the RR interval series corresponding to the scatter plot in Figure 4(a) show the most sympathetic withdrawal and the most parasympathetic modulation, consistent with the participant-reported good fatigue reduction after the nap. Besides, the apparent sympathetic withdrawal and parasympathetic activation in Figure 3(a) start nearly after the 300th RR interval where the inter-beat-interval obviously becomes longer, and the small-scale fluctuation of RR interval series becomes larger, compared with those in the first 300 RR intervals. In order to describe these changes of ANR, a running window was used to segment the RR intervals. The length of the running window and the running step were empirically set to be 300 and 10 RR intervals. In the running window, we used the centroid of the Poincare section scatter plot of the RR interval series as an index of sympathetic activity, and we applied the total fluctuation at small RR scales as an index of parasympathetic activity. The total fluctuation at small RR scales were deduced from the average fluctuation function [20] as follows:
RR interval series with good autonomic nervous recovery (ANR) (a), moderate ANR (b), and poor ANR (c). Poincare section scatter plot of the three RR interval series shown in Figure 3.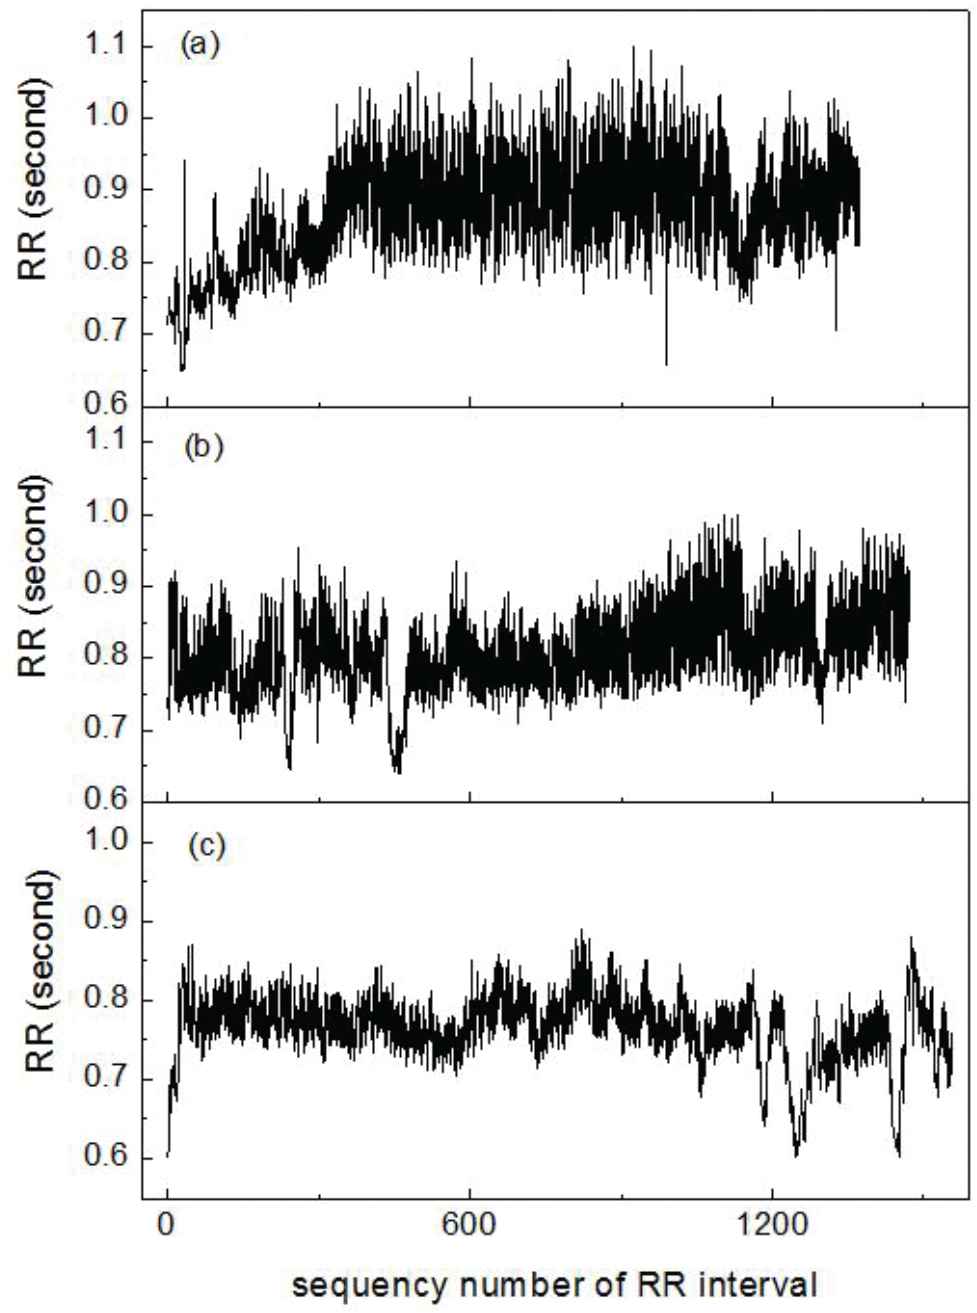

As the running window moved along the time, we calculated the ANR difference of the RR data in the running windows respectively having the highest and the lowest centroids of the Poincare section scatter plots. Let (xch, ych) and (xcl, ycl) respectively denote the coordinates of the highest and the lowest centroids of the Poincare section scatter plots, the first RR interval feature depicting the change of sympathetic activity was calculated as
We also calculated the ANR difference of the RR data in the running windows respectively having the largest and the smallest total fluctuations as
We calculated the values of feature1 and feature2 from the 278 ECG recordings, and the ECG recordings were described as the data vectors of the two RR interval features. We clustered the 278 data vectors into three categories, and the scatter plot of the 278 data vectors in the two-dimensional feature plane is shown in Figure 5. The data were marked as good, moderate, and poor ANR, according to the locations of the data in the two-dimensional feature plane. The larger the feature values, the better the ANR.
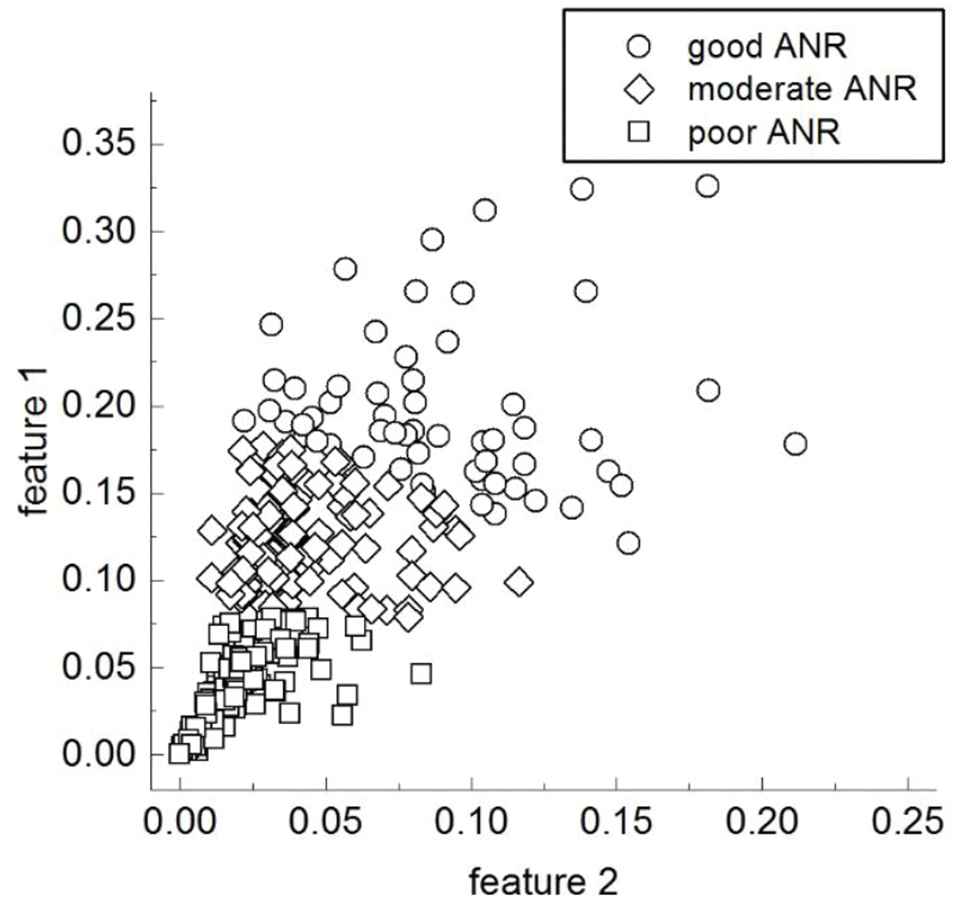
Scatter plots and clustering results of 278 RR interval time series in two-dimensional feature plane.
4. PROTOTYPE ALARM CLOCK SYSTEM AND ITS VALIDATION
The intelligent biological alarm clock algorithm in Section 3.2 was implemented by programming in the Matlab software, and the interface of the prototype system is shown in Figure 6. The result display panel of the prototype system shows the start time of the system, the timestamp of the good ANR detected for the first time, the alarm time, and the ANR status at the end of the nap. This prototype system worked with a Blue-tooth mode Shimmer3 ECG device. In the process of real-time monitoring of ANR, the system received the real-time ECG data from the Shimmer3 device through Blue-tooth data transmission. The delay of the system was less than 4 seconds, because of the application of the RR interval calculation algorithm in [19]. When extracting the RR interval features from the real-time ECG data, the (xch, ych) and fh in Equations (3) and (4) were respectively replaced by the coordinates of the centroid of the Poincare section scatter plot and the total fluctuation of the RR intervals in the current running window. The system judged the degree of ANR of the data in the current running window by detecting the smallest distance between the location of the current data in the feature plane and the means of the three clusters in Figure 5, that is, the data sample in the current running window was categorized into the nearest cluster.
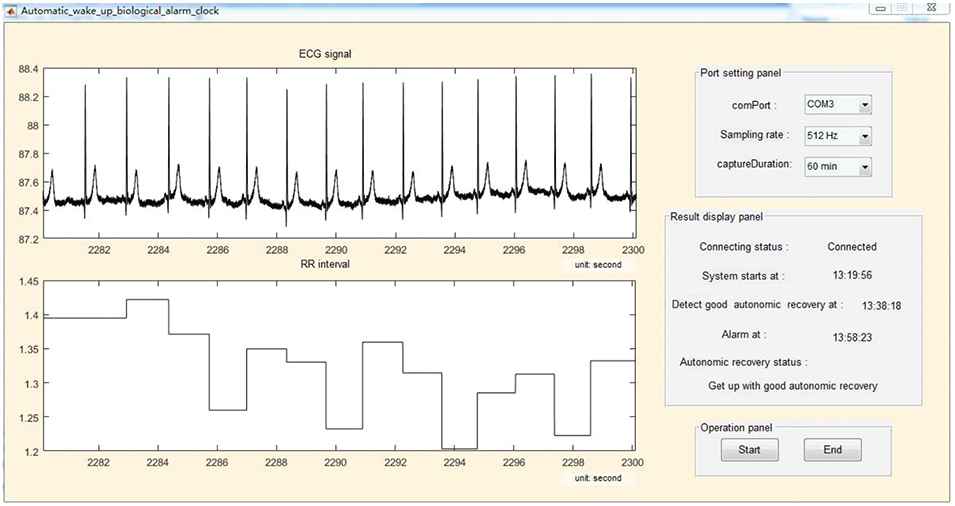
Real-time running of the prototype intelligent biological alarm clock.
The alarm clock was validated during many times of real-scene naps. The participants taken part in the validation experiments all followed the participant criteria mentioned in Section 3.3. The validation was divided into three sessions. The first session of the validation was to determine the best values of t1 and t2 used in the alarm clock algorithm. According to the report of 10 participants in the first session, after the good ANR was detected for the first time, the participants had 20 minutes more nap, got up, and felt fully refreshed; if the sleep latency was more than 45 minutes, the participants would get up with dizzy head. Therefore, in the second session of the validation, the values of t1 and t2 were respectively set to be 20 and 45 minutes. Forty-two participants took part in the second session of the validation. If the participants did not feel tired or only felt slightly tired, they had a rest with open eyes (11 participants); if the participants felt moderately or strong tired, they had a rest with closed eyes (31 participants). Only ECG data were acquired during the second session of the validation. Among the 31 subjects rested with closed eyes, 10 of them reported no sleep, 21 of them reported falling asleep during the nap. In order to further explore the relationship between ECG-revealed good ANR and EEG-revealed NREM sleep, we performed the third session of the validation in which ECG and EEG data were simultaneously recorded, and 12 participants took part in the third-session experiments. According to the self-reports and the brainwave rhythm, 2 of the participants did not fall asleep, and 10 of the participants fell asleep during the nap. We determined the start of the first stage of NREM sleep (see Figure 7(a) as an example) through the slowed down brainwave rhythm and the dropping out of alpha activity. As a comparison to the EEG at the first stage of NREM sleep, Figure 7(b) shows the many alpha activities at the late period of the sleep latency.
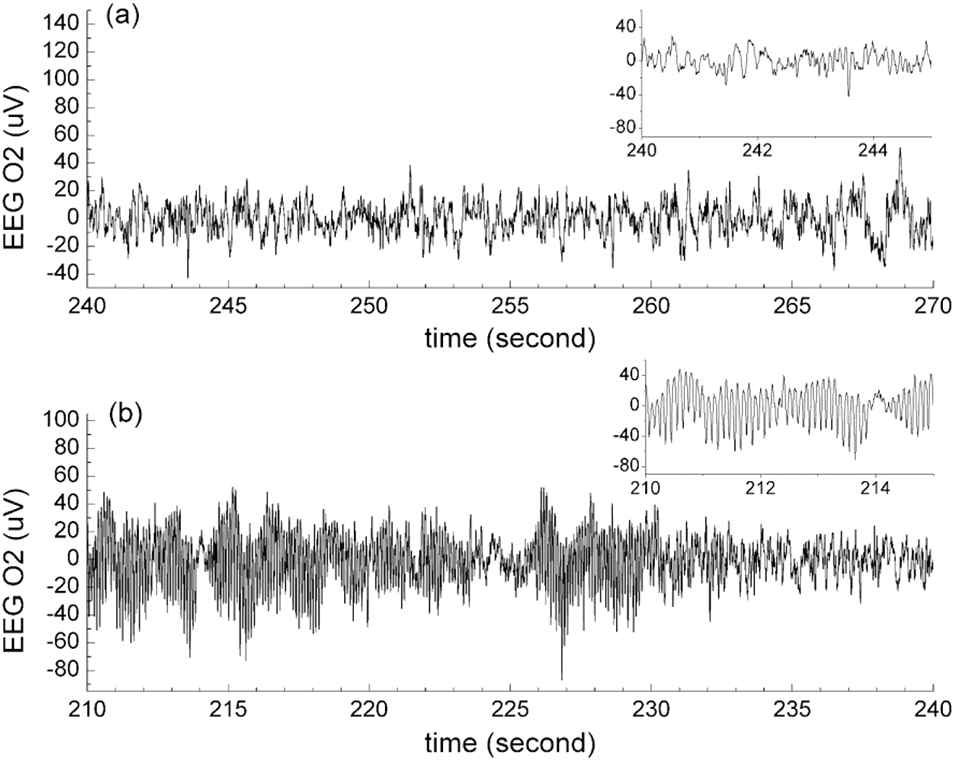
The O2 channel of electroencephalogram (EEG). (a) The slower brainwave than the alpha wave at the beginning of the sleep status. (b) The alpha wave at the late period of the sleep latency.
Table 1 shows the amount of detected good, moderate, and poor ANR in the second and third sessions of the validation. Table 2 shows the amount of participant-reported good, moderate, and poor fatigue reductions during the naps with closed eyes. We can see that during the naps with closed eyes, only when the subjects fell asleep, good ANR was detected. Besides, 26/30 of detected good ANR corresponds to the participant-reported good fatigue reduction. Therefore, the nap with closed eyes and good ANR status is effective for reducing fatigue.
| Detected as Good ANR | Detected as Moderate ANR | Detected as Poor ANR | |
|---|---|---|---|
| Participant-reported sleep with closed eyes | 30 | 1 | 0 |
| Participant-reported no sleep with closed eyes | 0 | 8 | 4 |
| Rest status with open eyes | 3 | 8 | 0 |
ANR, autonomic nervous recovery.
The amount of detected good, moderate, and poor ANR in the second session of the validation.
| Detected as Good ANR | Detected as Moderate ANR | Detected as Poor ANR | |
|---|---|---|---|
| Participant-reported good fatigue reduction | 26 | 1 | 1 |
| Participant-reported moderate fatigue reduction | 4 | 7 | 1 |
| Participant-reported poor fatigue reduction | 0 | 1 | 2 |
ANR, autonomic nervous recovery.
The amount of good, moderate, and poor fatigue reduction during the naps with closed eyes.
Figure 8 shows the participant-reported sleep latencies, the timestamps of detected good ANR, and total nap time of the 20 experiments in which the subjects fell asleep during the nap in the second session of the validation. Although the participant-reported sleep latencies are subjective, we still can see that the sleep latency of each nap changes from time to time, confirming that the alarm clock manually set before the nap cannot guarantee a good rest. The participant-reported sleep latency and the timestamp of detected good ANR of the sixth experiment are very different, because the subject fell asleep too soon and the alarm clock did not get a valid baseline of ANR in the sleep latency. After excluding the sixth experiment, the timestamps of detected good ANR and the participant-reported sleep latencies have a correlation coefficient of 0.9284, showing that the detected good ANR is a good indicator of falling asleep. Figure 9 shows the start and end timestamps of sleep status revealed by EEG and the timestamp of detected good ANR of the 10 participants who fell asleep in the third session of the validation. Through manual checking of the EEG data, we found that the timestamps of detected good ANR were at the late period of the first stage of NREM sleep or the early period of the second stage of NREM sleep, further confirming that the detected good ANR is a good indicator of falling asleep.
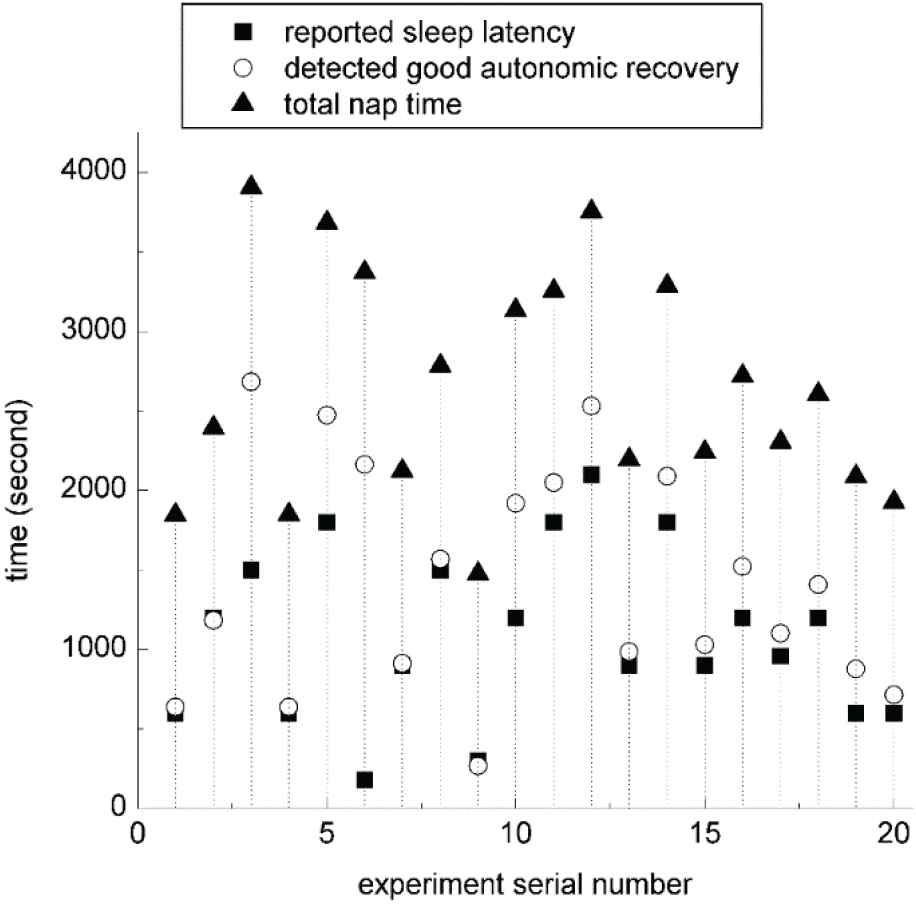
Participant-reported sleep latencies, timestamps of detected good autonomic nervous recovery (ANR), and total nap time of the 20 experiments in which the subjects fell asleep during the nap in the second session of the validation.
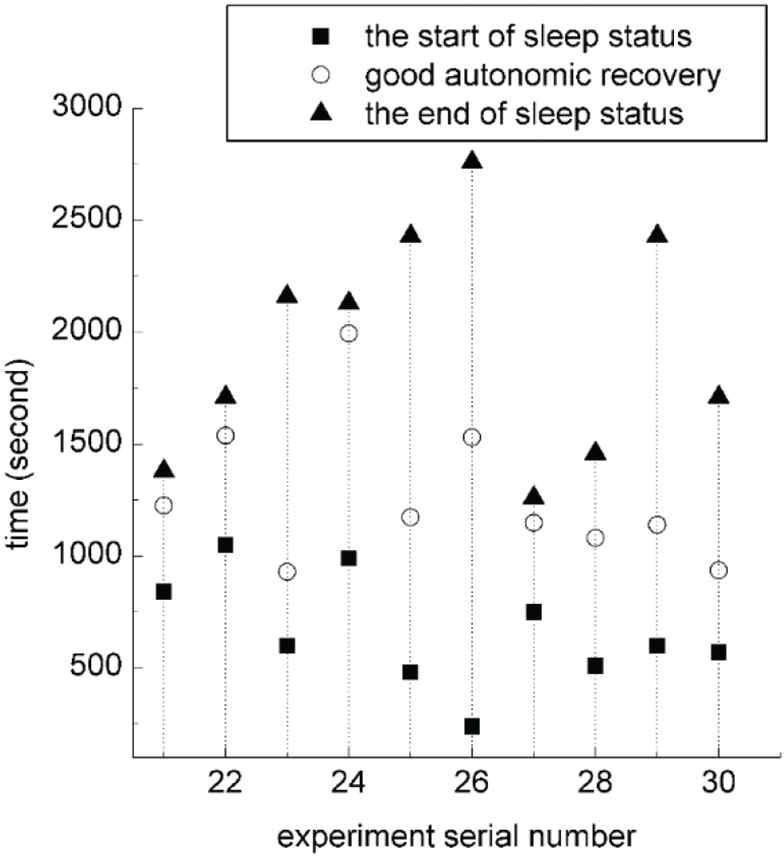
The start and end timestamps of sleep status revealed by electroencephalogram (EEG) and the timestamp of detected good autonomic recovery in the third session of the validation.
As shown in Tables 1 and 2, one subject fell asleep and got up with participant-reported good fatigue reduction, but the alarm clock system only detected moderate ANR during the nap. Like the sixth subject in Figure 8, this was also caused by the missing baseline of ANR status in the sleep latency due to too fast falling asleep of the subject. Therefore, the correct rate of detecting sleep status is 29/31, and the correct rate of detecting no sleep status is 12/12. With the alarm rules of the prototype system, the missing baseline because of extreme tiredness will result in a long nap equal to or longer than 45 minutes in practice.
5. DISCUSSION
Large amount of nap experiments were performed to get the ECG datasets of good, moderate, and poor ANR. Then, the prototype intelligent biological alarm clock system was realized on the basis of the algorithm designed in Section 3.2 and the ECG datasets acquired in Section 3.3. From the results of system validation, we can see that if the participants fell asleep, the intelligent biological alarm clock successfully awakened the participants after they obtained good rest, and the empirical duration of effective nap for reducing daily-level fatigue is only 20 minutes.
Both the self reports of the participants and the EEG data during the validation of the system show that the detected good ANR is a good indicator of falling asleep. With this indicator of falling asleep, the biological alarm clock effectively manages the duration of sleep. Therefore, the detection of good ANR has great value in practice.
It is worth noting that, the detected good ANR is not the start of the sleep revealed by EEG, but between the first and the second stages of NREM sleep. Therefore, the detection of good ANR does not guarantee that the user will be awakened at the second stage of NREM sleep. According to the EEG signal, some of the participants in the third session of the validation were in the third stage of NREM sleep when they were awakened by the alarm clock.
Compared with ECG, EEG is more accurate in determining the sleep status. However, the operations of EEG data acquisition, such as washing the head before and after the experiment and smearing the conductive gel to the EEG electrodes, were time-consuming in our work. Besides, some subjects felt uneasy wearing the EEG cap and could not sleep tight during the nap, for example, subjects 21, 22, 27, and 28. On the other hand, the data acquisition of inter-beat-interval series is easy and user-friendly. Therefore, compared with the brainwave rhythm method, detecting sleep status with good ANR revealed by the heartbeat rhythm is more convenient in daily life.
6. CONCLUSION
The ANR status during the nap was quantified by two new HR and HRV features, that is, the movement of the centroid of the Poincare section scatter plot of the RR interval series up along the diagonal line, and the increase of total fluctuation of the RR intervals in small scales. The intelligent biological alarm clock algorithm using the above two RR features was designed and implemented into a prototype system. During the validation of the prototype system, it was found that good ANR status during the closed-eye nap indicated effective reduction of daily-level fatigue. Because of the management of sleep duration with good ANR, the intelligent biological alarm clock designed in this work is much better for fatigue reduction than the conventional electrical alarm clock.
ACKNOWLEDGMENTS
The authors would like to thank all the participants taken part in the experiments. This work was supported in part by the National Science Foundation of China (Grant Nos. 61103132 and 61872301) and the Fundamental Research Funds for the Central Universities of China (Grant No. XDJK2013A020).
REFERENCES
Cite this article
TY  - JOUR
AU  - Jialan Xie
AU  - Wanhui Wen
AU  - Guangyuan Liu
AU  - Yongtao Li
PY  - 2019
DA  - 2019/04/11
TI  - Intelligent Biological Alarm Clock for Monitoring Autonomic Nervous Recovery During Nap
JO  - International Journal of Computational Intelligence Systems
SP  - 453
EP  - 459
VL  - 12
IS  - 2
SN  - 1875-6883
UR  - https://doi.org/10.2991/ijcis.d.190304.001
DO  - 10.2991/ijcis.d.190304.001
ID  - Xie2019
ER  -