
Distributed Synthetic Minority Oversampling Technique
- DOI
- 10.2991/ijcis.d.190719.001How to use a DOI?
- Keywords
- SMOTE; apache spark; prediction; machine learning; imbalanced classification
- Abstract
Real world problems for prediction usually try to predict rare occurrences. Application of standard classification algorithm is biased toward against these rare events, due to this data imbalance. Typical approaches to solve this data imbalance involve oversampling these “rare events” or under sampling the majority occurring events. Synthetic Minority Oversampling Technique is one technique that addresses this class imbalance effectively. However, the existing implementations of SMOTE fail when data grows and can't be stored on a single machine. In this paper present our solution to address the “big data challenge.” We provide a distributed version of SMOTE by using scalable k-means++ and M-Trees. With this implementation of SMOTE, we were able to oversample the “rare events” and achieve results which are better than the existing python version of SMOTE.
- Copyright
- © 2019 The Authors. Published by Atlantis Press SARL.
- Open Access
- This is an open access article distributed under the CC BY-NC 4.0 license (http://creativecommons.org/licenses/by-nc/4.0/).
1. INTRODUCTION
In the aspect of machine learning, one of the most popular issues involves classification. In particular, it is expected that the data sets containing information for extraction constitute all the required content through which relevant concepts can be learned; especially in relation to certain underlying generating functions. Given a classification problem, what remains notable is that it is challenging to predict the outcomes. Some of these classification problems include oil spills, fraud detection, and intrusion detection; a dilemma that translates into a state of class imbalance. In classes, it is also worth indicating that the resultant state of asymmetry could be puzzled due to the infrequent nature of such rare events [1–3]. Instead, the events emerge as exceptional situations that are mostly neglected or unexplored. In some cases, these events have been treated as extreme values (including outliers) or noisy disturbance. It is also ironical that most of the small-sized classes attract greater concern and much significance and acknowledgment are extended to them; including cases such as those involving the identification of credit card data breaches in online transactions. As such, most of the data experiences irregular or disproportionate observation ratios in different classes and end up yielding unacceptable classification accuracies—relative to fraud case identification. This trend points to the criticality of a relevant model capable of identifying the minority classes or rare occurrences in various sets of data associated with higher accuracy. As mentioned earlier, most of the minority samples have continually been treated as noise and ended up being ignored. The eventuality is that valuable data has been lost relative to the affected samples. An example is a case in which a given set of data exhibits an imbalanced ratio in the form 1:999. This sample ratio implies that 999 training examples of a negative class coincide with one positive class training sample. When a classifier is employed, it could generate the instances into negative forms to ensure that the classification rule accuracy is maximized; yielding 99.9% accuracy.
Notably, there exist unique categorizations of solutions through which problems linked to imbalanced classification could be solved [4–9]. One of such approaches entails the learning process' modification. With class dispersion on focus, this process is achieved by focusing on the undersampling majority class, oversampling minority class, or both [10]. In other situations, cost-effective approaches can be employed to address the respective classes' states of misclassification [11].
With growth in the volume of data, it is also important to modify the traditional methods of data preprocessing. Indeed, this approach also applies to situations where a single machine might not be better placed to process the data [12]. For Big Data case studies [13–15], the scalability issues related with data preprocessing need to be tackled appropriately in order to formulate novel solutions or accommodate existing ones. Data for smaller class (minority) that can be produced artificially with the assistance of the Synthetic Minority Oversampling Technique (SMOTE) [16]. Indeed, this approach refers plays a role of minimizing class imbalance in a given set of data or data sample. At present, nondistributed environment is making use of availability of SMOTE, although the main confront arises when we have necessity to yield the data for large minority class artificially using SMOTE. Data for minority class is generated through SMOTE with the help of interpolation of data instances that are related to minority as well as which are closure with each other. There are issues related to Distributed SMOTE as well. One of these issues is the appropriate management of data that is to be distributed among a cluster of machines for processing. To ensure effective data generation via the SMOTE technique, it becomes imperative to preserve sample spatial arrangement. Inappropriate management may result in inconsistent dissemination of data among the nodes (cluster), therefore may affect the sampling and consequently affecting the efficiency of the algorithm.
To tackle the problem, the solution should be efficient, scalable, and parallel. We introduce an algorithm that utilizes scalable K-Means ++ and M-Trees to synthetically generate the minority data, in this paper. We use Apache Spark [17] for implementing the distributed version of SMOTE.
We believe that distributed SMOTE is an active area of research [18]. Our research can be extended further toward developing an effective and efficient algorithm.
2. BACKGROUND
The problem of classification is termed imbalanced classification, when the positive class samples are far too few compared to the negative samples. Given negative and positive samples, the performance on the latter overwhelms that which is felt on the former type of sample. In imbalance data classification issues, we may neglect the asymmetry of data across a single class occasionally and this asymmetry within a class is cited for small disjunct [18,19]. These small disjuncts can be influenced through the Undersampling of the majority class. We may have to confront the possible downfall of essential information through this Undersampling of majority class [20,21]. Analogously, we may have to face the issues of data duplication in oversampling, which will enhance the count of illustrations excluding the addition of any value to data as well as any information related to class. The chances of over fitting can additionally be enhanced by oversampling, which can reinforce all minority clusters without taking into account their tangible participation to the problem.
Lot of exploration has been going to find the solution for the issues of classification in a disseminated (distributed) environment. The difficulties faced in classifying imbalanced data and the concerns related to the generation of imitated or we can say synthetic data for big data classification problems which are extremely imbalanced, is examined by Chawla [20].
Applying SMOTE requires us to find k-nearest neighbors. When the dataset is big, the cost of computing the k-nearest neighbors increases. For problems where the data set is huge and distributed, one approach would be to group the samples into groups and move these groups on different machines where up-sampling can be achieved. LSH is another technique for distributed KNN Search in high dimensions [22].
Clustering problems have been one of the most commonly researched problems. More details on various clustering algorithms can be found in [23–27]. One of the common clustering algorithms involves K-means. The simple nature of the algorithm accounts for its popularity. In recent scholarly investigations, much attention has been extended to K-means initialization improvement. The need for better convergence has been attributed to this trend. Given better initialization, a resultant merit is that it yields significant improvements in an algorithm's running time. In a distributed setup, it remains notable that there is also increasing attention and effort toward understanding the running of the K-means algorithm [28–30].
The role of the scalable K-Means++ [28] lies in center initialization, having evolved in a form that supports parallel implementation. Given k-means++, which is inherently sequential, its efficient and parallel version involves the scalable K-means++. Scalable K-means++, samples O(m) points in each round and repeats the process for approximately O(logn) rounds, instead of sampling a single point in each pass as used to be in k-means++ algorithm. So, O(mlogn) are sampled, which is typically more than the m clusters which are then clustered into m initial centers for Llyod's iteration. Since the size of sample is smaller than the input size, the re-clustering can be done quickly. Once the samples are clustered into m clusters, each of these clusters can use any of the widely available algorithms to find k-nearest neighbors. We have used space indexing algorithms to index the samples and then search for k-nearest neighbors.
Whenever the dimensionality is small we take advantage of Space partitioning approaches that includes tree-based methods alike R-Tree [31], K-D Trees [32], which is capable of performing extremely better in that case. The apportioning of the points results in disjoint sets, a process achieved through distance-based partitioning. In the target cell, all points are considered nearest to its pivot—compared to other pivots. Regarding the indexing and searching of metric spaces to discern similarity, another efficient method entails M-Tress [33–36]. This technique has been documented to be the most efficient if the situation on focus entails a large number of records or numbers of dimensions. Indeed, M-tree as a technique of object indexing seeks to support similarity queries by comparing features based on the parameter of distance.
Given M, the metric space is established in the form M = (O, d). In this case, d represents the distance function while O refers to the feature values' domain.
d(Ox, Oy) = d(Oy, Ox)
d(Ox, Oy) > 0 (Ox ≠ Oy), d(Ox, Ox) = 0
d(Ox,Oy) ≤ d(Ox, Oz) + d(Oz, Oy).
In O, the objects are represented by Oz, Oy, and Ox. To determine any similarity or dissimilarity between objects, d is considered as the informative parameter. For M-Tree, the entries that can be stored can go up to l, hence, l represents the node capacity. It is also important to highlight that M-Tree exhibits two internal node types. These nodes include the leaf nodes and the routing nodes; poised to represent data or samples. Indeed, M-Tree functions through sample organization to ensure that fixed-sized nodes are achieved. Notably, the resultant nodes correspond to the metric space' region.
M-Tree grows in a bottom up fashion. When the number of leaf nodes grows beyond the capacity of the routing node, a new node from the pool is promoted as a routing node and the tree is split and nodes partitioned between the two routing nodes based on the partitioning policy.
M-Tree provides a very fast and efficient nearest neighbor search. M-Tree search is based on the concept that if a sample Q is at a distance of d(Or, Q) and another sample P is at a distance of d(Or, P), then the distance between d(Q, P) will always be greater than | d(Or, Q) – d(Or, P) |. This follows from the triangle inequality which states that
This simple inequality optimizes the search for the nearest neighbors of each sample as all these points are organized in a metric space.
Imperatively, these methods are meant to operate on single machines. As such, the techniques become impractical and inefficient when a given sample involves big data. In one of the previous investigations, it was documented that a combination of Spill Trees and M-Trees scales in a case involving distributed sample space, ensuring further that similar samples are searched efficiently [37]. In the current investigation, the central purpose is to present a hybrid technique through which artificial minority data could be generated. Using scalable K-Means++, similar samples are clustered together. Also, M-Trees are used to index the samples before searching for the perceived k-nearest samples.
3. PERFORMANCE MEASURES
As the minority (smaller) data is devastated by the majority data present, for this reason the problem of imbalanced classification which was described previously can't be contrasted through the use of accuracy metrics. For illustration, the accuracy of the prediction can simply be taken as 99.8% accurate in case a provided dataset has a 998:2 distribution, by means of merely predicting entire data as the majority class. Table 1 is being implemented based upon complete confusion matrix and that confusion matrix is essential for the issues related to imbalanced classification.
| Actual Class | Predicted Class |
|
|---|---|---|
| Positive | Negative | |
| Negative class | FP (False Positive) | TN (True Negative) |
| Positive class | TP (True Positive) | FN (False Negative) |
Confusion Matrix for a SAMPLE two-class problem.
Relative to the case of the confusion matrix, it is evident that the performance categorization for negative and positive classes can be discerned. The TPR, recall, or true positive becomes:
The resultant value obtained from the equation above represents the percentage of positive situations that have been categorized accurately. Regarding FPR, the false-positive rate, it represents the percentage of negative situations that have not been categorized accurately. It is expressed as:
Lastly, the FNR, which indicates the false-negative rate, it refers to the percentage of positive situations where there has been inappropriate categorization. The parameter is expressed as:
Combining the FPR and the TPR in one metric calls for the plotting of TPR against FPR. The resultant curve becomes the ROC (Receiver Operating Characteristic). The area under the curve (the ROC curve) becomes the AUC.
Other common metrics through which the classes' joint performance has been maximized include the true rates' Geometric Mean (GM) and the AUC. Whereas the aim of the GM lies in accuracy maximization relative to the respective classes, the AUC metric seeks to manifest trade-offs between costs and benefits. GM is expressed as:
4. ALGORITHM
In situations, where distributed environments have seen SMOTE-based oversampling procedures applied, most of the results have proved less successful [6,7]. This failure continues to be attributed to the data's random partitioning, as well as artificial sample generation; with these parameters lacking spatial relationships. In this study, we try to resolve that issue with the help of effectually segmenting and dispensing the dataset in space. Apache Spark-based SMOTE implementation is being represented in our work for big data smaller (minority) dataset. We need to determine closest neighbors for a point in d dimensional space in order to originate samples (for minority class) synthetically, for the context of issue or problem which we are tackling. The data distribution to several different nodes which is done randomly in a distributed cluster, might result in distribution of points to different nodes rather than their nearest nodes, hence it will become unfeasible for different individual nodes to identify their closest neighbors. Therefore, for problems where the dataset is very big and most probably distributed across a cluster of machines, it is significant that the identical samples are clustered and samples belonging to a cluster brought to a machine so that all the samples belonging to a cluster now are present on a single machine. That is, we re-distribute the data in such a way that all the samples which belong to a cluster are present on a machine. These different clusters on different machines can then be processed in parallel to generate synthetic data using SMOTE. Though the dataset is huge, the individual groups that we create can fit on a single machine and hence can be processed independently and in parallel, thus providing motivation to solve this complex problem.
During the application of SMOTE, the main objective is to determine the most efficient way through which the data could be partitioned. One of the perceived convenient ways involves the random grouping of data to obtain m clusters. Despite the contributory role of this technique, it remains notable that it requires that each query is run through the clusters in the entirety. Algorithms 1–4 detail the techniques for the searching, indexing, and partitioning M-Trees.
A. Algorithm 1: Cluster the dataset
cluster the samples using the scalable k-means api provided by spark ml library.
Number of groups given as input for clustering should be equal to the number of partitions/nodes
For each sample do
id closest pivot for each point end for each sample do calculate distance with pivots
parent pivot = pivot with shortest distance done for each cluster do
Push each cluster to a different node/machine done
Up sampling ratio and nearest neighbors (k) provided as input
Number of synthetic data to be generated per sample (m) is given by:
(this part runs on individual nodes/computers)
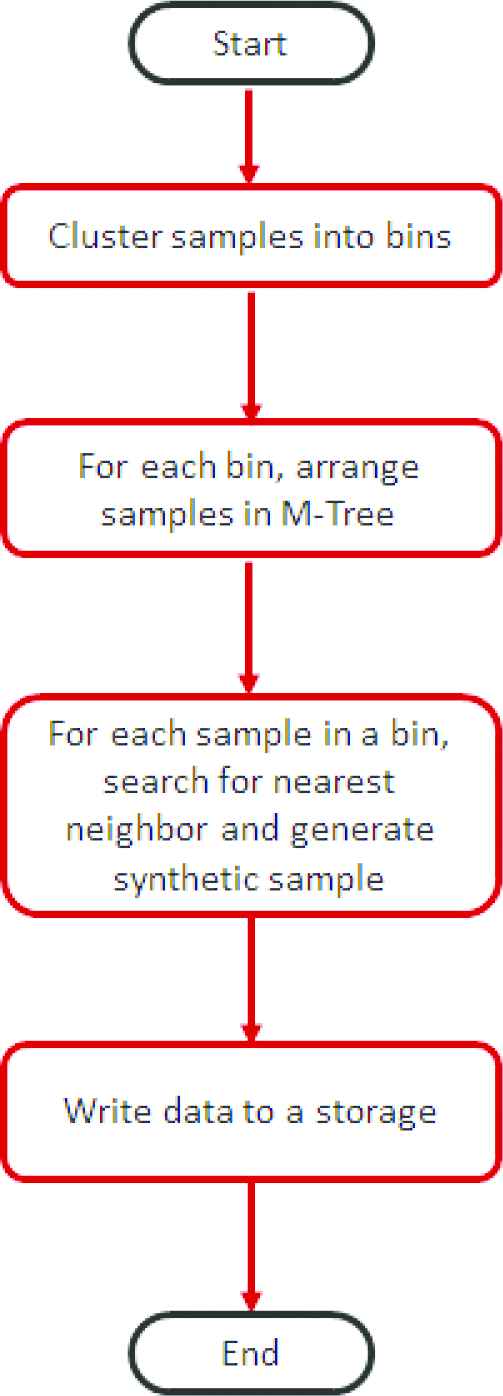
Given the respective partition, perform the procedure for individual samples. Also, establish an M-Tree (the second algorithm) end for the respective samples in the selected or target partitions before searching “k” nearest neighbors from the establish M-Tree, the third algorithm. Given the individual “k” neighbors, establish m synthetic samples to achieve the fourth algorithm.
B. Algorithm 2: Build M Tree
This algorithm takes the capacity of the M-Tree (c) as the input.
init: add the first point as a router
for p each sample in the partition
do
calculate the distances from each router
choose the router with minimum distance
if distance > router covering radius
update covering radius
add the sample as leaf node to the router
increment leaf count
if leaf Count > maxLeafSize:
promote another leaf node to router
split the leaf nodes between
the two routers
done
C. Algorithm 3: Finding nearest neighbors
for each sample p in the partition do
store the first k points in a priority queue of size k
(priority = distance from point p, smaller distance
means higher priority)
if ( (distance of sample p from router – distance of another sample belonging to the router) > the max distance of the samples stored in the priority Q )
ignore the sample
else
calculate the distance from sample p and
store the sample in the priority Q
end if
done
D. Algorithm 4: SMOTE
for all the partitions/groups of samples
for each sample p in partition
for each of the k neighbors
gap = random number between
0 and 1
synthetic [attribute] = p [attribute] +
gap * difference in values of this attribute between
p and neighbor
done
The choice for “n” took some experimentation where-in we tried for various distinct values of n and found that the optimum results were obtained for n = 5
Given larger sets of data, they could be clustered or segmented using different techniques. An example of a fast algorithm that could achieve this role is Scalable K-Means [28]. In this study, the spark implementation of scalable K Means++ is employed. The use of this approach is to ensure that large sets of data are segmented to yield m spaces. Upon data clustering, M-Trees are established for sample indexing before establishing the nearest k-neighbors for the respective samples. Indeed, M-Tree serves the role of partitioning objects via relative distances. In this investigation, the Euclidean approach is employed and seeks to ensure that the objects are transformed into fixed-sized nodes, aligning them to the metric space' constrained regions [33–36].
Upon point clustering, each cluster of points is pushed to the respective nodes before being arranged relative to M-Tree distances. Given the respective samples, the nearest neighbors are searched before generating synthetic samples.
5. DATASET
The ECBDL14 represents the data set employed in this investigation. In the context of Vancouver, Canada, this set was used at one of the data mining competitions (GECCO-2014) [14]. The set involves a Big Data problem with imbalance bioinformatics. Whereas there were 631 attributes and 32 million instances, positive instances were found to be 2%. This study relies on ECBDL14's two imbalanced sets of data; 80:20. The sets are generated in such a way that the same class distribution is considered. For training purposes, the investigation also considers a larger dataset. However, when it comes to testing procedure, a smaller set (20%) is used. With 631 representing a large number of features, the feature reduction procedure has been employed to ensure that relevant and utmost appropriate features are acquired. In particular, the feature reduction translates into concentration on 30 out of the original 631 features. Using the Hadoop Map Reduce approach, the SMOTE implementation, which is distributed, is benchmarked using the ECBDL14 dataset [20,38].
To compare the performance of the algorithm with the results obtained from previous approaches such as scikit-learn python implementation of SMOTE, two additional sets of data are used. They include sat image [39] and yeast [40], which originate form UCI viz abalone [41].
The framework or we can say infrastructure which was utilized for these experiments consist of a cluster of four Centos 6.6 Linux Machines each having eight cores and 20 GB RAM. Spark 2.2.0 was used to configure the cluster and input as well as output data was stored with the help of Hadoop HDFS.
6. ANALYSIS
The input parameters to the algorithm were as follows
The number of clusters to be created by scalable K-Means++ was taken as eight. The # of clusters must be tuned so that it is neither too high nor too low. Providing a small number of clusters may again lead to a problem where all the samples belonging to a cluster may not fit into a single machine (disk and/or memory). Setting the number of clusters too high though may increase the parallelism and throughput but may cause the samples which are similar and near to one another to fall into different clusters thereby decreasing the quality of the synthetic data produced as the SMOTE algorithm relies heavily on finding the nearest neighbors. This number must be tuned based on the dimension of the dataset and the segment (cluster) specifications with the emphasis on using the least possible for the cluster configuration.
Another crucial input parameter that is worth considering involves the number of nearest numbers that need to be used to ensure that the synthetic data is generated. Particularly, the stage focuses on the number of nearest neighbors to be sought from the respective samples, upon which the SMOTE algorithm could be used to establish synthetic data. In this investigation, five is the number at which the number of nearest neighbors used to generate synthetic data is kept. In the study by Chawla [16], this approach was employed.
Up-sampling ratio determines the fraction by which we need to up-sample the minority dataset. A ratio of one would generate the minority samples so that they are equal in count with the majority samples. Providing an up-sampling ratio of 50% will create a final distribution of majority samples vs minority samples to be in the ratio of 2:1.
M-Trees are balanced trees and each routing node of the tree has a maximum size (capacity) of leaf nodes that it can store. The KNN search for a sample is performed in each of these leaf nodes belonging to the routing node. A large capacity may improve the quality of nearest neighbor search but may impact the throughput as larger number of samples need to be searched for identifying the nearest neighbors while a smaller leaf capacity may split the similar samples into two different groups thereby reducing the quality of the samples generated. Tuning the capacity of the M-Tree is important and for this experiment we arrived at a size of 5,000 after few experiments.
Minority class data was originated synthetically with the help of our algorithms. Then we merged that data with the 80% data set, which we have set alongside for the purpose of training.
Given the ECBDL set of data, the accuracy of the model was assessed using h2o-based classification algorithms linked to the distributed random forest (DRF). This process targeted the 20% test data that was achieved after feature reduction [42]. The model parameters employed in this study included sat image datasets, yeast4, and the scikit python implementation of Random Forest for the abalone (Tables 2 and 3).
| Dataset | #Attr | Class (Max:Min) | # Class (Max:Min) | %Class |
|---|---|---|---|---|
| ECBDL 4 2.89 million samples | 631 | 1:0 | 2,849,275:48,637 | 98.3:1.7 |
| KEEL abaolone19 4174 samples | 8 | 1:0 | 4,142:32 | 99.23:0.77 |
| KEEL yeast4 1484 samples | 8 | 1:0 | 1,433:51 | 96.56:3.44 |
| UCI Satimage 9453 samples | 36 | 1:0 | 5,809:626 | 90.27:9.72 |
Distribution for the dataset BEING used.
| Parameter | Value |
|---|---|
| # of Clusters | 8 |
| Nearest Neighbor | 5 |
| Upsampling Ratio | 1 |
| M-Tree Capacity | 2,000 |
Input parameters.
From the Spark implementation, the synthetic data's accuracy was benchmarked via minority data generation, facilitated through SMOTE's scikit-learn python implementation [38]. Also, various input parameters aided in the tuning of the performance of the algorithm. Indeed, optimal outcomes were realized at a point when four was set as the number of clusters; with the M-Tree set's leaf size set at 50 (for the case of the smaller set of data—that was less than 10,000). For the larger data set, optimal outcomes were also achieved when the study's conditions were set in such a way that the leaf size was set at 2,000 and the cluster number established at 8 or 16. Tables 4 and 5 represent the Confusion Matrix, GM, Recall, and AUC for the implemented DRF and Random Forest. Indeed, the outcomes demonstrate that there is 100% data sampling in relation to the minority data.
| Algorithm | Parameters |
|---|---|
| Distributed Random Forest h2o | Number of Tress: 50.00 Sample Rat: 0.6300 Maximum Tree Depth: 20.00 NBins: 20.00 |
Random forest parameters.
| Technique | AUC | Recall | GM | Confusion Matrix | |
|---|---|---|---|---|---|
| No Sampling | 0.50 | 0 | 0 | 0 | 5 |
| 0 | 830 | ||||
| Python version of SMOTE | 0.78 | 0.60 | 0.76 | 3 | 2 |
| 26 | 804 | ||||
| Spark Distributed SMOTE | 0.78 | 0.80 | 0.84 | 4 | 1 |
| 89 | 741 | ||||
GM, geometric mean; SMOTE, Synthetic Minority Oversampling Technique.
Performance comparison (Abalone Dataset).
Findings suggest further that the Spark SMOTE-based implementation tends to exceed or match compared to a case in which the Python SMOTE implementation is applied. These observations are evidenced by the information in Tables 5–8. Therefore, the distributed Spark SMOTE exhibits superior performance; with a similar trend observed even in situations involving an increased amount of dataset.
| Technique | AUC | Recall | GM | Confusion Matrix | |
|---|---|---|---|---|---|
| No Sampling | 0.57 | 0.14 | 0.37 | 1 | 6 |
| 0 | 290 | ||||
| Python version of SMOTE | 0.90 | 0.85 | 0.90 | 6 | 1 |
| 14 | 276 | ||||
| Spark Distributed SMOTE | 0.85 | 0.72 | 0.83 | 5 | 2 |
| 11 | 279 | ||||
GM, geometric mean; SMOTE, Synthetic Minority Oversampling Technique.
Performance comparison (Yeast4 Dataset).
| Technique | AUC | Recall | GM | Confusion Matrix | |
|---|---|---|---|---|---|
| No Sampling | 0.78 | 0.65 | 0.80 | 125 | 86 |
| 43 | 1,746 | ||||
| Python version of SMOTE | 0.78 | 0.75 | 0.76 | 160 | 51 |
| 113 | 1,676 | ||||
| Spark Distributed SMOTE | 0.78 | 0.83 | 0.87 | 175 | 36 |
| 169 | 1,620 | ||||
GM, geometric mean; SMOTE, Synthetic Minority Oversampling Technique.
Performance comparison (UCISat Dataset).
| Technique | AUC | Recall | GM | Confusion Matrix | |
|---|---|---|---|---|---|
| No Sampling | 0.90 | 0.83 | 0.83 | 12,124 | 2,447 |
| 145,949 | 708,854 | ||||
| Python version of SMOTE | 0.79 | 0.78 | 0.78 | 11,442 | 3,129 |
| 184,402 | 670,401 | ||||
| Spark Distributed SMOTE | 0.78 | 0.80 | 0.84 | 1,1298 | 3,273 |
| 193,264 | 661,539 | ||||
GM, geometric mean; SMOTE, Synthetic Minority Oversampling Technique.
Performance comparison (ecbdl dataset).
Given a large dataset, an application of SMOTE (on the ECBDL set of data in this case) is seen to fail to steer improvements in minority class prediction—compared to situations where SMOTE is not employed. The implication is that SMOTE is unlikely to prove beneficial to the given dataset because does not yield a significant improvement in minority class prediction. On the other hand, Spark-based distributed SMOTE exhibits superior performance when employed in situations involving large sets of data, outperforming sklearn Python implementation. Hence, the results validate our implementation.
Indeed, the findings demonstrate that the use of M-Trees for establishing the nearest neighbor and also the implementation of the distributing data aid in preserving spatial sample arrangements. In turn, high-quality artificial samples are generated, ensuring that the desired scale and degree of accuracy are realized with increasing volume of datasets.
7. OBSERVATIONS
Given the proposed algorithm, the findings suggest the capability of realizing quality samples. The eventuality is that the minority samples' prediction is likely to be improved. With increasing volume of data, the results indicate that the traditional SMOTE tends to be less efficient, making it less applicable in situations involving large datasets. Previous research work [6,16,7] guided this investigation, paving the way for the expansion of SMOTE for a Spark-based distributed implementation. From the outcomes, especially when various parameters are benchmarked, the Spark-Based implementation exhibits superior performance. With our implementation of SMOTE we are able to generate synthetic data in a distributed environment when the dataset may not fit in a single machine.
An extension to the existing implementation can include an overlap when indexing samples in M-Tree so that samples which are at the partition boundary may be included in both the partitions. This may increase the quality of the samples generated.
However, it may be possible that SMOTE may not be the answer of all the data imbalance issues. Within class imbalance is not handled properly with this implementation of Distributed SMOTE. There is a need to merge the current solution with the techniques to identify within class imbalance and handle the within class imbalance accordingly.
Also, standard 1:1 up-sampling might not be optimum class dissemination in order to find the solution for data problems which are imbalanced. So the up-sampling ratio may be varied to achieve a better accuracy in different scenarios.
In future, there is a need for the further investigation of SMOTE in its entirety.
8. SUMMARY
This study involved the implementation of SMOTE via the Apache Spark Framework. The investigation was conducted based on M-Trees and K-Means algorithms. In future, the scope of such a study could be expanded by considering alternative SMOTE-based algorithms, including SVM-SMOTE and Borderline SMOTE 1, 2 [43]. In big data, the SMOTE-based dependency reflects the clustering algorithm in use. Proving more effective, the clustering algorithm is seen to exhibit superior performance due to the provision of more accurate results. Notably, the SMOTE implementation could be extended to ensure that it incorporates class disjuncts. Other areas that are worth utilizing include hybrid trees and Spill trees. Through their implementation, it is predicted that there might be improvements in the performance of the nearest neighbor algorithm, as well as the clustering process.
REFERENCES
Cite this article
TY  - JOUR
AU  - Sakshi Hooda
AU  - Suman Mann
PY  - 2019
DA  - 2019/07/30
TI  - Distributed Synthetic Minority Oversampling Technique
JO  - International Journal of Computational Intelligence Systems
SP  - 929
EP  - 936
VL  - 12
IS  - 2
SN  - 1875-6883
UR  - https://doi.org/10.2991/ijcis.d.190719.001
DO  - 10.2991/ijcis.d.190719.001
ID  - Hooda2019
ER  -