
A Siamese Neural Network Application for Sales Forecasting of New Fashion Products Using Heterogeneous Data
- DOI
- 10.2991/ijcis.d.191122.002How to use a DOI?
- Keywords
- Sales forecasting; Siamese neural networks; Fashion products; Fashion retail
- Abstract
In the fashion market, the lack of historical sales data for new products imposes the use of methods based on Stock Keeping Unit (SKU) attributes. Recent works suggest the use of functional data analysis to assign the most accurate sales profiles to each item. An application of siamese neural networks is proposed to perform long-term sales forecasting for new products. A comparative study using benchmark models is conducted on data from a European fashion retailer. This shows that the proposed application can produce valuable item level sales forecasts.
- Copyright
- © 2019 The Authors. Published by Atlantis Press SARL.
- Open Access
- This is an open access article distributed under the CC BY-NC 4.0 license (http://creativecommons.org/licenses/by-nc/4.0/).
1 INTRODUCTION
For fashion retailers, sales forecasting is crucial for planning, inventory and retail management. Sub-optimal management leads to unbalanced stock levels among stores, lost sales or excessive devaluation of the goods at the end of the season [1]. Retail sales modeling is challenging because the data are typically affected by a lot of exogenous variables: they suffer from sudden changes of customers' preferences and stores' strategy, they are affected by seasonality effects, global and local trends, weather, competition and other factors. Fragmentation is another typical feature of retail data, as one item can be sold in a number of variants, sizes and colors. Furthermore, pricing strategies strongly affect sales. All these mentioned factors interact in a complex way; some can be modified by the retailer, others cannot, and some are even non-predictable [2]. Typically, retailers aggregate their products according to a hierarchical classification providing item category, subgroups, model, color, size and sometimes fabric. Usually, some of those characteristics are codified and recorded in the company information systems.
For new products, historical sales data is not available. However, the characteristics of new items, their description and images are usually available. Presently, technology, social media and web data allow more and also new types of data to be collected. For example, images of the garments are often available. This type of data appears to be very interesting from the forecasting point of view, because the style of a fashion product is one of the most significant factors of purchase. The image of a fashion product contains a large amount of information, even if sometimes it not easy to be described and classified. Therefore, the use of images can be valuable input for the sales forecasting of fashion products.
In existing literature, a number of studies deal with sales forecasting, based on historical sales data, at the highest levels of hierarchy, i.e., commercial categories. Managers often use three different forecasting techniques: qualitative methods [3], classical statistic techniques such as time series (Moving Average and Exponential Smoothing) or regression analysis [4]. In the last few decades, artificial intelligence techniques, such as fuzzy systems, neural network (NN) and hybrid models integrating multiple intelligent techniques, are being used more frequently in retail forecasting. Among these artificial intelligence techniques, the NN model is one of the most commonly used. It has been proved to be universal approximator and can effectively model various time series and non-time series [5]. A number of studies [6–8] also demonstrates that the NN approach outperforms the classical models due to its capacity of non-linearity and generalization.
When a forecast is made at the single Stock Keeping Unit (SKU) level for new products, no historical data is available, and as a result it is not possible to use traditional methods. For that reason, new product forecasting is often cited by many companies as one of the most difficult forecasting problems retailers face [9]. This situation is typical in the fashion industry, as most fashion collections are new products. Thus, some companies forecast sales for new products by looking for comparable historical items. This kind of match can rely on manager experience and skills, and be based on visual attributes (like style or color) or on other descriptive criteria (Figure 1). However, it is hard to identify which past products are similar due to large product variety and frequent product changes. Furthermore, this approach is based on descriptive criteria matches, although there is no guarantee that it corresponds to a good match of sales profiles.

Skill based model for long-term sales forecasting of new fashion products.
In [10], the authors propose a forecasting system based on clustering and classification tools which performs long-term item level forecasting adapted from the works in [11] and [12]. For new products, they studied the effects of three variables (item price, the beginning period for sales and the life span of the product, called descriptive criteria) on sales profile. Historical data was used to build a decision tree to carry out understandable links between descriptive criteria and sales profile prototypes. Then, the decision tree is used to associate future items with one of the defined prototypes according to the descriptive criteria. This model, called
A longitudinal clustering of sales profiles is performed
A decision tree linking the cluster outcome to item attributes is built
For new items, profile cluster is forecasted using the decision tree
Notice that
From mentioned research and the new opportunities offered by the image processing with artificial intelligent techniques, we propose in this paper a novel approach to provide SKU sales profile forecast. First, a distance between sales patterns of two historical items is defined; then, a siamese neural network (SNN) is used for learning the relation between the item characteristics and the sales distance. Thus, the images of the items are used as descriptors, enriching the set of descriptive criteria. Finally, it is possible to predict the sales distance between new products, with their descriptive criteria including their image, and the historical products. Historical items for which the predicted sales distance is minimum are then used as references for sales forecast. The method is inspired by the managerial process, but is completely automatic. It can manage a large number of items and attributes and avoid misleading matches (Figure 2).
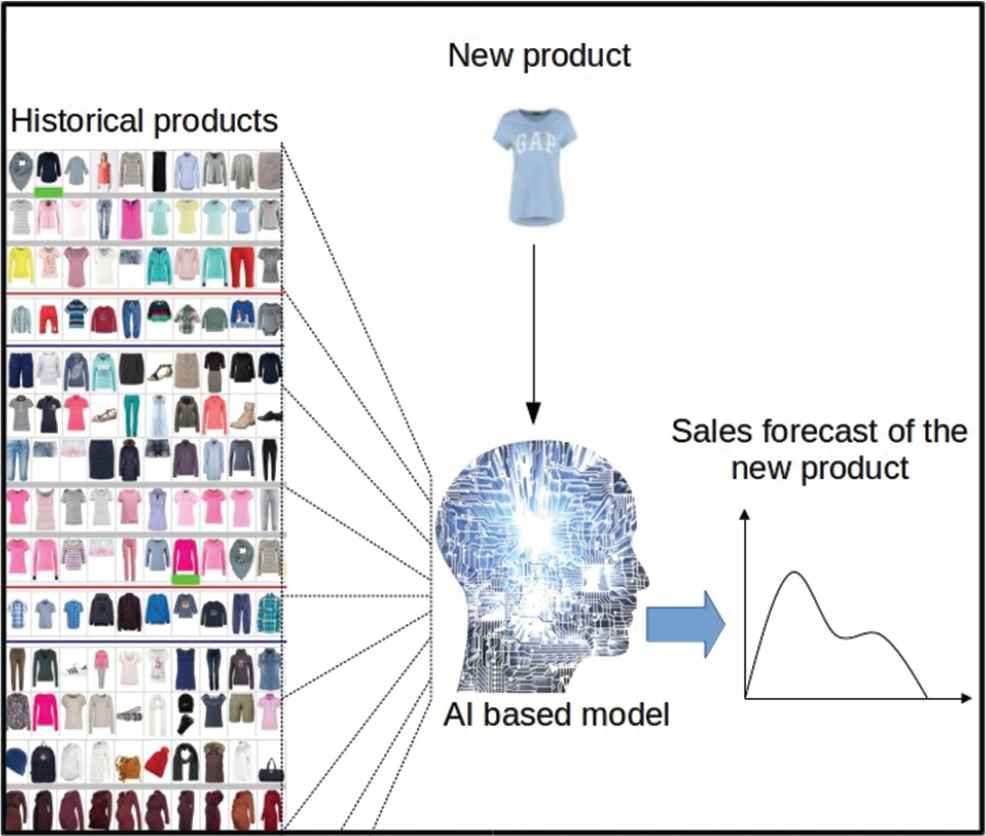
AI based model for long-term sales forecasting of new fashion products.
We built a process using both classical descriptive criteria and unstructured data, such as images, at the same time. This allows the retailer to exploit all of the available information on the products, even from small collections. The proposed process consists of a number of preprocessing steps, a learning phase, and forecasting steps. Existing models are used to perform each step of the process; their combination and the overall process represent the contribution of this paper to the state of the art, as limited work dealt with usage of past sales, images and attributes to provide sales forecast. This approach addresses multiple issues of long-term item level forecast:
It allows to use images to enrich the analysis and distinguish items with similar attributes but different visual design, in order to overcome also poor annotation of attributes
It can work well even with small fashion collections, as the maximum number of observations in the learning step is proportional to the square of the number of items
It allows to learn complex interactions between item features, due to the peculiar learning of NNs. This is necessary as it comes out that visual attributes may be poor explanatory variables at a first glance, but their interaction with other attributes may be valuable
It requires minimum calibration effort, as the process is almost completely data-driven. In particular, the process does not depend on any function fitting
The rest of this paper is organized as follows: Section 2 introduces the machine learning tools exploited for image processing and similarity learning: Convolutional and SNNs. The details of the proposed application are detailed in Section 3. We describe also possible similarity measures. In Section 4, a case study is presented. We applied our method to data from a European fashion retailer. We conclude in Section 5.
2 CONVOLUTIONAL AND SNNs
Among AI techniques, NNs emerge as the most popular and suitable to deal with unstructured data, such as text [15], conversation [16] or image [17]. However, NNs require a careful selection of input variables and network parameters such as the learning rate, the number of hidden layers, and the number of nodes in each layer in order to achieve satisfactory results [18]. It is also important to reduce dimensionality to improve learning efficiency. On the other hand, deep learning automatically extracts features from data and requires minimal human intervention during feature selection [19,20].
2.1 Convolutional Neural Networks
Convolutional Neural Network (CNN) is a type of feed-forward artificial NN. CNNs make the explicit assumption that the inputs are complex, which allows certain properties to be encoded into the architecture, making the forward function more efficient to implement and reducing the amount of parameters in the network. They have wide applications in image and video recognition [21], recommendation systems and natural language processing [22]. These systems can operate at the pixel level and learn both low-level features and high-level representations in an integrated manner. while they are more robust than classical techniques to geometric distortions of the input image. In order to extract features from input data, CNNs are typically composed of a combination of several layers; the convolutional layer, the pooling layer and the fully connected layer, as shown in Figure 3.
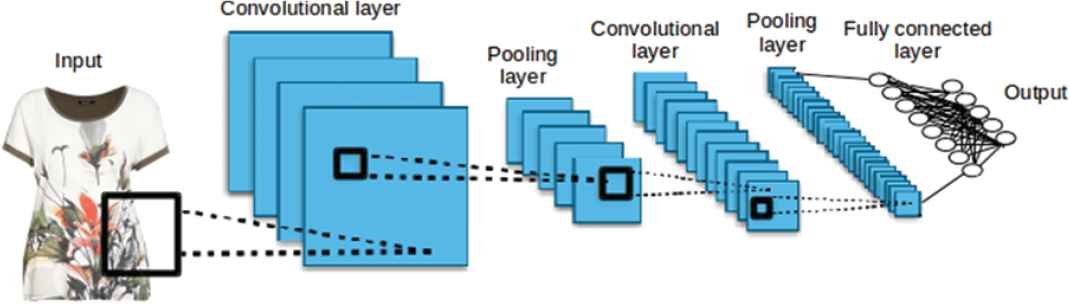
Convolutional Neural Network architecture.
Recently, CNNs have been largely used in the fashion industry, mainly in garment recognition [23] and recommendation systems [24,25], due to their capability to learn the features of cloth representation and to easily evaluate image similarity. Few works use CNNs to improve sales forecasting. [26] demonstrated that forecasting of long-term fashion trends could greatly benefit from visual analysis. However, this work is focused on total yearly sales of a style of garment, and therefore does not consider the sales profile of a particular SKU.
2.2. Siamese Neural Networks
A SNN consists of two twin CNNs which accept distinct inputs and are joined by an energy function at the top. This function computes a distance between the highest-level feature representation on each side, as shown in Figure 4. The parameters between the twin networks are tied, leading to a simpler model. SNNs ensure the consistency of predictions and symmetry, due to the identical inner working of the networks.
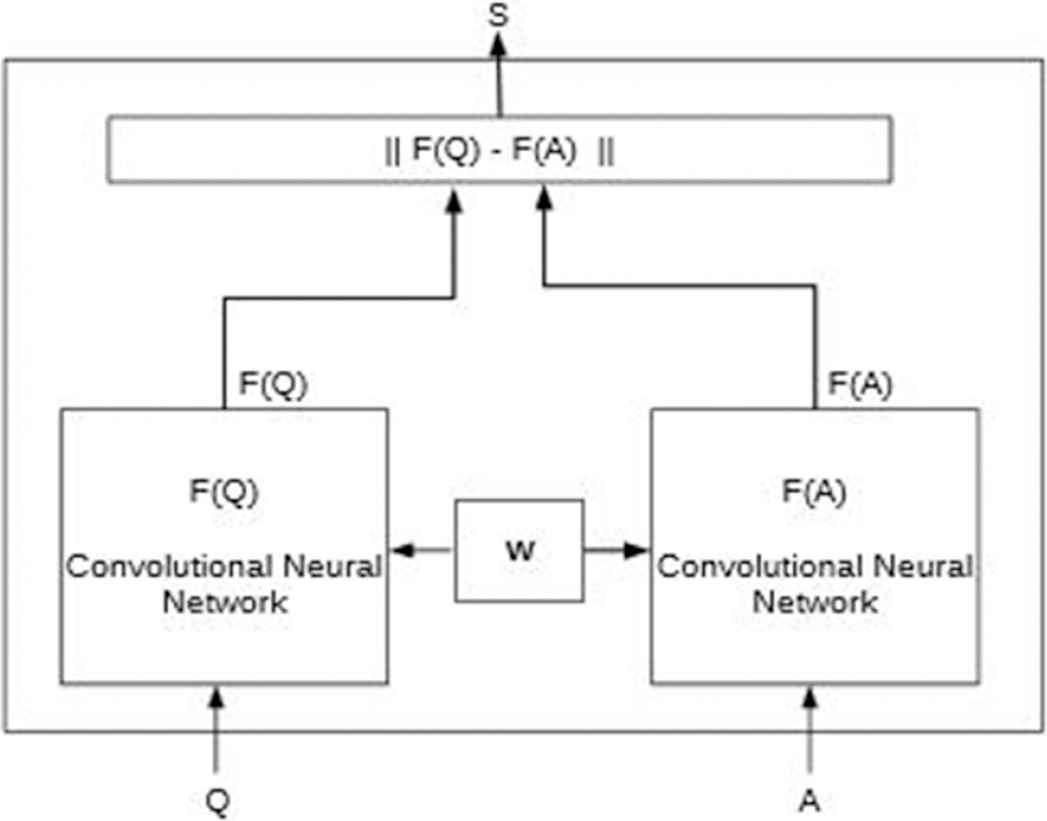
Siamese Neural Network architecture.
SNNs were first introduced to solve image matching problems [27], in particular the signature verification. Later, [28] used the architecture with discriminative loss function for face verification. Recently, these networks are used extensively to enhance the quality of visual search, for instance face recognition at Facebook [29], or even to learn the similarity metric for question–question pairs by leveraging the question–answer pairs available in Community Question Answering (cQA) forums [30].
In view of the above works, it obviously appears that
Image analysis of fashion products should provide a valuable improvement for fashion sales forecasting
Convolutional and SNNs emerge as the most suitable techniques to implement this image processing in sales forecasting
Thus, a system that aims to enhance the sales forecasting of new fashion products from images is proposed.
3 PROPOSED PROCESS
This study presents a sales forecasting process based on SNNs for new fashion products. The method consists of a learning step in which the model is calibrated, and a test step where performances of the model are evaluated and compared to benchmark models. A flowchart of the process is presented in Figure 5, whereas the steps are detailed in the following. The whole method takes into account sales data, images and attributes of historical fashion products as input data, and provides the sales profiles of new products.
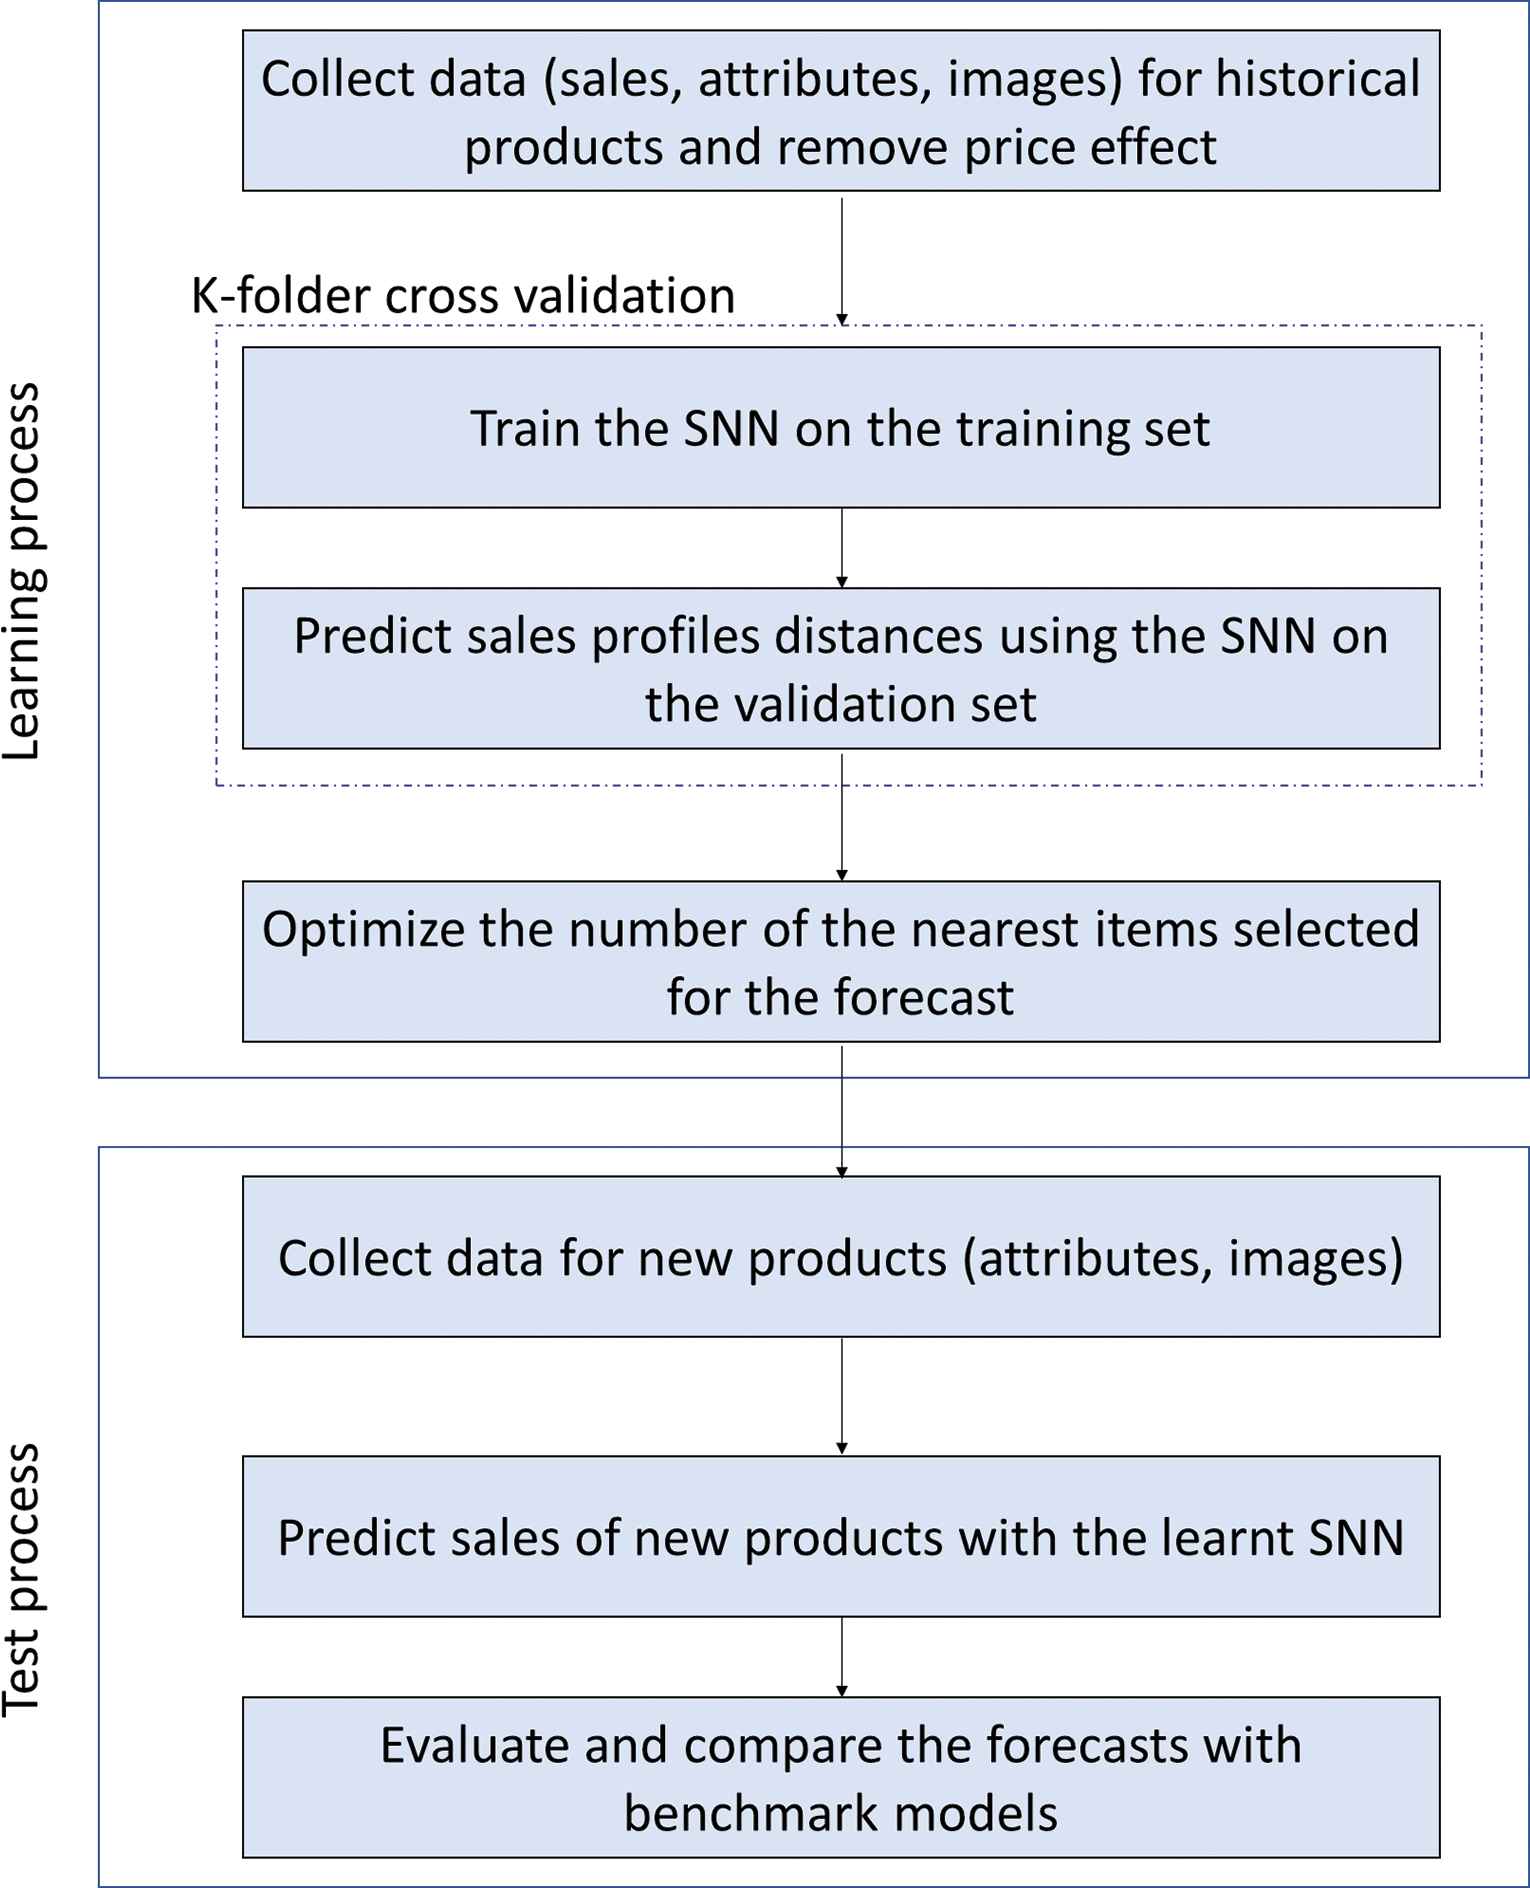
Flowchart of the proposed methodology.
3.1. Learning Phase
The learning phase allows the parameters of the model to be optimized and the most suitable similarity metric to be defined. The model is calibrated using sales of a part of the historical products (training set) to predict the sales profile of another set of historical products (validation set). Specifically, a k-fold schema is used to calibrate the prediction.
The learning phase is composed of 4 stages as follows:
Data collection and pretreatment
Training of the SNN to model relationship between sales profile distances and feature distances on the training set of historical products
Prediction of sales profile similarity on the validation set of historical data
Optimization of the number of the nearest items selected for the forecast
Notice that the stages 2 and 3 are reiterated inside the k-fold cross validation process.
3.1.1. Data collection and pretreatment
Sales of a single season are collected and grouped by week. For each item
Example of sales profiles before and after price normalization.
The direct effect of the price normalization is that sales profiles are less affected by price discount. Furthermore, this step indirectly guarantees that the distances between sales profile are slightly affected by punctual price initiatives.
3.1.2. K-fold cross validation
For a given item
The aim of the SNN is to model the relation between distance
Initially, item features are fully defined; categorical features are transformed in dummy variables and the set of numeric and dummy features is then joined with image features. Therefore, the standard SNN architecture is slightly modified, as shown in Figure 7, to integrate structured data as tags and attributes with the information derived from item images. This modification is needed to join all available data (tags and images) which constitute the complete DNA of the garment, as defined in Bracher et al. [34]. To be specific, input data are pairs of historical items composed by the attributes and the image of the items. Every image is then codified through a CNN. Finally, the attributes and CNN outputs are joined together and the distance between the features of the pair are compared to the sales distances.

The modified Siamese Neural Network (SNN) architecture.
In order to train the model using historical data, the set of historical items
It is possible to obtain many variations of SNN by changing the structure of CNN and the energy function. We tested two possibilities for the CNN:
The 50 layer Residual Network (ResNet50) as proposed in [35] and pre-trained on the ImageNet data set [36]
A simpler CNN (without pre-training) constituted of three convolutions with a ReLU non-linearity interspersed with max-pool layers
The first model is by far more complex, with about 23 million parameters against 260 thousand of the second. Applying these models on 200x200 images, ResNet requires about
3.1.3 Parameter optimization
From the above predicted distances
In the learning phase, this prediction can be compared to real normalized sales profiles to compute the total forecast error. There are several ways to measure forecast performance, including evaluating the forecast results in terms of accuracy, error, cost, efficiency, profit, and/or customer satisfaction. Common measurements (e.g., Mean Absolute Percentage Error (MAPE), Mean Absolute Deviation (MAD), and Root Mean Squared Error (RMSE)) have all been used by companies to assess the forecasting function. In this work, the use of RMSE is suggested:
The choice of
Thus, we calibrate the model by identifying the number
3.2 Test Phase
Once the model is fully defined, our procedure is tested on a set of new items of a new season.
The test phase consists of
Data collection for new products
Prediction of sales profiles of new products
Evaluation of the forecast errors and comparison with benchmark models
In order to evaluate performances of the application proposed in this work, forecasts are also made using two other methods dealing with the same forecast instance (long-term, item level, new product forecast),
4 EMPIRICAL STUDY
We applied the proposed method to real data from a European fashion retailer. We used historical data (sales, attributes and images) of womens tops from the 2015 and 2016 summer collections, and tested the methodology using sales from the 2017 summer collection, attributes and images. Thus, the dataset is built using 360 products from the historical collections and 88 products from the new collection. For each product, the following attributes are taken into account: initial price, life span, beginning period, subcategory, fabric and type of drop.
4.1 Model Learning
The learning process described in Section 3.1 is implemented on the 360 historical items.
The SNN used in this case is composed of two CNNs with three convolutional layers alternating with max-pool layers. The two output feature vectors relative to the two input images are chained together. Additional input vectors, composed of attributes are concatenated, if available. The resulting vector is then fed to a dense NN of three layers that returns the desired output. The non-linearity is ensured by rectified linear units (ReLU) for both the convolutional and the dense layers. Figure 8 shows the RMSE during the learning phase on the training and validation data. We used approximately 40.000 iterations of gradient descent, using the well known Adam method [38]. To avoid overfitting, dropout is used during the training, after the second layer of the dense NN with a drop rate of

Root mean squared error (RMSE) during the learning phase of the Siamese Neural Network (SNN).
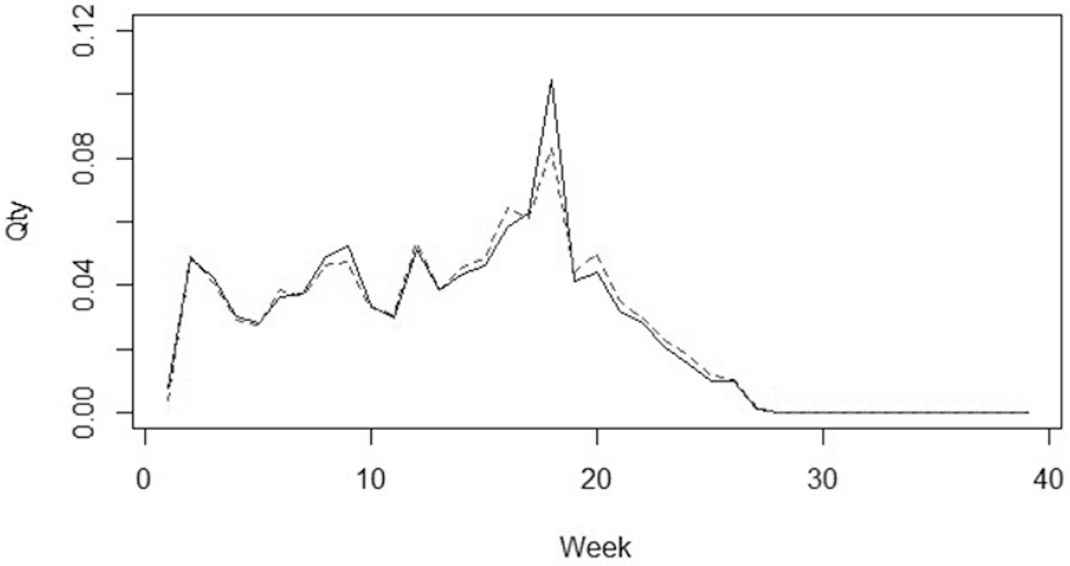
The learning process of the SNN enables the distances between sale profiles to be predicted for each product. Figure 9 proposes a synthetic view of the real and the predicted distances between profiles of one product

Comparison of real
From these predicted distances, the selection of the best number
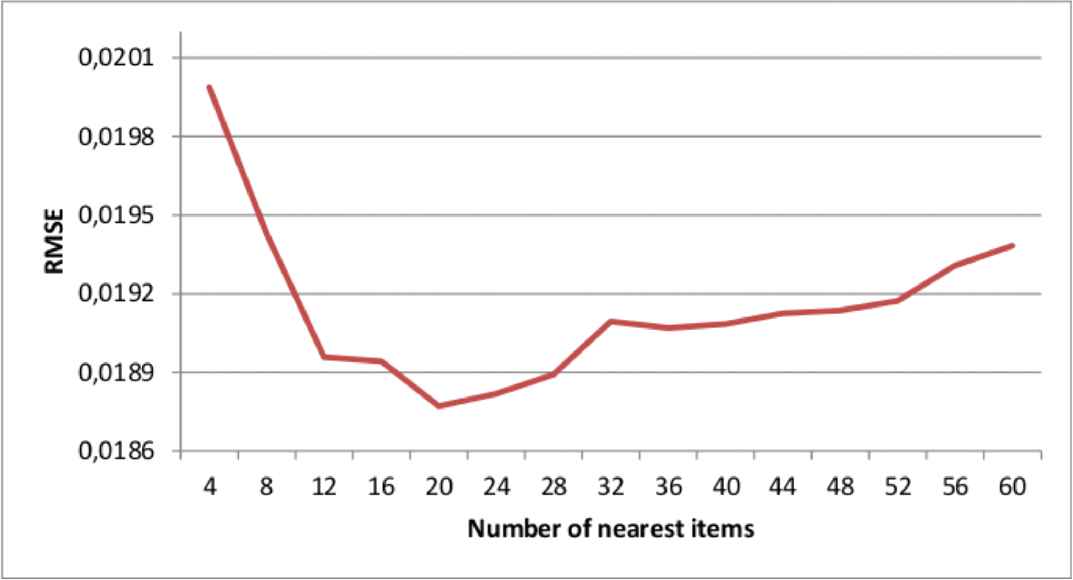
Root mean squared error (RMSE) for normalized sales profile with respect to the number n of nearest predicted items.
4.2 Profile Forecast of New Products and Result Comparisons
The trained SNN with
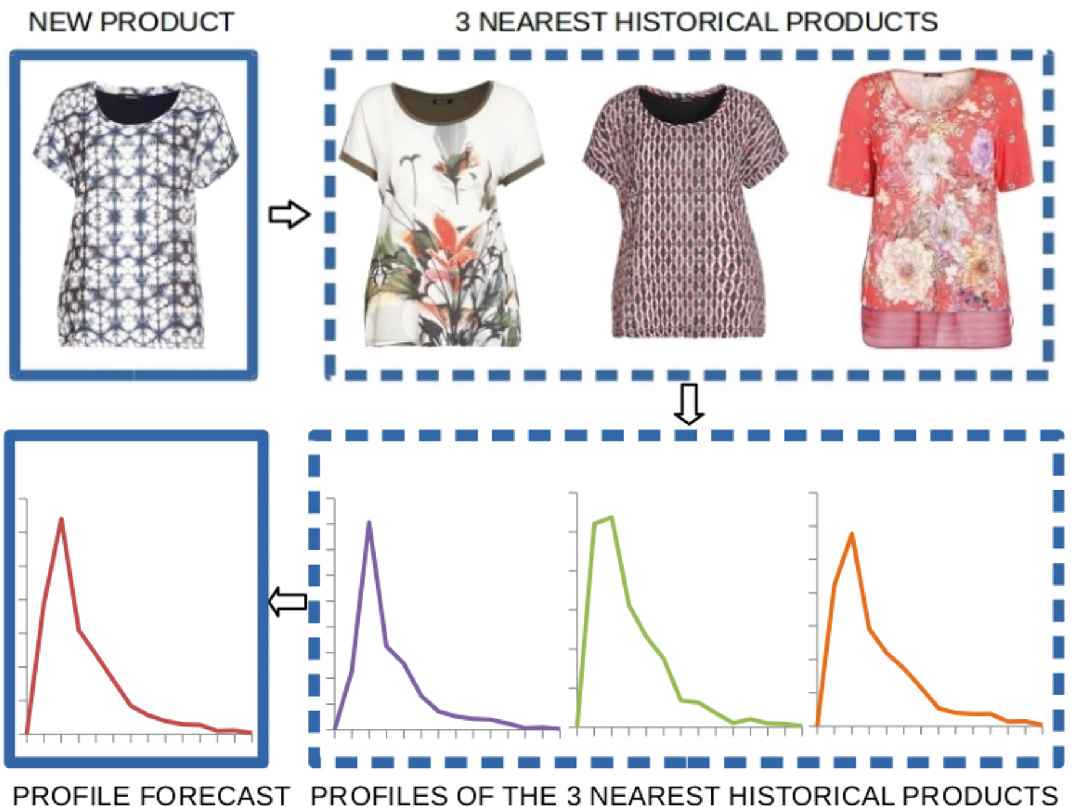
Example of profile forecasting process of a new product with the 3 nearest products.
Sales profile forecasting is also performed using the benchmark models described in Section 3.2:
| Mean RMSE | % of RMSE Improvement with SNN20 | |
|---|---|---|
| Profile Category | 0.0234 | 19.6% |
| 0.0199 | 5.5% | |
| SNN4 | 0.0200 | 6% |
| SNN60 | 0.0194 | 3% |
| SNN20 | 0.0188 | – |
RMSE, root mean squared error.
Comparison of mean RMSE on test data.
Considering these overall results, our model SNN20 (with

Boxplot of root mean squared error (RMSE) improvement between the SNN20 model and the other models.
Figure 13 illustrates the same observation with a distribution of the RMSE per product and gives a more detailed view of the failures of the SNN20 model.

Comparison of the root mean squared error (RMSE) per product between the SNN20 model and the other models.
From the analysis of this figure, we extract the two worst forecasts of the SNN20 model compared to the
For the products A and B, actual sales are very fluctuating and erratic. This can be explained, for instance, by the influence of unexpected exogenous factors. In a such situation, the sales are very difficult to predict and it is consistent that the simplest and most averaged model gives the best results.
For products C and D, the main problem arises from the beginning period of the sales. This issue cannot exist in real situations since the beginning period of the sales are mastered by the company. As a result, the manager can synchronize the forecast to the right date. This issue will be subject to future works. It can be noticed that the forecasts provided by the SNN20 model are still acceptable compared to the naive model.
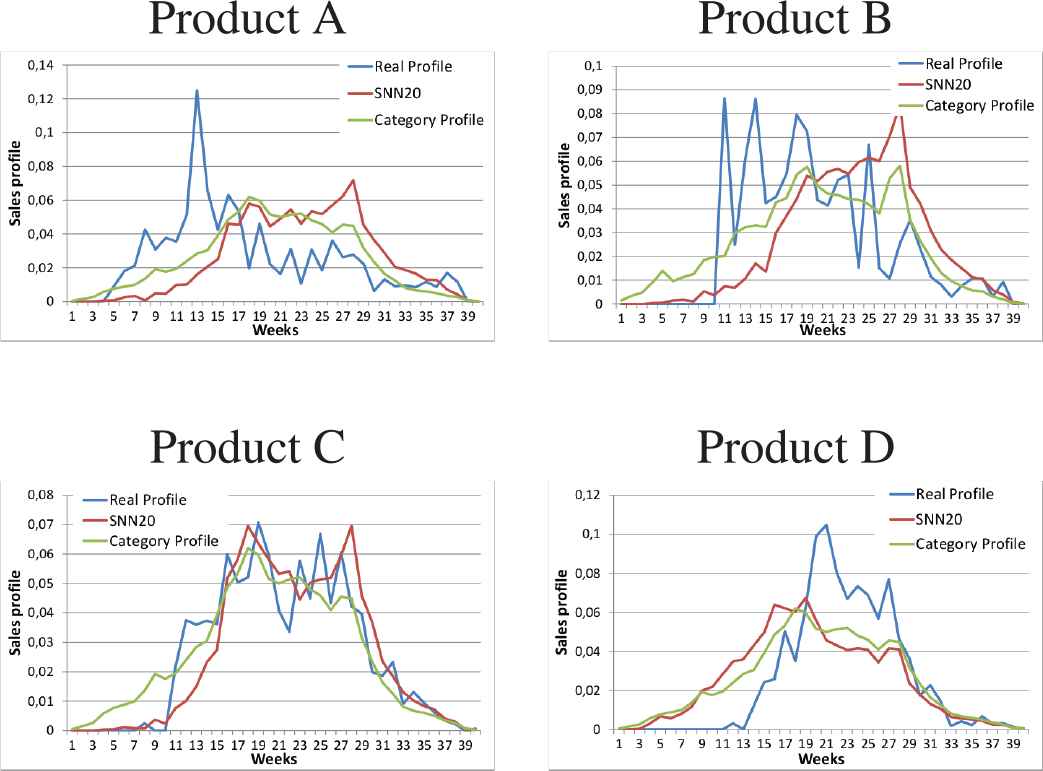
The 4 worst forecasts of the SNN20 model compared to the model.
Similarly, we extract the 4 best forecasts of the SNN20 model compared to the
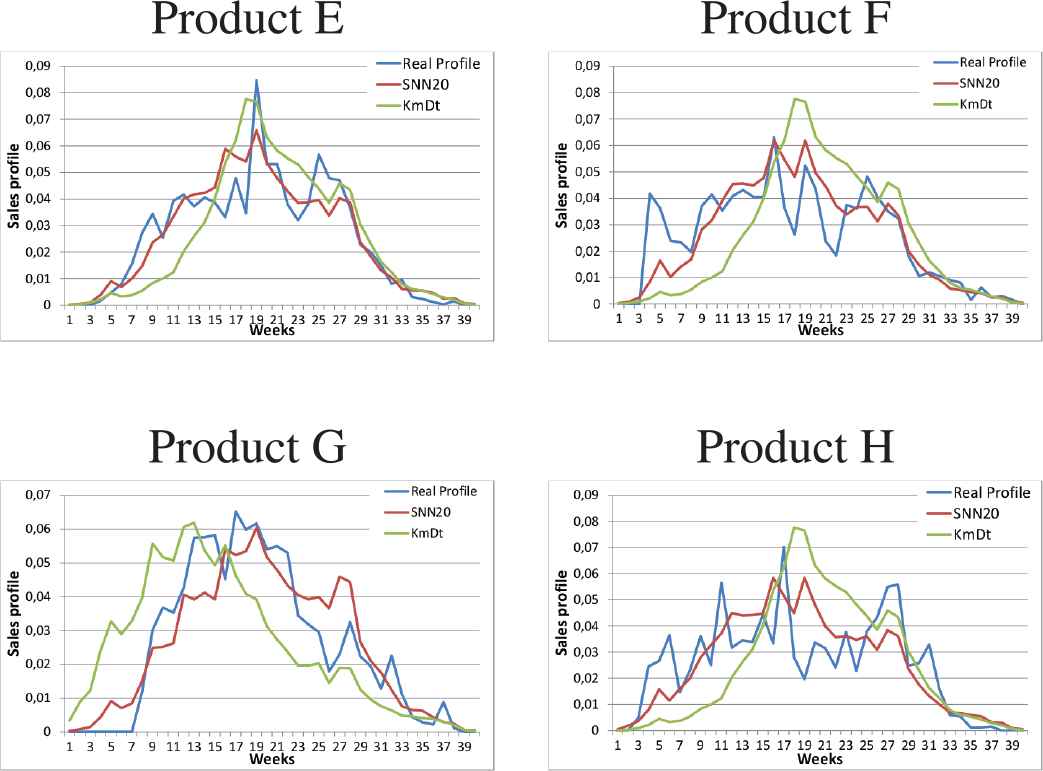
The 4 best forecasts of the SNN20 model compared to the model.
5 CONCLUSION AND PERSPECTIVES
A novel process was developed to forecast sales profiles for new fashion products. This process, consisting of a number of preprocessing steps, a learning phase and forecast steps using existing models, allows to build new product long-term item level forecast. In addition, it addresses a number of issues found in other methods such as the usage of multiple types of data. This model is based on a SNN which allows for the use of numerical and categorical input variables, as well as unstructured data such as images of the product. The main concept of the proposed process is based on the best practices, used in fashion companies, which consists of comparing the design, the style, the visual appearance and other technical attributes of new products to those of historical ones in order to perform sales forecasting. This method enables the most experienced and trained operators to generate quite satisfactory forecasts, but it is often limited by the number of products and attributes which are taken into account. This task can also be very time consuming for managers who have a considerable amount of other issues to deal with. Thus, the proposed method based on artificial intelligence techniques, aims to enhance this practice with a wider and deeper analysis of historical products. The proposed process is applied to real data from a European fashion retailer. Overall, the performance obtained with our model is better than the two models used for comparison: the
The beginning period of sales has to be integrated in a better way in the model. This date is considered as an attribute in the current model but it should be taken into account directly in the final forecast.
The training of the SNN can be consolidated with a more suitable and/or a larger database. The current model has been learned from scratch on a database of tops and T-shirts for women. A future investigation could consist in performing a pre-training of the model on a wider database including various heterogeneous categories, and a fine tuning on a specific database composed of the target category of garments. To balance the trade-off between the accuracy and the computational cost pruning techniques, as described in [40], could be used to reduce the effective size of the network. Alternatively, the features of the reference items could be pre-computed to speed up the inference.
The number of nearest products to achieve the final forecast is a crucial parameter. The optimization of this number could be further examined, for instance, by customizing this number for each product. The ranking of the historical products is also an interesting aspect which could disclose the most distinctive products. Furthermore, for each product, a confidence index could be computed from these rankings to indicate if the sales forecast is reliable.
The proposed method is fully automated and exclusively relies on artificial intelligence. This kind of model is successfully implemented for digital business but could be not accepted in fashion companies where subjectivity and creativity are the core business. In such a situation, a hybrid approach should be more suitable. Different methodologies can be considered, for instance, the models presented in Figure 16. The AI based model can help the operator by providing a set of potential products to take into account. Then the final forecast is produced with the skills and knowledge of the operator from this set (Figure 16 left). The human skills and knowledge can be also integrated into the AI based model to enhance the efficiency and direct the final result (Figure 16 right).

Hybrid models for long-term sales forecasting of new fashion products.
To conclude, long-term sales forecasting of new fashion products is a very challenging problem. As demonstrated in this work, the last advances in artificial intelligence and big data management offer new opportunities to deal with this fascinating issue. There is no doubt that further improvements will emerge in the near future.
AUTHORS' CONTRIBUTIONS
Giuseppe Craparotta contributed to state of the art and model design, data preprocessing, benchmark and model calibration. Sébastien Thomassey contributed to state of the art and model design, benchmanrk and results analysis. Amedeo Biolatti contributed to design, implement, test and verify the proposed model.
Funding Statement
This work was supported by ENSAIT (École nationale supérieure des arts et industries textiles).
ACKNOWLEDGMENTS
The authors gratefully acknowledge Evo Pricing and ENSAIT for promoting and collaborating to this research.
REFERENCES
Cite this article
TY  - JOUR
AU  - Giuseppe Craparotta
AU  - Sébastien Thomassey
AU  - Amedeo Biolatti
PY  - 2019
DA  - 2019/11/29
TI  - A Siamese Neural Network Application for Sales Forecasting of New Fashion Products Using Heterogeneous Data
JO  - International Journal of Computational Intelligence Systems
SP  - 1537
EP  - 1546
VL  - 12
IS  - 2
SN  - 1875-6883
UR  - https://doi.org/10.2991/ijcis.d.191122.002
DO  - 10.2991/ijcis.d.191122.002
ID  - Craparotta2019
ER  -