
Econometric Analysis of Disequilibrium Relations Between Internet Finance and Real Economy in China
- DOI
- 10.2991/ijcis.d.191128.001How to use a DOI?
- Keywords
- Internet finance; Real economy; Disequilibrium relations; Financial interrelations ratio (FIR)
- Abstract
In this paper, we evaluate the development level of internet finance by focusing on three major virtual economies, internet “Baby” fund, internet financial credit and Shanghai Composite Index for the first time. We examine the disequilibrium relations between the development of both internet finance and real economy by using Vector Autoregression (VAR) model, and measure the level of the deviation between them by using Financial Interrelations Ratio (FIR). We obtain the following results: 1) There is no Granger causality between internet finance and real economy, and the characteristics of non-balanced development is shown; 2) Their synergy is in the development stage of “mismatch”; 3) During the later stage of sample observation, internet financial credit is the key element of the mutual restraint between internet finance and real economy, and the deviation between stock market and real economy is within the controllable range.
- Copyright
- © 2019 The Authors. Published by Atlantis Press SARL.
- Open Access
- This is an open access article distributed under the CC BY-NC 4.0 license (http://creativecommons.org/licenses/by-nc/4.0/).
1. INTRODUCTION
With the advent of the fourth industrial revolution, the degree of virtualization in the global economy has continued to increase, and virtual assets have become more and more dominant in the process of economic virtualization. Although internet finance is a new thing, its rapid development and rapid changes have a huge impact on the real economy. With the growth of internet finance booming, its products are constantly emerging and deepening innovation. However, with the further development of internet finance, various risks of internet finance are gradually exposed. These risks have significant impacts on the stability of China's economic development, and under the dual influence of supply-side structural reform and the new economic, the uncertainty of the internet finance's impacts on the real economy has suddenly increased. Therefore, an in-depth understanding of the logical relationship between internet finance and the real economy is of great significance to the formulation of strategies, policies and systems for stable economic growth. Up to now, the development of internet finance in China can generally be divided into three phases. Phase 1 was from 1990 to 2005 when traditional financial industry went to the internet; Phase 2 was from 2005 to around 2011 when third-party payment thrived; Phase 3 was the phase when internet substantive financial business has developed ever since 2011 [1,2]. The brilliant performance of internet finance in China has gradually emerged with the promotion of supply-side structural reform, which triggered questions from academia and industry on its role to drive China's economy away from development of real economy. Therefore, since China's economy has entered high quality development, what is the impact from internet finance upon the development of real economy? Has it promoted or inhibited the development of real economy? Is the degree of “mutualism” or “restriction” high or low?
Relevant researches for the above questions mainly focus on the following three aspects: a) The evolution of the logic of internet financial behavior; b) Perspective of internet finance promoting the development of real economy, the features of internet finance's low transaction costs and high resource allocation efficiency have become the key advantages of its services to the development of real economy; c) Researches starting from their interaction, and taking the promotion of internet finance to real economy into consideration, as well as the risk of uncertainties brought by the rapid development of internet finance.
The essence of internet finance is to rely on big data and cloud computing and combine the spirit of the internet to form a new opened, functional financial form and corresponding service system on internet platform [3,4]. Its growth logic is to attach greater importance on the guarantee of “quality.” With the gradual implement of regulatory ideas, internet finance will further standardize the development of the entire system. And secondly, internet finance will emphasize more on product innovation, and highlight on providing service for real economy [5].
The development of internet finance has triggered the profound evolution of the entire financial ecology, therefore some scholars focus on its impact on traditional financial industry to reflect its impact on real economy. However, most of the existing literatures are limited to analyze the system with few empirical studies. By studying internet finance's impact on traditional financial system, especially on traditional commercial bank, Gong [6] concluded that internet finance will not affect the foundation of traditional financial system in the short term, but from the perspective of the long-term development, it is bound to replace the original business mode. By adopting the Baidu index of internet finance as the index to measure the development of internet finance, Hou et al. [7] found out that the development of China's internet finance changed the sensitivities of deposit growth rate toward the risk index of certain banks. To be specific, the development of internet finance weakened the positive correlation between deposit growth rate and bank capitalization, but it enhances the negative correlation between deposit growth rate and the risk assets of banks. Qiao et al. [8] empirically studied the impact of internet financial development on the relevance of risk preference of commercial banks and the monetary policy, and concluded that internet finance had changed the sensitivity of bank risk behavior to monetary policies, and this impact would change along with the ownership nature and size of bank. Jiang Song [9] adopted non-parameter test and concluded that there was a certain degree of deviation on the development trend between internet finance and real economy. Because the test results showed that the development of internet finance was the Granger cause of economy growth, while economy growth could not explain the reason of the development of internet finance. Chen et al. [10] used the data of 200 commercial banks in China from 2011 to 2016 to study whether internet finance with P2P (peer-to-peer loan) and third-party payment as the representatives has negative impact on commercial bank's profitability or not.
In addition, some scholars study the impact factors of uncertain risks. Financial innovation aggravates risk conductivity and the instability of financial system by increasing the categories of financial products. Guo et al. [11] used the internet finance development index of Peking University to conduct the research and found out that all traditional finance departments, infrastructures and local economic development have significant influence on the development of internet finance. Gómez et al. [12] analyzed the differences in the distribution of the Deposit Guarantee Fund risk and in the entities' contributions by using the bucket method with two different clustering techniques, k-means and soft computing, in a sample that represents more than 90% of the deposits covered in the Spanish banking system during the 2008 to 2014 period. Based on social network analysis method, Huang et al. [13] found that there were overflow effects of internet finance development existing among different provinces in China. The economy development level, industrial structure, development level of traditional finance and differences in geographical distance had obvious negative impact on regional overflow of internet finance's development. By using Systematic Contingent Claim Analysis (SCCA) model and stepwise regression method, Zhu and Hua [14] proved that internet finance's impact on bank industry in China, and predicted that with the development of internet finance, future risk of bank industry would rise.
Due to the short history and limitations of data, only a few literatures studied the impact of internet finance development on economy growth and analyzed its mechanism of action from the perspective of empirical analysis. The main reason is that the research on the relationship between internet finance and real economy involves both macro and micro fields and covers empirical and normative research methods, and that empirical research methods are relatively inadequate. Considering the virtual feature of internet finance, index selection to measure the degree of finance development mainly focuses on Shanghai Composite Index and stock value, etc., and index selection to measure economy development mainly focuses on industrial value added, output value of primary and secondary industries and GDP. However, from the perspective of the relationship between internet finance and real economy development, these indexes ignored financial transactions from internet platform.
In the paper, we intend to supplement and extend on the following two aspects. One is on the selection of analysis indexes for demonstration, to introduce seven-day annualized return of “baby” funds, monthly average return of P2P platform and Shanghai Composite Index as the indicators to measure the development of internet finance. The other one is to quantify the imbalanced development deviation between internet finance and real economy, adopt VAR method to test the imbalance between internet finance and real economy's growth, and then use Financial Interrelation Ratio to measure the deviation degree between internet finance and economic growth. This work can further extend the experience and evidence on the “mutualism” or “restriction” between internet finance and real economy. The contributions of this paper are as follows: 1) We innovatively expound the mechanism of the impact of internet finance development on economic growth; 2) We innovatively introduces the characteristics of internet financial products to describe the development degree of internet finance, and the research is more microscopic; 3) Unlike the previous qualitative analysis, we here quantitatively measure the non-equilibrium relationship between internet finance and the real economy.
2. THE MECHANISM OF INTERNET FINANCE AND REAL ECONOMY
2.1. Positive Mechanism of Internet Finance and Real Economy: “Mutualism”
Firstly, real economy is the fundament of internet finance. From the perspective of historical development, internet finance had not synchronous emerged with the emergence and development of real economic activities. But when the development of human economy and spiritual civilization evolve to a certain extent, and supplemented by the impact of technological progress, then internet finance emerges to adapt the times required. Therefore, internet finance depends on the stable, healthy and sustainable development of real economy. On a certain level, development scale and level of real economy determines the expansion scale and development potential of internet finance. Secondly, internet finance promotes the development of real economy. The emergence of internet finance is in response to people's living needs which originate from the development of real economy. This means that internet finance can provide capital support to real economy, and real economy can keep promoting the scale of reproduction and the expansion of industrial and commercial activities through the mode of “production—trade—consumption—reproduction.” Internet finance can transfer potential consumption demand into actual consumption capacity so as to promote the production and the increase of real economy. Figure 1 shows above mechanism of positive interaction between internet finance and real economy.
The mechanism of positive interaction between internet finance and real economy.
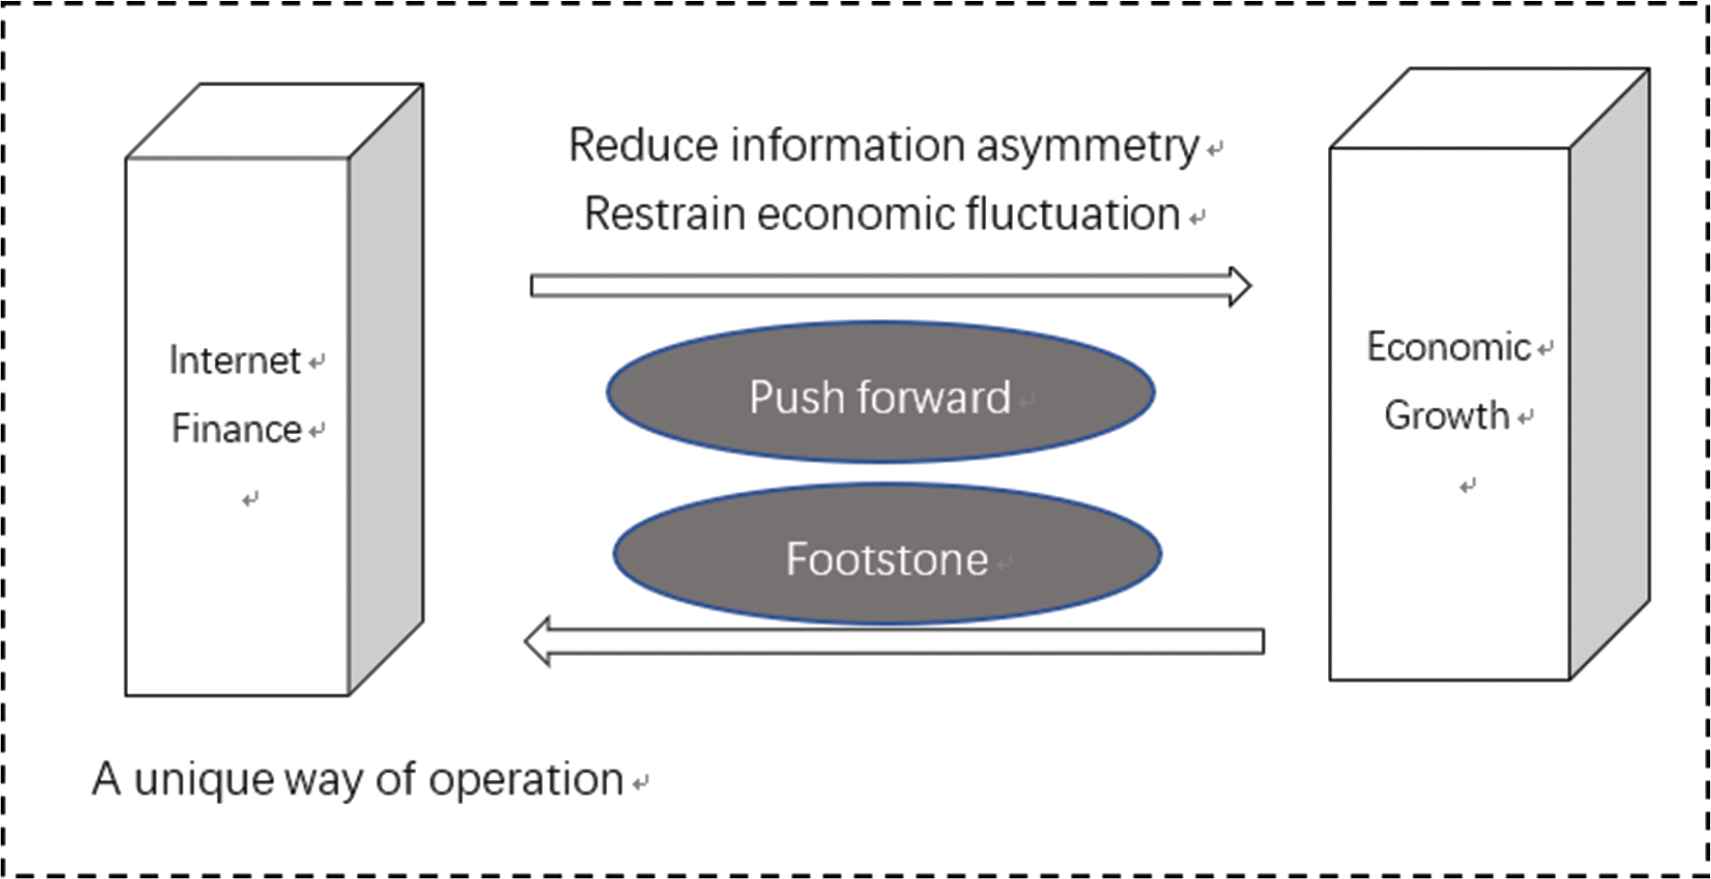
2.2. Negative Mechanism of Internet Finance and Real Economy: “Restriction”
There are mainly two methods to improve the efficiency of capital allocation in financial development so as to enable investment to flow to the projects with high profit and high productivity efficiency. One is collecting information, and the other one is risk diversification, However, if there's a blackout on these two ways to improve the efficiency of capital allocation in financial development, it will bring critical damage to the increase of the economy. According to the relative independence and unique way of operation of the internet finance, if internet finance is allowed to develop in a cyclical way and keep expanding, internet finance will be separated from real economy and form a financial hoarding to hinder the expansion of real economy's reproduction. There's great possibilities that the continuous development of financial hoarding will grow into the economic bubbles. And it likely leads to financial crisis when the bubbles burst. When capital goes into real economy, capital gains will be achieved via “production—trade—consumption,” with a longer payback period and the generation of sunk costs and opportunity costs. If the capital enters into internet finance with an operation mode of “making money with money,” the payback period would be relative short, and the costs are low. To obtain a higher return on capital in a relatively short duration, it is natural that investors would abandon real economy and switch to invest in internet finance to obtain higher returns. Benefit driven investment will lead the expansion speed of internet finance's scale to be faster than that of real economy, and without the foundation of real economy, internet finance will be like a kite with no strings attached. Production process during economic upstream period will proceed smoothly, the return of capital will be guaranteed, and the credit system will continue. But, once there's a surplus of goods in the market that causes holdup in sales, the prices would fall. And capital will circulate itself in internet financial system to pursue higher return ratio. When there are problems with reflux, normal status of reproduction will be broken, economy enters a downward phase, production capital goes idle, and economic recession would be aggravated. As a matter of fact, virtual economy has the effect of endogenous accelerator where procyclical fluctuations and overshoot are prone to occur. This will increase the frequency and amplitude of economic fluctuations. This kind of allergic fluctuations would lead to proportional disequilibrium of social reproduction and cause disequilibrium of real economic structure and serious waste of resources, furthermore, economic efficiency would be reduced and stable increase of real economy would be broken. Figure 2 shows above mechanism of negative interaction between internet finance and real economy.

The mechanism of negative interaction between the development of internet finance and real economy.
3. INDEX SELECTION AND ITS CHARACTERISTIC ANALYSIS
3.1. Index Selection
In this paper, the data sample are selected between January 1, 2013, and June 1, 2018. Indexes for the development of internet finance are characterized with “Baby” fund, internet financial credit and Shanghai Composite Index. For the “Baby” fund, we select the representative Baidu Baizhuan, JD Treasury, Li Cai Tong, Yu'E Bao and Zeng Zhi Bao, and the data is from Tian Tian Fund http://fund.eastmoney.com/ to calculate the 7-day annualized average return of “Baby” fund. For the internet financial credit, we select Yi Ren Loan, Ren Ren Loan, Dian Rong Wang, Wei Loan Wang, Lu Jin Fu, Tuan Loan Wang, Ni Wo Loan, Pai Pai Loan, Ai Qian Jin and You Li Wang from P2P platform, and the data is from Wang Loan Zhi Jia https://www.wdzj.com/ to calculate monthly average return. GDP annual growth rates of primary, secondary and tertiary industries are selected as the index of real economy development, and the virtual part of the financial industry in tertiary industry are eliminated. According to China Statistical Yearbook, the three industries'contribution rates to GDP during sampling duration were 4%, 44.55% and 51.45% respectively. According to this ratio, growth rates of primary, secondary and tertiary industries after weighted average of the three major industries are adopted as the index of real economy. In order to have a better evaluation on the relationship between internet finance and the increase of real economy, Index of fixed assets investment (FI) is selected as the control variable. The list of variables is shown in Table 1.
| Variable Name | Types of the Variables | Explanation of the Variables |
|---|---|---|
| STF | Continuous variable | The year-on-year growth rate of gross value of production of primary industry (quarterly data) |
| STS | Continuous variable | The year-on-year growth rate of gross value of production of secondary industry (data) |
| STT | Continuous variable | The year-on-year growth rate of gross value of production of tertiary industry (data) Eliminate the component of its virtual economy |
| FI | Continuous variable | Cumulative growth rate of fixed asset investment (monthly data) |
| SI | Continuous variable | Return of Shanghai Composite Index (daily frequency data) |
| FE | Continuous variable | Seven-day annualized rate of return of “Baby” fund (daily frequency data) |
| P2P | Continuous variable | Monthly average return of P2P platform (monthly data) |
Descriptive statistical analysis of model variables.
3.2. Characteristic of Statistical Index Features Analysis of Characteristics of Statistical Indicators
As shown in Table 2, variances of primary industry (STF), secondary industry (STS) and tertiary industry (STT) are 0.004, 0.007 and 0.003 respectively. The fluctuation range is relatively small, which shows the development of three major industries is stable, their average are 3.432%, 6.782% and 6.670% separately. It can be concluded that the growth rate of the development of primary industry's gross value is relatively slow, and the growth rates of secondary and tertiary industries are almost of its double value.
| Variable Name | Mean (%) | Standard Deviation | Max (%) | Min (%) | Median (%) |
|---|---|---|---|---|---|
| STF | 3.432 | 0.004 | 4.100 | 2.800 | 3.400 |
| STS | 6.782 | 0.007 | 8.000 | 6.000 | 6.350 |
| STT | 6.670 | 0.003 | 7.165 | 6.398 | 6.611 |
| FI | 12.125 | 4.590 | 21.520 | 6.000 | 10.250 |
| SI | 0.021 | 0.012 | 5.760 | −8.490 | 0.030 |
| FE | 3.903 | 0.008 | 6.730 | 2.360 | 4.020 |
| P2P | 12.586 | 1.971 | 16.516 | 9.728 | 11.932 |
Variables selection and brief explanation.
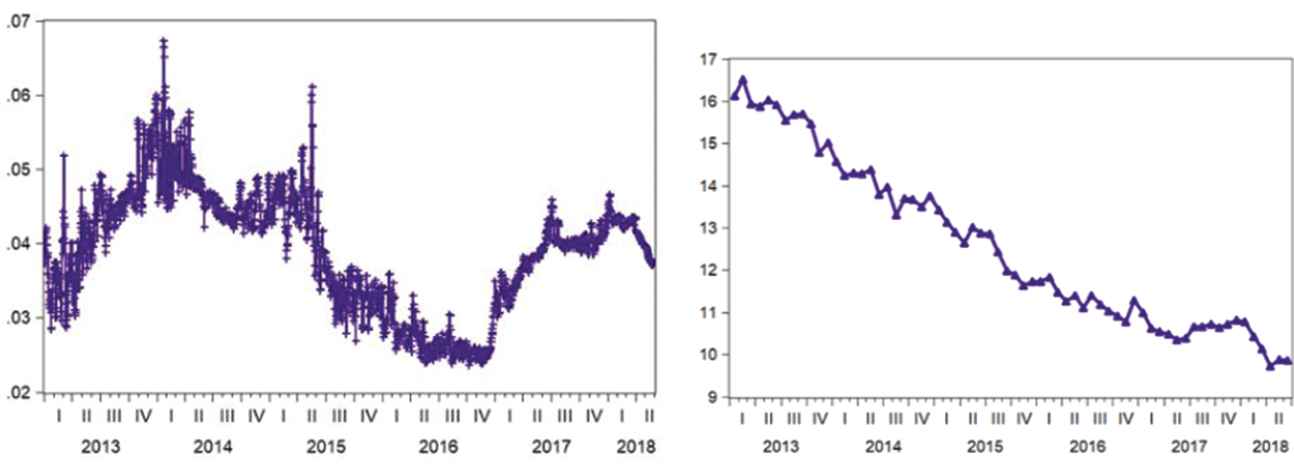
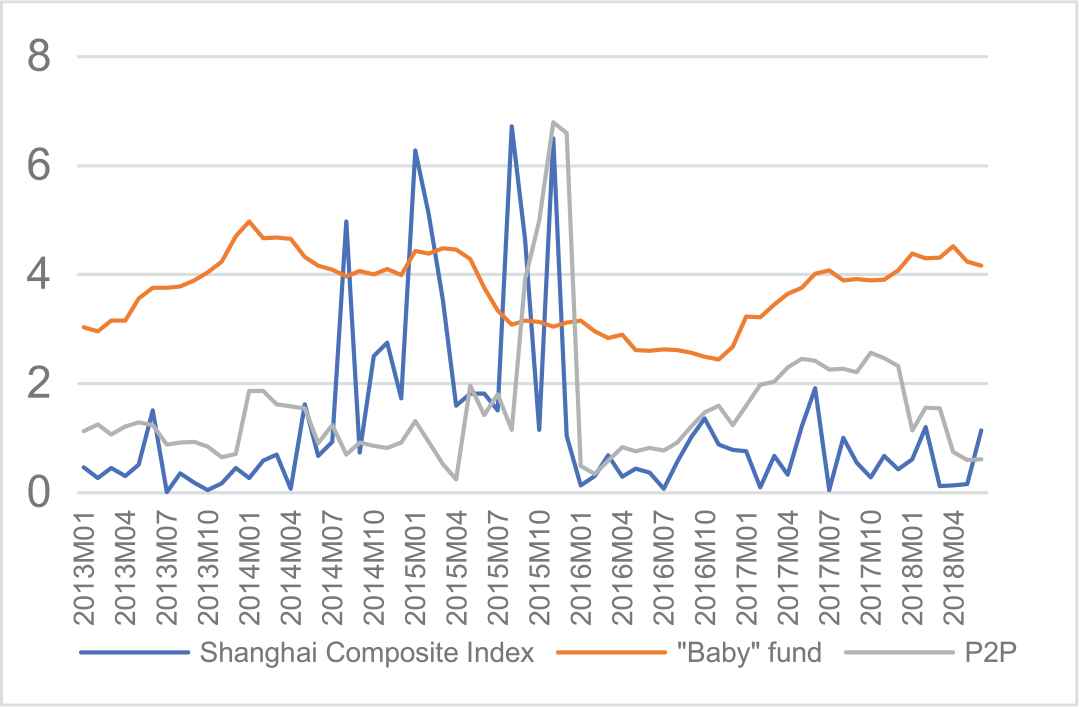
The average return of internet financial credit is higher than “Baby” fund on internet finance platform. The average return of this kind of “Baby” fund is higher than the Shanghai Composite Index (SCI). The overall trend of higher P2P return on internet financial credit platform is dropping as shown in Figure 3. But the report from the top network loan reflects that from 2013 to 2017, revenue of online P2P loans across the country had increased year after year. By the end of 2017, total amount of online P2P loans nationwide was CNY8.3 trillion. This means that although the return of internet financial credit was dropping, its capital return remained higher than that of real economy which lead the investment not reduce. Although there were some fluctuations on the return of internet financial credit “Baby” fund, overcall situation is basically stable as shown in Figure 3. According to the data from Wind, there were 21 new internet “Baby” funds in 2018, and by the end of 2017, total number of “Baby” fund was 93 and its total scale had reached CNY1.6 trillion, which was about 170% of increase comparing with the beginning of the year. Although the overall increase of “Baby” fund is rapid, it is an undisputed fact that its return is dropping. Less than 30% of over 90 “Baby” funds has average returns over 5%.
4. EMPIRICAL TEST OF THE DISEQUILIBRIUM RELATION BETWEEN INTERNET FINANCE AND REAL ECONOMY
In this section, we estimate the dynamic relationship of monthly model variables by using straightening technology of mixing data and Eviews11.
4.1. Unit Root and Co-integration Test
From Table 3, tertiary industry (STT), secondary industry (STS), internet finance “Baby” fund (FE), internet financial credit (P2P) and FI are all post first-order differential stationary. There may be co-integration relationships among different variables. We then obtain Table 4 by co-integration analysis on first-order monolithic variables.
| Sequence | ADF Value | P Value | (c, t, p) | Conclusion |
|---|---|---|---|---|
| SI | −32.106 | 0.000 | (c,0,1) | Stationary |
| STT | −2.3112 | 0.172 | (c,0,1) | Non-stationary |
| DSTT | −7.927 | 0.000 | (c,0,1) | Stationary |
| STS | −1.175 | 0.681 | (c,0,1) | Non-stationary |
| DSTS | −8.117 | 0.000 | (c,0,1) | Stationary |
| STF | −3.04 | 0.036 | (c,0,1) | Stationary |
| FE | −3.914 | 0.002 | (c,0,1) | Stationary |
| FI | −1.302 | 0.624 | (c,0,1) | Non-stationary |
| DFI | −7.670 | 0.000 | (c,0,1) | Stationary |
| P2P | −1.660 | 0.436 | (c,0,1) | Non-stationary |
| DP2P | −3.843 | 0.009 | (c,0,1) | Stationary |
Results of ADF unit root test.
| Number of Co-integration Relation | Eigenvalue | Trace Statistics | Critical Value | P Value | Maximum Eigenvalue | Critical Value | P Value |
|---|---|---|---|---|---|---|---|
| 0 | 0.505 | 124.691 | 69.819 | 0.000 | 43.578 | 33.877 | 0.002 |
| 1 at most | 0.468 | 81.115 | 47.856 | 0.000 | 39.176 | 27.584 | 0.001* |
| 2 at most | 0.278 | 41.939 | 29.797 | 0.001 | 20.199 | 21.132 | 0.067 |
| 3 at most | 0.189 | 21.739 | 15.495 | 0.005 | 12.959 | 14.265 | 0.079 |
| 4 at most | 0.132 | 8.781 | 3.841 | 0.003 | 8.781 | 3.841 | 0.003 |
Note: * means the significance level 5%
Test results of trace and maximum eigenvalue of co-integration relation.
From Table 4, there is one co-integration relation at most between tertiary industry (STT), secondary industry (STS) and internet finance “Baby” fund (FE), internet financial credit (P2P), FI. That is, there is a long-term equilibrium relationship between internet finance “Baby” fund, internet financial credit, FI and tertiary industry, second industry. Increasing internet finance “Baby” fund, internet financial credit and FI will promote economic growth in secondary and tertiary industries.
4.2. Granger Causality Test
As shown in Table 5, single causality only exists between secondary industry (STS) and primary industry (STF), but it is not obvious. And there's no causality relationship among internet finance “Baby” fund (FE), internet financial credit (DP2P), Shanghai Composite Index (SI) and tertiary industry (STT), secondary industry (STS), primary industry (STF). Neither is the Granger reason for another. The above results show that there's no causality among tertiary industry (STT), secondary industry (STS), primary industry (STF) and internet finance. That is to say, either trend of internet finance cannot be used to explain the reason for promoting or restricting economic growth, and economic growth cannot drive the increase of internet finance's return. So we can conclude that there's a deviation between the development of internet finance and real economy.
| Hypothesis (A Is Not the Granger Cause of B) | F-statistic | P Value | Whether to Accept | Hypothesis (A Is Not the Granger Cause of B) | F-statistic | P Value | Whether to Accept |
|---|---|---|---|---|---|---|---|
| SI is not STF | 0.489 | 0.616 | Accept | STF is not STT | 1.342 | 0.269 | Accept |
| STF is not SI | 4.623 | 0.014 | Reject | STT is not STF | 0.425 | 0.655 | Accept |
| SI is not FE | 0.781 | 0.463 | Accept | FE is not STT | 1.901 | 0.158 | Accept |
| FE is not SI | 0.122 | 0.885 | Accept | STT is not FE | 1.028 | 0.363 | Accept |
| STF is not FE | 0.187 | 0.829 | Accept | DFI is not STT | 0.053 | 0.948 | Accept |
| FE is not STF | 1.746 | 0.183 | Accept | STT is not DFI | 0.063 | 0.938 | Accept |
| SI is not DFI | 1.617 | 0.207 | Accept | P2P is not STT | 0.724 | 0.489 | Accept |
| DFI is not SI | 0.218 | 0.804 | Accept | STT is not P2P | 1.778 | 0.177 | Accept |
| STF is not DFI | 2.401 | 0.099 | Accept | SI is not STS | 1.939 | 0.153 | Accept |
| DFI is not STF | 0.560 | 0.574 | Accept | STS is not SI | 0.864 | 0.426 | Accept |
| FE is not DFI | 1.024 | 0.365 | Accept | STF is not STS | 4.252 | 0.018 | Reject |
| DFI is not FE | 1.225 | 0.301 | Accept | STS is not STF | 0.152 | 0.858 | Accept |
| SI is not P2P | 1.097 | 0.340 | Accept | FE is not STS | 0.011 | 0.988 | Accept |
| P2P is not SI | 0.404 | 0.669 | Accept | STS is not FE | 0.240 | 0.786 | Accept |
| STF is not P2P | 0.090 | 0.913 | Accept | FI is not STS | 0.593 | 0.555 | Accept |
| P2P is not STF | 2.221 | 0.117 | Accept | STS is not FI | 1.971 | 0.148 | Accept |
| FE is not P2P | 0.031 | 0.968 | Accept | P2P is not STS | 1.900 | 0.158 | Accept |
| P2P is not FE | 0.544 | 0.583 | Accept | STS is not P2P | 0.187 | 0.829 | Accept |
| DFI is not P2P | 1.318 | 0.275 | Accept | STT is not STS | 0.007 | 0.992 | Accept |
| P2P is not DFI | 1.575 | 0.215 | Accept | STS is not STT | 0.011 | 0.988 | Accept |
| SI is not STT | 0.691 | 0.504 | Accept | ||||
| STT is not SI | 0.664 | 0.518 | Accept | ||||
Results of granger causality test.
The estimation results of model parameter are as follows:
Line chart of “Baby” fund and P2P.
The stability test of estimation results of the VAR model was carried out by using the AR root estimation method. We obtain 14 roots of VAR(2) above are obtained, which passed the stationarity test, as shown in Figure 4.
Stability test of VAR(2) model.
4.3. Impulse Response Function Analysis
Figure 5 shows the impact of an additional standard deviation on internet finance (P2P, “Baby” fund, Shanghai Stock Index) brought to the development of real economy (primary industry, secondary industry, tertiary industry). So, when P2P is strengthened, increase of primary, secondary and tertiary industries will be influenced. All the three major industries firstly decreased and reached their lowest points in the second phase. The difference is P2P's impact on primary industry kept to be negative which had inhibited the overall economic development of primary industry. While P2P's impact on secondary and tertiary industries after phase 2 gradually went up to positive influence and reached their max value at phase 3, and then it oscillated and fell back to nearly zero. From the extent of increase, it can be seen that P2P's impact on secondary industry is greater than on tertiary industry. “Baby” fund has the greatest impact on tertiary industry. When “Baby” fund was hit, it would bring negative impact on tertiary industry and reached its minimum value at phase 2, then it went back to positive impact, the value became close to zero. But, this kind of positive impact is minor. “Baby” fund's impact on primary industry kept to be negative and reached its minimum value in phase 4, and then the curve tended to be flat and close to zero. Impact on secondary industry from “Baby” fund is the least obvious. Compared with P2P and “Baby” fund's impact on the three major industries, Shanghai Stock Index's impact on the three major industry is not obvious, especially on primary industry. When given a standard deviation hit to Shanghai Stock Index, there's barely any fluctuation on its impulse response function. Shanghai Stock Index's overall impact on the growth rate of tertiary industry is positive, but its impacts on secondary industry are mostly negative. Shanghai Stock Index's impacts on secondary and tertiary industries are weaker than P2P and “Baby” fund.
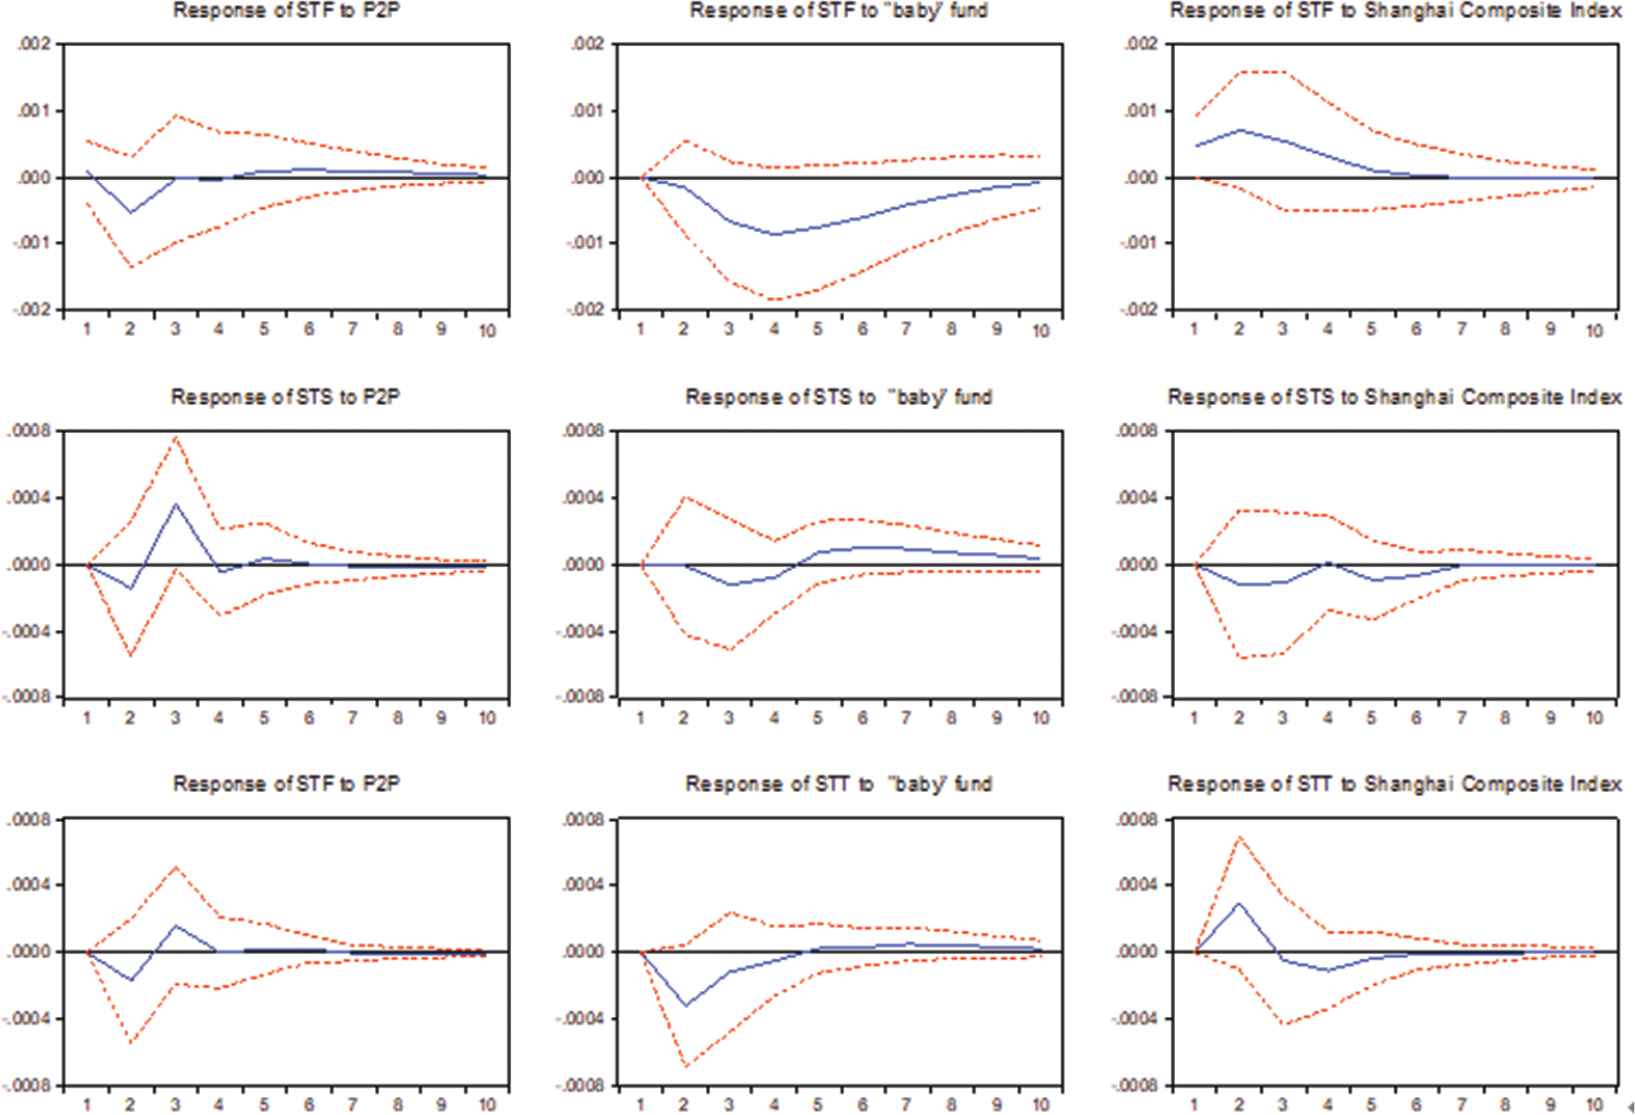
Impulse response of internet finance to real economy.
We took real economy as hit variable, internet finance as response variable to further describe the interaction between internet finance and real economy. Figure 6 shows real economy's impact on internet finance. When given a standard deviation to primary industry, P2P decreases first and reaches its minimum value at phase 2 and then oscillate to phase 3 where it reaches its maximum positive value and tends to zero along with the extension of phases that follow. Primary industry's hit impact on “Baby” fund and Shanghai Stock Index is backward. Impact from primary industry on “Baby” fund is overall negative while its impact on Shanghai Stock Index has a short period of rise and then slowly tends to zero after reaching the highest point. This overall impact is positive. However, primary industry's impact on internet finance is quite minor on the whole.
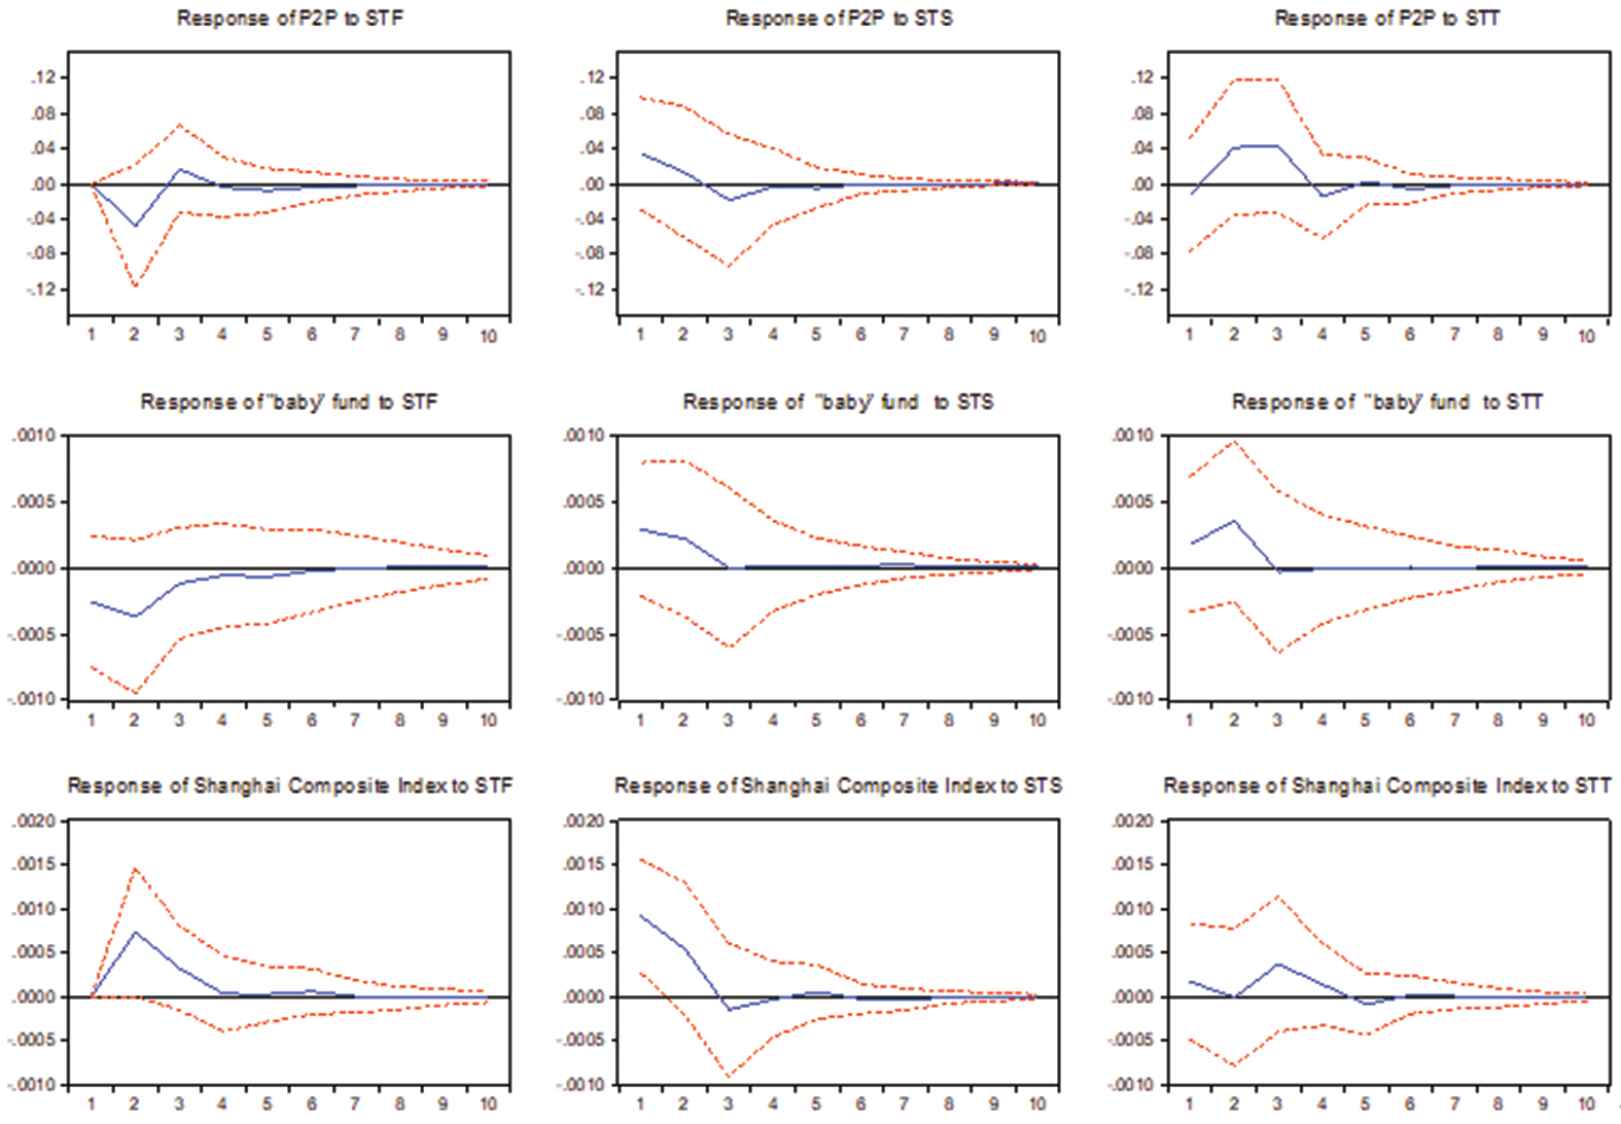
Impulse response of real economy to internet finance.
When internet finance confronts the hit from secondary industry, the impact is greater than that of primary industry. When given a standard deviation to secondary industry, “Baby” fund and Shanghai Stock Index tends to fall which reacted from P2P and Shanghai Stock Index declined the most, while “Baby” fund's fluctuation is the smallest. P2P reaches its lowest point in phase 3 and then oscillates to zero.
For tertiary industry's impact on P2P, when giving a standard deviation hit to tertiary industry, P2P has a rapid increase from phase 1 to phase 2, and follows with a near-constant trend of slow increase during phase 2 to phase 3, and then quickly falls to its lowest point, and oscillates close to zero thereafter. Tertiary industry's impact on “Baby” fund is quite similar to primary industry's impact on Shanghai Stock Index. The difference is “Baby” fund would have slight negative effect in phase 3 while primary industry has positive impact on Shanghai Stock Index on the whole. Tertiary industry's impact on Shanghai Stock Index makes it drop to zero immediately in phase 2, then slowly increase thereafter and reach its max value in phase 3.
By analyzing the impulse response function curve of internet finance and real economy, it can be found that internet finance's impacts on real economy mainly focus on secondary and tertiary industries. In particular, the impacts of P2P and “Baby” fund on secondary and tertiary industries are the greatest. Real economy's impact on internet finance mainly focuses on P2P. The three major industries impacts on “Baby” fund are comparatively weak, and are greater on Shanghai Stock Index.
5. EVALUATION ON DEVIATION DEGREE AND CHARACTERISTIC ANALYSIS
5.1. Deviation Measure Index
In this paper, we select financial interrelations ratio (FIR) to measure the deviation of internet finance and real economy:
We take Shanghai Stock Index's daily return, internet “Baby” fund seven-day annualized return, P2P internet loans platform's monthly return to evaluate the index of the society's total financial activities between January 2013 and June 2018. We also took the weight of GDP's growth rate of primary, secondary and tertiary industries to evaluate national wealth value.
In accordance with international standard, financial interrelation ratio of developed countries should be between 2 to 3 when using FIR to measure the depth of financial development. And compared with developed countries, the imperfect financial system in developing countries results in the value of financial interrelation ration generally between 2/3 and 1.5 due to its low financial development level.
5.2. Characteristic Analysis for the Deviation Degree
From Table 6, monthly values of financial interrelation ratio between “Baby” fund, P2P, Shanghai Stock Index and real economy are 3.694, 1.554, 1.244. This means that the deviation between internet finance and real economy in China is mainly reflected in the deviation between “Baby” fund, P2P and real economy. Deviation level between Shanghai Stock Index and real economy remains within a controllable range of (2/3, 1.5). To further test whether our FIR has exceeded the range of (2/3, 1.5), the following t test was conducted on the FIR between internet finance “Baby” fund and real economy and the FIR between internet financial credit and real economy.
| Date | FIR of Stock Index | FIR of “Baby” Fund | FIR of P2P | Date | FIR of Stock Index | FIR of “Baby” Fund | FIR of P2P | Date | FIR of Stock Index | FIR of “Baby” Fund | FIR of P2P |
|---|---|---|---|---|---|---|---|---|---|---|---|
| 2013M01 | 0.457 | 3.030 | 1.130 | 2014M11 | 2.751 | 4.105 | 0.819 | 2016M09 | 1.012 | 2.564 | 1.207 |
| 2013M02 | 0.265 | 2.954 | 1.253 | 2014M12 | 1.732 | 3.992 | 0.918 | 2016M10 | 1.357 | 2.490 | 1.465 |
| 2013M03 | 0.456 | 3.152 | 1.069 | 2015M01 | 6.278 | 4.435 | 1.313 | 2016M11 | 0.875 | 2.445 | 1.597 |
| 2013M04 | 0.297 | 3.156 | 1.218 | 2015M02 | 5.109 | 4.381 | 0.925 | 2016M12 | 0.784 | 2.678 | 1.237 |
| 2013M05 | 0.509 | 3.558 | 1.281 | 2015M03 | 3.552 | 4.486 | 0.518 | 2017M01 | 0.762 | 3.224 | 1.596 |
| 2013M06 | 1.510 | 3.755 | 1.234 | 2015M04 | 1.599 | 4.457 | 0.240 | 2017M02 | 0.093 | 3.211 | 1.969 |
| 2013M07 | 0.008 | 3.758 | 0.880 | 2015M05 | 1.814 | 4.286 | 1.957 | 2017M03 | 0.675 | 3.451 | 2.036 |
| 2013M08 | 0.346 | 3.780 | 0.918 | 2015M06 | 1.814 | 3.761 | 1.424 | 2017M04 | 0.326 | 3.647 | 2.294 |
| 2013M09 | 0.176 | 3.887 | 0.926 | 2015M07 | 1.512 | 3.334 | 1.808 | 2017M05 | 1.218 | 3.751 | 2.453 |
| 2013M10 | 0.042 | 4.039 | 0.844 | 2015M08 | 6.715 | 3.081 | 1.152 | 2017M06 | 1.916 | 4.019 | 2.415 |
| 2013M11 | 0.162 | 4.242 | 0.644 | 2015M09 | 4.633 | 3.155 | 3.921 | 2017M07 | 0.045 | 4.079 | 2.258 |
| 2013M12 | 0.444 | 4.702 | 0.712 | 2015M10 | 1.156 | 3.126 | 4.986 | 2017M08 | 1.005 | 3.887 | 2.268 |
| 2014M01 | 0.260 | 4.976 | 1.867 | 2015M11 | 6.499 | 3.049 | 6.799 | 2017M09 | 0.553 | 3.911 | 2.202 |
| 2014M02 | 0.587 | 4.661 | 1.862 | 2015M12 | 1.042 | 3.115 | 6.597 | 2017M10 | 0.276 | 3.893 | 2.564 |
| 2014M03 | 0.700 | 4.683 | 1.621 | 2016M01 | 0.126 | 3.155 | 0.490 | 2017M11 | 0.670 | 3.907 | 2.466 |
| 2014M04 | 0.064 | 4.651 | 1.577 | 2016M02 | 0.303 | 2.952 | 0.341 | 2017M12 | 0.430 | 4.078 | 2.323 |
| 2014M05 | 1.612 | 4.321 | 1.540 | 2016M03 | 0.686 | 2.836 | 0.590 | 2018M01 | 0.606 | 4.381 | 1.143 |
| 2014M06 | 0.669 | 4.158 | 0.910 | 2016M04 | 0.295 | 2.894 | 0.833 | 2018M02 | 1.203 | 4.294 | 1.556 |
| 2014M07 | 0.930 | 4.087 | 1.238 | 2016M05 | 0.433 | 2.616 | 0.755 | 2018M03 | 0.115 | 4.312 | 1.541 |
| 2014M08 | 4.980 | 3.962 | 0.692 | 2016M06 | 0.359 | 2.606 | 0.814 | 2018M04 | 0.128 | 4.525 | 0.740 |
| 2014M09 | 0.731 | 4.063 | 0.922 | 2016M07 | 0.066 | 2.622 | 0.770 | 2018M05 | 0.149 | 4.241 | 0.603 |
| 2014M10 | 2.502 | 4.002 | 0.857 | 2016M08 | 0.558 | 2.611 | 0.915 | 2018M06 | 1.139 | 4.167 | 0.608 |
FIR of internet finance and real economy.
5.3. Dynamic Characteristic Analysis on Deviation Degree
The results shown in Figure 7 shows that the minimum value of the FIR deviation degree between internet finance “Baby” fund and real economy is 2.445, and the max value is 4.976, which are about three times of the international standard. Deviation degree between internet finance “Baby” fund and real economy kept increasing from January 2013 to January 2014, and turned to decrease from January 2014 to August 2014; and from August 2014 to December 2014, it gradually increased again; and thereafter, the deviation degree between internet finance “Baby” fund and real economy kept decreasing from January 2015 to November 2016 thereafter, and reached its minimum value of 2.445 in November 2016. From December 2016 to June 2018, the deviation went back up again, and the overall deviation degree showed the trend of next “peak.” When Yu'E Bao was launched in 2013, its feature of flexible access, high return and low risk have been deeply loved by the working class, which set off a wave of investment in “Baby” funds. Regardless the investment scale or type and quantity, “Baby” fund had its blowout development. In 2014, total number of “Baby” fund reached more than 80. But due to the intensified competition, and its return kept falling and the “Matthew Effect,” scale of “Baby” fund started to decrease slightly. Thus, it can be seen that when the total amount of financial activities shows a trend of decrease, recent FIR tends to increase. This means the gross of national market is shrinking, and its rate of shrinkage is faster than that of total amount of financial activities.
Line chart of monthly financial correlation ratio.
Internet financial credit is more volatile than internet finance “Baby” fund. And its max value reached 6.799 which is 4.5 times more than international standard, while its minimum value was only 0.24 which is far lower than 2/3. Before April 2015, deviation degree between internet financial credit and real economy remained within 2. Although deviation degree had increased from December 2014 to January 2015, the overall deviation degree tended to fall before April 2015. Deviation degree between the two gradually increased from April 2015 to November 2015. The highest point was nearly 7 in November which was over 3 times more deviated from international standard. We conclude that before 2015, investors had been holding a wait-and-see attitude toward P2P since relevant policies had not be perfected yet. In the second half of 2014, local governments had issued policies on internet finance one after another. Under the premise of policy guarantee, investors started their investments in succession. Therefore, the deviation degree between real economy and internet finance from had increased sharply July 2015 to November 2015. After two months, the deviation degree between internet financial credit and real economy suddenly dropped to its minimum value. Up to October 2017, the deviation degree between the two kept increasing slowly, and there was another trend of dropping from November 2017 to June 2018.
Figure 8 shows the monthly average turnover of ten P2P trade platforms. It can be seen from Figure 8 that monthly trade turnover on P2P platform kept increasing between January 2013 and November 2016. The increase before 2015 was slow, and then from January 2015 to November 2016, it increased with the soared ascend speed and reached the highest point. The deviation degree between internet financial credit and real economy kept increasing. Such a high-speed increase of internet financial credit showed that the development of real economy from 2015 to November 2016 was slow where there was greater deviation with the development of internet finance. Currently, since the capital return of P2P online loan platforms is obviously higher than other industries or platforms, the result is that the supply of funds exceeds the demand, and comprehensive return gradually decreases. In order to prevent the inversion phenomenon of interest rate, the government has issued a series of policies to control this situation. But, what all the initiator of internet loan platforms can see is high profit return and ignore risk control which resulted in different quality of P2P platform. Development scale of P2P platform has also appeared to be polarized where investors tend to go to mainstream platform gradually. The monthly turnover of P2P platform kept increasing slowly from 2017 to January 2018, and the deviation degree between internet financial credit and real economy had slighted increased as well. And then, monthly turnover of P2P platform has shown slight shrinkage, and the deviation degree between the two also showed a trend of decrease.
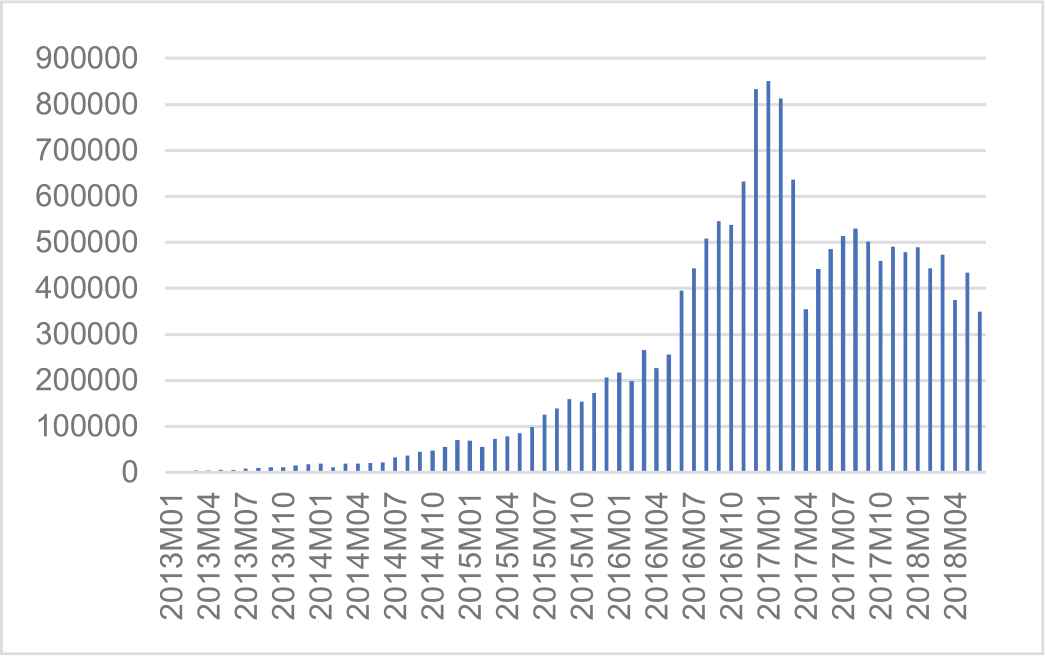
Average monthly turnover of 10 P2P platforms.
There's an obvious “breaking point” on deviation degree between Shanghai Composite Index and real economy. The deviation degree between the two was strictly controlled within 2 before July 2014. But from July 2014 to January 2016, vibration and fluctuation appeared on their deviation degree, and their FIR had surpassed 2 greatly. From January 2016 to June 2018, this deviation degree was recontrolled within 2. Therefore, deviation degree between Shanghai Composite Index and real economy was not as serious as imagined. Coordination on the development of real economy and internet finance in the future should mainly focus on the harmonized development of P2P, “Baby” fund and real economy.
In summary, we have the conclusion that overall development of China's real economy since 2017 has not be quite positive, and economic growth is confronting the predicament of over-entry of funds into internet finance, from the analysis via either the line chart of deviation degree between internet finance “Baby” fund, internet financial credit and real economy, or the histogram of 10 P2P platforms' monthly average turnover. Due to the high return of internet financial system, capital circulates and operates in this system instead of flowing back to real economy for reproduction have severely constricted the sustainable development of real economy. How to effectively guide the funds to “get rid of deficiencies and get real,” break the solidification of financial hoarding, so as to push the funds flow to real economy to bring an orderly manner to the “production–trade–consumption” of real economy, are the topics that need long-term consideration.
6. CONCLUSION
In this paper, we select the virtual economic elements of the financial market's core elements, which are Shanghai Composite Index, internet “Baby” fund and internet financial credit, to evaluate the development level of internet finance for the first time. We adopt VAR model to examine the disequilibrium relationship between internet finance and real economy based on the sample data between January of 2013 and June of 2018. We also use FIR to measure the disequilibrium level between the two, and the dynamic and static features of their deviation degree. We have the conclusion that there's no causality between China's internet finance and real economy development, instead, there is a significant disequilibrium between the two. Meanwhile, FIR is obviously larger than international standards, which means the deviation degree between our internet finance and real economy is quite high. On the vertical level, it is mainly reflected the insufficient motive force of real economy's development in recent years, and horizontally, it is mainly attributed to internet financial credit.
CONFLICTS OF INTEREST
The authors declare no conflicts of interest.
AUTHORS’ CONTRIBUTION
Motivation, Yixiao Li; methodology, Xin Jin; code, Yixiao Li and Xin Jin; validation, Xin Jin, Wenwen Tian, and Yixiao Li; formal analysis, Yixiao Li and Xin Jin; data, Xin Jin; resources, Xin Jin, Wenwen Tian, and Yixiao Li; data curation, Xin Jin; writing—original draft preparation, Xin Jin; writing—review and editing, Xin Jin, Wenwen Tian, and Yixiao Li; visualization, Xin Jin; supervision, Wenwen Tian; project administration, Wenwen Tian and Yixiao Li; funding acquisition, Wenwen Tian and Yixiao Li.
ACKNOWLEDGMENTS
The author highly appreciate that this work was supported in part by the Social Science Planning Foundation of Shandong Province [Grant No. 16CTJJ01] and the National Statistical Science Foundation of Key Projects of China [Grant No. 2018LZ10]. Yixiao Li is the corresponding author.
REFERENCES
Cite this article
TY  - JOUR
AU  - Yixiao Li
AU  - Xin Jin
AU  - Wenwen Tian
PY  - 2019
DA  - 2019/12/03
TI  - Econometric Analysis of Disequilibrium Relations Between Internet Finance and Real Economy in China
JO  - International Journal of Computational Intelligence Systems
SP  - 1454
EP  - 1464
VL  - 12
IS  - 2
SN  - 1875-6883
UR  - https://doi.org/10.2991/ijcis.d.191128.001
DO  - 10.2991/ijcis.d.191128.001
ID  - Li2019
ER  -