
Urban Real Estate Market Early Warning Based on Support Vector Machine: A Case Study of Beijing
- DOI
- 10.2991/ijcis.d.200129.001How to use a DOI?
- Keywords
- Real estate market; Early warning system; Support vector machine; Real estate prices
- Abstract
Based on a multi-class support vector machine, an urban real estate early warning model is constructed for the Beijing real estate market. The initial indicator system is established based on the historical development of Beijing's real estate market and the selection of real estate early warning indicators. Early warning index data for Beijing from 2000 to 2018 are selected, and the leading index is selected by a time difference correlation analysis as the warning index to be used for further implementation. The model is found to have a good early warning judgment performance, and demonstrates generalization ability. The model analyzes the real estate market from the aspects of land supply, credit scale, housing supply structure, restriction of speculation, and strengthening of transparency of real estate information. It predicts that the real estate market in Beijing will run smoothly in 2019. Based on the model's findings, the paper proposes policy recommendations to promote the healthy operation of China's real estate market.
- Copyright
- © 2020 The Authors. Published by Atlantis Press SARL.
- Open Access
- This is an open access article distributed under the CC BY-NC 4.0 license (http://creativecommons.org/licenses/by-nc/4.0/).
1. INTRODUCTION
The development and prosperity of the real estate market has obvious positive effects on the national economy, but the excessive development of any market will inevitably bring negative effects [1]. First, the real estate industry is different from the production economy. The industry involves large amounts of funds, and once over-developed, the price signals will cause unreasonable allocation of social resources [2]. Under the conditions of an excessive real estate boom, the real estate market will attract large amounts of surplus funds, bank loans and even corporate funds. At the same time, investment in production and the real economy has been shrinking in recent years, leading to the phenomenon of “industry emptiness” (whereby excessive foreign direct investment and industrial transfer cause domestic investment to shrink continuously, employment opportunities decrease substantially, and the problem of unemployment becomes serious) [3]. In the late 1980s, the “siphon” phenomenon (whereby central cities that have grown into large cities attract talent, investment, population, information, and other high-quality resources from disadvantaged areas) of real estate on the real economy occurred in Japan, which led to the stagnation of the country's manufacturing industry [4]. Second, the real estate market is closely related to the macro-economy. Its excessive development is prone to causing overheating of the economy, which leads to excessive fluctuations of the macro-economy [5]. Because the real estate industry has a high degree of relevance to related industries, the excessive development of the real estate market will lead to the rapid development of such industries, leading to a shortage of supply in other industries [6]. In response to such conditions, the government will inevitably introduce strict macro-control measures to curb the development of related industries by means of credit control and land control policies, which in turn may lead to a rapid cooling of the real estate market and a recession in the economy [7]. Finally, the excessive development of the real estate market is likely to form an economic bubble. When this bubble bursts, loans from financial institutions to real estate enterprises will become bad, which will affect the quality of bank assets and so cause the public to lose confidence in the banks. If a wave of depositor bank runs occurs, this will cause a financial disaster.
If the real estate industry is in a state of excessive underdevelopment, not only will the public lose confidence in the real estate industry, thus affecting its own development, but the development of the macro-economy will also be affected [8], and its front-end and back-end industries will be seriously affected. As such, the role of a real estate early warning system should be not only to identify in real time whether the real estate market is about to overheat, but also to send an early warning signal when the real estate market is at risk of cooling excessively [9].
The real estate market has the characteristics of information asymmetry, fixedness and transaction dispersion, and the general industry structure and relationship between supply and demand cannot be effectively balanced by market forces. Therefore, it is difficult to scientifically judge the operational trend of the real estate market only by analyzing the relationship between supply and demand and housing prices. The establishment of a scientific and pragmatic real estate early warning model is thus necessary for the purpose of judging the changing trend of the real estate market. Such a system can comprehensively and objectively analyze the operation of the real estate market and provide an early warning of abnormal fluctuation trends in the real estate industry, enabling the government to adopt appropriate macro-control measures in time to correctly guide irrational investment and consumption in the real estate market and promote the market's health and stability [10].
The study of early warning indicators began with research on early warnings in the macroeconomic field [11]. With the development of the field of study, the concepts and methods of early warning systems have been gradually promoted and applied in the fields of aviation research, seismic research, traffic accident research, and real estate research [12–14].
In the early years of study, Pyhrr et al. discovered the periodic phenomenon observed in western real estate markets since the 1960s, and devoted themselves to its study, focusing on the changing law and periodic mechanism under the capitalist system [15,16]. With further study of the real estate cycle, scholars have gradually realized the importance of early warnings of risks. In the early 1990s, Nieboer et al. studied the housing vacancy rate in the Netherlands and found that it had a significant relationship with trends in the real estate market [17]. Therefore, based on the housing vacancy rate, a real estate market early warning system was established for the first time. Subsequently, the U.S. government identified a signal of real estate market depression in the community of Chicago, realized the importance of monitoring and early warning, and established an early warning system based on seven leading indicators that monitored abnormal changes in the community real estate market, realizing the primitive application of real estate early warning [18].
The purpose of real estate early warning research is mainly to establish early warning index systems and early warning models. In research of early warning indicator systems for the real estate market, Ecase et al. used the Case-Shiller (CS) house price index and early warning leading indicators to measure trends in the real estate market, and explored the relationship between housing prices and macroeconomic phenomena [19]. If the basic supply and demand conditions are identified, an economic downturn will not cause the real estate market to drop rapidly. Witold et al. used Hodrick–Prescott (HP) filters to screen real estate market early warning indicators, relying on these HP filters to identify cycle turning points according to the business cycle to determine real estate cycle indicators, and identifying potential risks in the market by studying degrees of deviation in cycle indicators [20]. Yim et al. used fuzzy evaluation, decision trees, and artificial neural networks to predict the behavior of the real estate market [21]. By comparing the accuracy of different early warning indicators, the machine learning model is superior to traditional statistical models in solving non-linear problems [22]. Hott et al. proposed a housing income ratio, and monitored the real estate market bubble by measuring changes in this indicator in order to provide warning alerts [23,24]. The above scholars use a variety of methods to establish real estate market early warning index systems, including qualitative analysis and quantitative methods, so that early warning index systems have gradually reached a mature stage of development.
Suh et al. used a signal analysis method to screen 15 leading early warning indicators, and determined the risk profile of the Korean real estate market using a Probit model [25]. The accuracy of Suh et al.'s method for predicting risks can reach 80%. Qin et al. used principal component analysis to construct a relatively complete bubble early warning mechanism, then conducted an empirical early warning study on the Ningbo real estate market and, based on this, evaluated the development of the region's real estate market [26]. The above two studies measure the accuracy of their early warning prediction results by means of empirical analysis and confirm the feasibility of their real estate early warning system models.
In summary, the current research on early warning indicators for real estate markets is relatively mature. The selection of indicators should take into account the supply and demand characteristics of the real estate market, internal coordination, external economic factors, and so on, and should use the economic characteristics of the relevant region to screen many possible indicators and eliminate those which are redundant. The early warning methods have developed from initial index-based methods to more advanced statistical approaches, and then to more comprehensive early warning models. The development process reflects the progression in the literature from qualitative research to the combination of qualitative and quantitative research methods. With the development of information technology, the theories and methods developed by researchers provide new ideas that are integrated into real estate market warning models [21,22,27]. However, current model prediction methods cannot avoid the problem of local extremum or the difficulties caused by an insufficient number of samples for small sample regions, for overall generalization ability and for non-linear problems in real estate early warning practice.
Therefore, following the principles of objectivity and effectiveness, the support vector machine model (SVM) is introduced by the present study into the real estate market early warning field for the purpose of fully considering the influence of multiple indicators on the development trend of the real estate market. This method can solve the problems of small samples, non-linear relationships, and so on, in real estate market early-warning. It also solves the problem of poor generalization ability in the current widely used real estate early warning model. SVM can project the data to high-dimensional space be means of a kernel function to realize linear separability, and can therefore solve the problems of local extreme values and insufficient numbers of samples that cannot be avoided by a general model prediction method. In this way, SVM is able to yield more objective and accurate judgments on the future status and trend of the real estate market. An early warning model based on SVM can better predict the development trend of real estate markets in later periods according to the early warning index data, and the study of an SVM-based model can also enrich the research on prediction methods more generally.
The remainder of this paper is arranged as follows. Section 2 discusses early warning indicators and SVM in further detail. Section 3 presents the results of an empirical analysis of data on the Beijing real estate market for the period from 2000 to 2017, and based on this analysis develops an early warning model for the region. Section 4 performs early warning forecasting for the Beijing real estate market for 2019. Section 5 presents the discussion of the study's results and provides policy implications, and Section 6 concludes the paper.
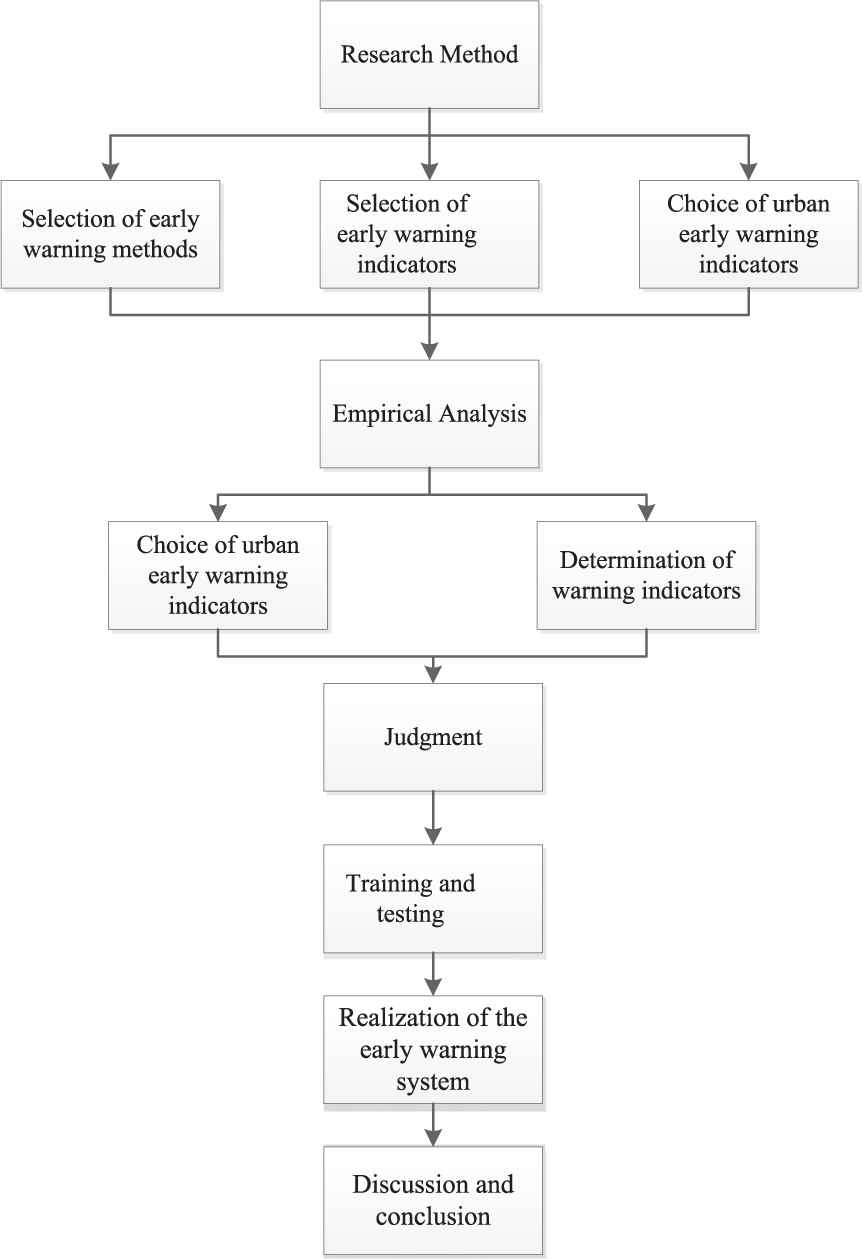
2. RESEARCH METHODS
2.1. Selection of Early Warning Methods
2.1.1. Comparison of early warning methods
At present, common early warning methods include index early warning methods, statistical early warning methods, and model-based early warning methods [28]. Model-based early warning methods entail constructing an early warning model by using certain mathematical methods, including newly developed computer technology. In the context of real estate early warnings, this such methods can predict and warn of the operational status of and trends in the real estate market. When selecting an early warning model, an important consideration will be the correlation between the model's warning indicator and the situations in which an alarm should be issued. There are two underlying mathematical methods that can be used. One is a method with a clear functional relationship; however, this method is often not well handled. The other mathematical method [29], which supposes a non-linear relationship, is the black box model developed in recent years, which exhibits better performance for non-linear data samples than functional relationship methods [30].
Due to the better predictive function of black box early warning models, this type of early warning model is adopted for the present study's real estate early warning system. For the real estate market early warning system, traditional linear models cannot adequately respond to the irregularity of the real estate market or solve the treatment of non-linear relationships. Such models are not fault-tolerant to incorrect data, and the black box model is more suited to the characteristics of the real estate market [31].
SVM is a typical black box model. It is also based on machine learning theory, which has developed gradually in recent years. The formation of SVM was based in statistical learning theory and SVM is a pattern classification method [32–34]. Because SVM has a very prominent theoretical advantage over other techniques, Bell Labs took the lead in applying the SVM method to the research field of digit recognition of handwriting for the U.S. Postal Service, and has achieved outstanding results [35]. Since then, many scholars in different fields of research have begun to pay attention to the application of SVM. In recent years, SVM has led to important research results in the fields of facial recognition, speech recognition, image recognition, and so on, [36–38]. Due to the introduction of the theories of structural risk minimization and kernel functions, SVM has advantages over other traditional machine learning methods in solving problems such as small sample sizes, generalization ability, and non-linearity, which make it well-suited to the problems faced by real estate market early warning models [29,30,39]. Therefore, the SVM model is selected for use as an early warning method in this study.
2.1.2. SVM theory
SVM is developed on the basis of statistical learning theory and is dedicated to solving small sample machine learning problems [40]. It was proposed by Vapnik and Chervonenkis in 1964 [41] and has been widely used since Cortes and Vapnik proposed the non-linear soft margin SVM in 1995 [42]. SVM constructs an objective function based on the principle of structural risk minimization, and distinguishes different types of samples as far as possible in order to maximize the distance between types of classification interfaces [43], as shown in Figure 1.

Distinguishing two classifications by SMV.
The early warning flow chart.
The expressions of the three lines in Figure 2 are
In this classification problem, the feasible region is obviously a convex set, so the classification problem can not only be transformed into a quadratic programming problem with independent variable w, but also has a global optimal solution because of its feasible region. Generally, for constrained optimization problems, the Lagrangian multiplier method can be introduced to turn the problem into an unconstrained optimization problem, that is, Equation (3).
Where
Therefore:
Substituting the above formula into the Lagrangian function yields
The following optimization model can be established:
What is finally obtained is a quadratic function to find the optimal solution. Some of the probable solutions
In order to increase the fault tolerance of the data, and considering the linear indivisibility, the SVM introduces a slack variable into the model to allow for a misclassified sample; the tolerance range must also be limited, thus a penalty parameter C is introduced, which indicates the penalty of the error—the smaller this parameter the better. The best solution can be achieved by taking the optimal parameters for different problems. This becomes a new optimization problem, such as (13)~(15).
Thus, the dual problem can be written as (16)~(17).
The above is the process of using SVM to construct a function for a linear problem [31,44,45]. For non-linear problems, according to Cover's theorem, if projected into high-dimensional space, the possibility of linear separability is higher than that if projected into low-dimensional space [44]. Most linear indivisible problems are linearly separable after mapping to high-dimensional space. The processing method in SVM theory is to treat the non-linear problem using a kernel function
Commonly used kernel functions include [49]
Linear kernel function:
Polynomial kernel function:
Radial basis kernel function (RBF):
Sigmoid nucleation function:
When the kernel function is used, the optimization problem can be expressed as per Equations (18)~(19).
The optimal classification function is solved as in Equation (20).
2.2. Selection of Early Warning Indicators
2.2.1. Principles for establishing an early warning indicator system
At present, in the research on real estate early warning systems, there are no unified selection criteria for the selection of early warning indicators. Such criteria must not only include the core variables needed for early warning, but should also discard redundant variables. At the same time, such criteria need to consider operability and timeliness. Therefore, the following six principles should be followed in the selection of real estate market early warning indicators: the comprehensive principle, the sensitivity principle, the operability principle, the independence principle, the validity principle, and the regional principle.
2.2.2. Selection method for real estate early warning indicators
The selection method for early warning indicators for the real estate market has always been a focus of experts globally, and plays a vital role in ensuring the accuracy of early warning results. By summarizing the methods used for selecting early warning indicators in China and internationally, these methods can be divided into two categories. The first category comprises purely qualitative methods, that is, those which select an indicator system by means of a certain subjective method. Although this type of method is simple to operate, its selection process is not sufficiently objective; different people apply different selection criteria and there is no unified theory guiding them. The second category combines multiple quantitative methods on the basis of qualitative judgments. This method is more suitable for dealing with complex systems such as real estate markets. Therefore, the present paper selects its early warning indicators using a qualitative perspective and then uses quantitative analysis to screen these indicators.
The process of selection of indicators by means of qualitative analysis should fully consider the six principles named above, whereas quantitative analysis usually includes multivariate statistical analysis methods and time difference analysis methods. Multivariate statistical analysis methods are often used for regular statistical analysis of multiple related indicators [50,51]. The specific methods include cluster analysis, principal component analysis, and discriminant analysis. The time difference analysis method refers to the quantitative analysis of indicators according to the time sequence between them, and includes the cyclic method, matching method, and the time difference correlation analysis method [50,51]. First, according to the conditions of China's real estate market and with the objective of establishing of an early warning indicator system, a series of early warning indicators are initially selected. The time difference correlation analysis method is then used to screen the preliminary selected early warning indicators, and the leading indicators and comparison indicators are taken in order to enable verification of the main data and to use for model training.
Because individual localities in the real estate market present different economic statuses, and the real estate market in each region has its own characteristics, the selection of the indicator system will vary with region. Therefore, this paper selects the most suitable real estate market early warning indicators for different regions within the overall market.
2.2.3. Determination of the early warning time difference
In the present paper, the time difference correlation analysis method is used to select the leading warning indicator for the real estate market warning system. Therefore, the change of the warning indicator's value is relative to the alarm status of the real estate market. However, in determining the warning time difference it is necessary to consider the warning indicator and the alarm status. The time difference between the two is determined, and this must not be too long or too short. After determining the early warning time difference, the warning indicator is paired with the lagging alarm indicator and input into model training, in order to enable future trends for the real estate market to be obtained by inputting up-to-date information for the warning indicator.
2.2.4. Choice of alarm indicators and warning levels
The early warning system's alarm status is defined by the alarm indicators; that is to say, the alarm indicators need to reflect the alarm situation and when the alarm situation is abnormal, this must be reflected in the alarm indicators. There is, however, no unified statement on the criteria by which alarm indicators should be selected. The two indicators that are generally used are the growth rate of total sales of commercial housing and the growth rate of commercial housing sales prices. Synthetic indicators can also be used to identify alarm conditions. Such composite indicators should be based on a number of different underlying indicators, reflecting the different weights to which these indicators are relevant to the status of the real estate market in the composition of the overall calculation. Because the area index is more stable than the price index, the growth rate of the area of land sold per year of commercial housing is selected as the alarm indicator.
The warning degree refers to the evaluation result of the early warning system and describes the alarm level of the situation as measured by the system. The literature indicates that there are two ways of dividing warning levels that are predominantly used. First, the alarm status can be divided into three levels: “hot,” “normal,” and “cold.” Although this method lacks detail, the advantage is that it is suitable when a small number of samples are available. Second, the alarm status can be divided into five levels: “overheating,” “slightly hot,” “normal,” “slightly cold,” and “too cold” [51]. Although this method describes the real estate market more accurately, if the number of samples is small, the division intervals are not sufficiently accurate and the reliability of the division is reduced. Because the unit of time used for establishing the model in this paper is the year, the first method of division is utilized, that is, the three-level division; “hot,” “normal,” and “cold.”
2.3. Choice of Urban Early Warning Indicators
2.3.1. Training and testing of early warning models
After selecting the warning indicator and the alarm indicator, the warning indicator data is paired with the time-adjusted alarm indicator data, and the data are divided into a training group and a detection group. The training group consists of sample data used for machine learning. The test group is not used in the training, and is only used to test the correctness of the model. If the result of testing using the test group is consistent with the actual real estate market conditions, then the model has demonstrated a certain feasibility. If there is a disparity between the results of testing and actual conditions, it is necessary to find the reason for the differences, eliminate any data problems, adjust the model's parameters, and reperform testing.
2.3.2. Practical application of early warning model
After selecting the early warning indicators, determining the early warning time difference, the alarm indicators and the warning degree, in order to enable the training and verify the detection performance of the early warning model, the full SVM early warning model has basically been formed, and is finally ready for empirical research to be conducted and real data to be used. By means of this model, early warning of future trends in the real estate market is achieved. The specific operations are as follows. First, the early warning indicator system is constructed, and then indicator data for the city over a number of years is used. Leading indicators are selected for use as the model's input signals by means of time difference correlation analysis. The output signals are determined according to the alarm conditions and warning degree, and historical data are used to construct the early warning model. After verifying the accuracy of the model, the data to be used in implementation of the model will be collected, processed, and input into the model, and the results obtained will determine the alarm status of the future real estate market of the city.
3. EMPIRICAL ANALYSIS
3.1. Choice of Urban Early Warning Indicators
When selecting specific indicators, it is noted that relative indicators are more able to measure the balance of development across all aspects of real estate than absolute indicators, and these can also reflect the degree of local real estate development. Therefore, most of the indicators selected in this paper are relative indicators. Combined with the above considerations and the establishment of the early warning indicator system, 12 relative indicators were initially selected as the early warning indicators for the urban real estate market, as shown in Table 1 [53,54].
| Index | Sub-index | Serial Number | References |
|---|---|---|---|
| Coordination between the real estate industry and the national economy | Real estate development investment/GDP | S1 | [55] |
| Real estate investment/Fixed-asset investment | S2 | [56] | |
| Real estate development self-raised funds/Sources of funds | S3 | [57] | |
| Commercial housing price growth rate/Urban residents' disposable income growth rate | S4 | [58,59] | |
| Growth rate of real estate land area purchased/GDP growth rate | S5 | [60,61] | |
| Harmonization of supply and demand in the real estate market | Commercial housing sales/Real estate investment | S6 | [62] |
| Sales area/Completed area | S7 | [63] | |
| Commercial housing price growth rate | S8 | [64] | |
| Coordination within the real estate industry | Residential investment/Commercial housing construction investment | S9 | [65] |
| Residential sales/All commercial housing sales | S10 | [66] | |
| Completed residential area/Completed area of all commercial housing | S11 | [67] | |
| New construction area of commercial housing/Construction area | S12 | [68] | |
Urban real estate market early warning indicators.
The sources of information used to construct Beijing's indicators mainly comprise the National Bureau of Statistics, the Beijing Municipal Bureau of Statistics, the CEIC (China Entrepreneur Investment Club) database, and the CRIC (China Real Estate Information Corporation) database [69–73]. The data provided by these sources are accepted as highly accurate. The relevant data are collected for periods from the year 2000 onward, and the data of early warning indicators for the Beijing real estate market from 2000 to 2018 are shown in Table 2.
| No | Year | S1 | S2 | S3 | S4 | S5 | S6 | S7 | S8 | S9 | S10 | S11 | S12 |
|---|---|---|---|---|---|---|---|---|---|---|---|---|---|
| 1 | 2000 | 0.17 | 0.40 | 0.14 | −0.38 | 1.16 | 0.90 | 0.70 | −0.05 | 0.55 | 0.87 | 0.74 | 0.38 |
| 2 | 2001 | 0.21 | 0.51 | 0.17 | 0.29 | 10.02 | 0.78 | 0.71 | 0.03 | 0.59 | 0.87 | 0.82 | 0.47 |
| 3 | 2002 | 0.23 | 0.55 | 0.17 | −0.69 | 2.58 | 0.82 | 0.72 | −0.05 | 0.59 | 0.88 | 0.81 | 0.43 |
| 4 | 2003 | 0.24 | 0.56 | 0.17 | −0.02 | −2.09 | 0.75 | 0.73 | 0.00 | 0.53 | 0.88 | 0.80 | 0.38 |
| 5 | 2004 | 0.24 | 0.58 | 0.15 | 0.92 | 4.81 | 0.99 | 0.81 | 0.12 | 0.53 | 0.87 | 0.78 | 0.30 |
| 6 | 2005 | 0.22 | 0.54 | 0.16 | 1.86 | −4.64 | 1.39 | 0.83 | 0.24 | 0.51 | 0.82 | 0.75 | 0.28 |
| 7 | 2006 | 0.21 | 0.51 | 0.14 | 1.50 | −3.76 | 1.26 | 0.82 | 0.20 | 0.50 | 0.75 | 0.69 | 0.30 |
| 8 | 2007 | 0.20 | 0.50 | 0.17 | 4.43 | 1.54 | 1.26 | 0.75 | 0.45 | 0.50 | 0.73 | 0.64 | 0.24 |
| 9 | 2008 | 0.17 | 0.50 | 0.21 | 0.74 | 8.56 | 0.87 | 0.52 | 0.09 | 0.49 | 0.72 | 0.55 | 0.23 |
| 10 | 2009 | 0.19 | 0.48 | 0.15 | 1.66 | −2.58 | 1.39 | 0.88 | 0.14 | 0.39 | 0.76 | 0.60 | 0.23 |
| 11 | 2010 | 0.21 | 0.53 | 0.24 | 3.40 | 2.32 | 1.00 | 0.69 | 0.30 | 0.52 | 0.71 | 0.63 | 0.29 |
| 12 | 2011 | 0.19 | 0.51 | 0.24 | −0.72 | −2.70 | 0.80 | 0.64 | −0.10 | 0.59 | 0.66 | 0.59 | 0.35 |
| 13 | 2012 | 0.18 | 0.49 | 0.19 | 0.62 | −3.96 | 1.05 | 0.81 | 0.07 | 0.52 | 0.74 | 0.64 | 0.25 |
| 14 | 2013 | 0.18 | 0.50 | 0.22 | 0.74 | 18.25 | 1.01 | 0.71 | 0.08 | 0.50 | 0.69 | 0.63 | 0.26 |
| 15 | 2014 | 0.17 | 0.49 | 0.19 | 0.18 | −4.65 | 0.74 | 0.48 | 0.04 | 0.50 | 0.77 | 0.59 | 0.18 |
| 16 | 2015 | 0.18 | 0.52 | 0.22 | 2.31 | −4.14 | 0.84 | 0.59 | 0.21 | 0.45 | 0.71 | 0.52 | 0.21 |
| 17 | 2016 | 0.16 | 0.47 | 0.17 | 3.32 | −2.72 | 1.14 | 0.71 | 0.28 | 0.48 | 0.61 | 0.53 | 0.22 |
| 18 | 2017 | 0.13 | 0.41 | 0.16 | 0.20 | 5.94 | 0.76 | 0.60 | 0.02 | 0.46 | 0.74 | 0.41 | 0.19 |
Early warning index data of Beijing real estate market from 2000 to 2017.
3.2. Determination of Warning Indicators
The selection of benchmark cycle indicators should follow the principles of reliability, operability, practicability, and so on. Because the role of benchmark cycle indicator is to judge the lead–lag relationship between the early warning indicator and the market's status, it must be capable of expressing the up-to-date warning status. In other words, it should be a coincident indicator. With reference to relevant research results, the benchmark cycle indicator used could be the growth rate of area of land sold per year in commercial housing sales or the growth rate of commercial housing prices. Because the time unit used in the model established in this paper is years, the area of land in sales of commercial housing is a cumulative value with obvious fluctuations and will not be affected by the statistical time point, and therefore this data is expected to be a more reliable indicator. Therefore, the growth rate of the area of land in sales of commercial housing is used in this paper to analyze the correlation and time difference between the selected early warning indicators and to determine the lead–lag relationship.
In the classification of all early warning indicators, the time difference correlation coefficient between each indicator and the growth rate of the area of land in commercial housing sales should be calculated successively, and the lead–lag relationships of indicators should be determined by comparing the absolute values of coefficients for different lagging periods. Specifically, in SPSS software, it is necessary to input the evaluated indicators in turn, respectively calculate the correlation coefficients for different delay time periods for the benchmark indicators, and determine the lead–lag relationship of the indicators based on the corresponding delay numbers. If the delay number is less than −3 (i.e., if the indicator observation preceded the correlated growth rate of the area of land in sales of commercial housing by more than three years), it is judged as a leading indicator; if it is larger than 3, it is judged as a lagging indicator; for other values, it is treated as a coincident indicator. Taking the selected indicator S5, that is, growth rate of real estate land area purchased/GDP growth rate as an example, as shown in Table 3, the correlation coefficient for the time difference with the largest absolute value is 0.488, and the corresponding delay number is −4, indicating that the selected indicator is observed in advance of the benchmark cycle indicator, and is also the leading indicator. Similarly, these early warning indicators were all input into SPSS software for processing, and the results are shown in Table 4.
| Delay Number | Time Difference Correlation Coefficient | Standard Error |
|---|---|---|
| −7 | −0.165 | 0.302 |
| −6 | −0.106 | 0.289 |
| −5 | −0.300 | 0.277 |
| −4 | 0.488 | 0.267 |
| −3 | −0.318 | 0.258 |
| −2 | −0.152 | 0.250 |
| −1 | 0.328 | 0.243 |
| 0 | −0.141 | 0.236 |
| 1 | 0.190 | 0.243 |
| 2 | 0.176 | 0.250 |
| 3 | 0.118 | 0.258 |
| 4 | −0.267 | 0.267 |
| 5 | 0.216 | 0.277 |
| 6 | −0.170 | 0.289 |
| 7 | −0.112 | 0.302 |
Time difference correlation analysis data of the evaluated indicator S5 and the benchmark cycle indicator.
| Indicator Type | Name of Early Warning Indicator | Time Difference Correlation Coefficient with the Largest Absolute Value | Corresponding Lagging Period |
|---|---|---|---|
| Leading indicator | Real estate development investment/GDP | 0.388 | −4 |
| Real estate investment/Fixed-asset investment | 0.323 | −6 | |
| Commercial housing price growth rate/Urban residents' disposable income growth rate | 0.417 | −7 | |
| Growth rate of real estate land area purchased/GDP growth rate | 0.488 | −4 | |
| Commercial housing price growth rate | 0.399 | −7 | |
| Residential sales/All commercial housing sales | 0.515 | −4 | |
| Completed residential area/Completed area of all commercial housing | 0.539 | −4 | |
| Coincident indicator | Real estate development self-raised funds/Sources of funds | 0.481 | 0 |
| Commercial housing sales/Real estate investment | 0.637 | 1 | |
| Sales area/Completed property area | 0.588 | 0 | |
| Residential investment/Commercial housing construction investment | 0.498 | −2 | |
| New construction area of commercial housing/Total construction area | 0.475 | −1 | |
| Lagging indicator | None | – | – |
Time difference correlation analysis results for real estate market early warning indicators in Beijing.
The above process identifies seven leading indicators, five coincident indicators, and no lagging indicators. This paper selects the leading indicator for use as the warning indicator in the model. The following is the analysis of each warning indicator.
3.3. Judgment of Alarm Status for Beijing Real Estate Market
3.3.1. Selection of alarm indicators
The alarm indicator selected in this paper is the growth rate of land area of commercial housing sales. By collecting and processing data for the full range of years used in this study, the warning level for each year can be obtained, and these can be combined with the actual market conditions for analysis in order to ensure that they accurately reflect the alarm conditions of the real estate market in Beijing.
3.3.2. Partition of alarm indicators
As previously explained, the alarm indicator uses three levels of warning degree: “cold,” “normal,” and “hot.” To use SVM to build the model, it is necessary to normalize the alarm indicator data. The tool used in this paper is the description and statistics function in the SPSS software, and the intervals are divided at one standard deviation above and below the mean, that is, the interval (−∞, −1) represents the cold state, the interval (−1, 1) represents the normal state, and the (1, +∞) interval represents the hot state. These data are combined with the previous analysis of the Beijing real estate market to verify the judgments made.
3.3.3. Warning degree for Beijing real estate market
By using Matlab software to process the data for Beijing's alarm indicator for the period from 2000 to 2018, the warning degree for Beijing's real estate market is produced as shown in Table 5.
| Year | Growth Rate of Land Area of Commercial Housing Sales | Standardized Value | Warning Degree |
|---|---|---|---|
| 2000 | 0.76 | 1.91 | Hot |
| 2001 | 0.26 | 0.53 | Normal |
| 2002 | 0.42 | 0.97 | Normal |
| 2003 | 0.11 | 0.11 | Normal |
| 2004 | 0.46 | 1.08 | Hot |
| 2005 | 0.13 | 0.17 | Normal |
| 2006 | −0.17 | −0.66 | Normal |
| 2007 | −0.17 | −0.66 | Normal |
| 2008 | −0.39 | −1.27 | Cold |
| 2009 | 0.77 | 1.94 | Cold |
| 2010 | −0.31 | −1.05 | Cold |
| 2011 | −0.12 | −0.53 | Normal |
| 2012 | 0.35 | 0.78 | Normal |
| 2013 | −0.02 | −0.25 | Normal |
| 2014 | −0.23 | −0.83 | Normal |
| 2015 | 0.07 | 0.00 | Normal |
| 2016 | 0.08 | 0.03 | Normal |
| 2017 | −0.48 | −1.52 | Cold |
| 2018 | −0.20 | −0.75 | Normal |
Warning degree of Beijing real estate market.
It can be seen from Table 5 that during the period from 2000 to 2018, the levels of warning degree in Beijing were hot, normal, hot, normal, cold, hot, cold, normal, cold, and normal. A review of the process of development of Beijing's real estate market shows that the fluctuations are mainly caused by the central government's promulgation of a series of real estate policies and Beijing's active regulation policies implemented during the economic downturn and the period during which the market was overheated, and these policies appear consistent with the actual market status as it has developed.
3.4. Training and Testing of Early Warning Models for Beijing Real Estate Market
3.4.1. Selection of early warning time difference
The early warning time difference refers to the difference between the time of occurrence of the warning indicator data and the corresponding market conditions. The longer this time difference, the more favorable the warning system is for understanding future trends in the real estate market, because the better it will enable the government to exert reasonable guidance and investors to make investment decisions. However, if the time difference exceeds the period within which the system can make accurate predictions, the early warning results will be inaccurate. Informed by the time difference correlation analysis of the early warning indicators, this study sets the early warning time difference in its models as one year. This choice of early warning time difference means that the early warning model must establish a mapping relationship between the annual warning indicators and the alarm conditions in the next year, in order to predict the real estate situation at that time. In this way, the model can not only provide predictions and warnings, but can also avoid the failure of its predictive ability by avoiding an excessive time difference.
3.4.2. Early warning model structure design
Based on the theory of multi-classification SVM, this paper adopts a one-to-many method to realize multi-classification in the present model. The input data are the processed warning indicators, and the number of data classes is seven, including (x1) real estate development investment/GDP, (x2) real estate investment/fixed-asset investment, (x3) commercial housing price growth rate/urban residents' disposable income growth rate, (x4) growth rate of real estate land area purchased/GDP growth rate, (x5) housing price growth rate, (x6) residential sales/all commercial housing sales, and (x7) completed residential area/completed area of all commercial housing. Because SVM is a quadratic classifier, the number of categories output by each classifier is two, and the output content is the classified representation of the corresponding map, that is, the warning level describing the alarm situation. According to the partition of warning levels in Section 2, three levels of warning are used: “cold,” “normal,” and “hot.” According to the one-to-many method in the multi-classification, cold, hot, and normal states are each set as one class in the training model, with the corresponding expression “−1.” Within each classification, other levels are represented as another class with the corresponding expression “1.” Therefore, three SVMs are required for three classes. The three SVM warning degrees and corresponding representations are shown in Table 6.
| Classifier Serial Number | Warning Degree Type | Corresponding Representation |
|---|---|---|
| 1 | Cold | −1 |
| Normal, hot | 1 | |
| 2 | Hot | −1 |
| Cold, normal | 1 | |
| 3 | Normal | −1 |
| Cold, hot | 1 |
Representation of warning degree corresponding to SVM classifier.
3.4.3. Training and testing of early warning models
First, the data samples from 2000 to 2017 are divided into the training set and testing set. The training set comprises a proportion of 95% of the total sample, that is, data for 17 years, and the remaining 5% of the total sample is used as the testing set, that is, data for one year. Warning data for 2018 are used as a predictive data set for the model. The tool used is the A Library for Support Vector Machines (LIBSVM) tool designed for SVM applications. Its advantages are its professionalism, limited number of input parameters, and the ability to quickly and reliably solve SVM problems. The data format used in this software package is <label><index1>:<value1><index2>:<value2>…, it is necessary to convert the original data into this format, which can be implemented by the LIBSVM tool when the data is limited. In order to improve the speed and stability of the SVM operation, all data samples need to be normalized. The normalized results of the data corresponding to classifier 1 are shown in Table 7.
| Year | Ratio of Real Estate Development Investment to GDP | The Ratio of Real Estate Investment to Fixed-Asset Investment | Commercial Housing Price Growth Rate/Urban Residents' Disposable Income Growth Rate | Growth Rate of Real Estate Land Area Purchased/GDP Growth Rate | Commercial Housing Price Growth Rate | Residential Sales/All Commercial Housing Sales | Completed Residential Area/Completed Area of All Commercial Housing |
|---|---|---|---|---|---|---|---|
| 2000 | 0.30 | 0.00 | 0.69 | 0.29 | 0.09 | 0.96 | 0.82 |
| 2001 | 0.71 | 0.61 | 0.73 | 0.66 | 0.24 | 0.97 | 1.00 |
| 2002 | 0.87 | 0.79 | 0.67 | 0.35 | 0.08 | 1.00 | 0.98 |
| 2003 | 0.96 | 0.86 | 0.71 | 0.15 | 0.17 | 0.99 | 0.97 |
| 2004 | 1.00 | 1.00 | 0.77 | 0.44 | 0.39 | 0.97 | 0.90 |
| 2005 | 0.77 | 0.76 | 0.84 | 0.04 | 0.62 | 0.78 | 0.85 |
| 2006 | 0.71 | 0.60 | 0.81 | 0.08 | 0.54 | 0.52 | 0.68 |
| 2007 | 0.63 | 0.56 | 1.00 | 0.30 | 1.00 | 0.45 | 0.57 |
| 2008 | 0.35 | 0.52 | 0.76 | 0.60 | 0.35 | 0.42 | 0.33 |
| 2009 | 0.54 | 0.44 | 0.82 | 0.13 | 0.43 | 0.56 | 0.47 |
| 2010 | 0.66 | 0.70 | 0.93 | 0.33 | 0.73 | 0.35 | 0.53 |
| 2011 | 0.49 | 0.62 | 0.67 | 0.13 | 0.00 | 0.18 | 0.43 |
| 2012 | 0.40 | 0.47 | 0.76 | 0.07 | 0.30 | 0.48 | 0.56 |
| 2013 | 0.39 | 0.52 | 0.76 | 1.00 | 0.32 | 0.29 | 0.55 |
| 2014 | 0.38 | 0.51 | 0.73 | 0.04 | 0.24 | 0.58 | 0.44 |
| 2015 | 0.44 | 0.67 | 0.86 | 0.07 | 0.56 | 0.38 | 0.28 |
| 2016 | 0.21 | 0.39 | 0.93 | 0.12 | 0.69 | 0.00 | 0.30 |
| 2017 | 0.00 | 0.06 | 0.00 | 0.49 | 0.21 | 0.49 | 0.00 |
| 2018 | 0.23 | 0.57 | −0.47 | 0.00 | −0.04 | 0.91 | 0.52 |
Normalized results for Beijing real estate market warning indicators.
After basic data processing, it is necessary to conduct parameter optimization. To determine the parameters, the type of SVM should first be selected. 0--C-SVC is selected in this study, which is specifically used to solve the classification problem. Second, it is necessary to select the type of kernel function. In circumstances where the distribution of the original data set is not known, Gaussian RBF is usually adopted, and the distribution rule of the real estate market warning indicator is unknown. Accordingly, Gaussian RBF is selected in this paper. Then there are two parameters that need to be determined in the model. One is the penalty parameter C, representing the error tolerance. The parameter should be neither as large as possible, nor as small as possible. If too large, the hyperplane will be too complex and a dimensionality disaster will occur. If too small, the fitting effect of training sample data will be poor. The best results can be obtained only by selecting the optimal parameters for specific problems. The second parameter to be determined is the kernel function parameter g, which can control the distribution of samples in the original space after they are projected into high-dimensional space. Selecting a set of optimal parameters enables the model to achieve a more accurate prediction; the Grid Ergodic method is a usual way to find the best set of parameters. The basic principle of the Grid Ergodic method is to divide the range of the penalty parameter C and the kernel function parameter g into a grid, then evaluate all the points on the grid. Finally, the classification accuracy of selected parameters is verified using the K-fold cross-validation (CV) method. The group of parameters with the highest accuracy is deemed to represent the optimal parameters.
The basic principle of the K-fold CV method is to divide the training set into K parts; usually K is 5, and these five parts are sequentially used to test the models built using the remaining four parts. When the test set results are compared with the real values, a CV error will be obtained based on the differences identified in this comparison, and each part of the cycle as a testing set will produce five CV errors. Calculating the average value and determining the set of parameters with the minimum average error gives the optimal parameter. Using the training set for CV can ensure the generalization ability of the model and avoid over-learning.
The establishment process for the three classifiers is similar. Taking classifier 1 as an example, after the above process of parameter optimization (Figure 3), the optimal parameter C obtained by classifier 1 has a value of 512, and the optimal parameter g has a value of 0.0078125. With the selected optimal parameters, sample data for the period from 2000 to 2016 were used as the training set for machine learning and in-sample testing. The results for classifier 1 are shown in Table 8, and its in-sample classification accuracy is 94.74%.

Parameter optimization process of Beijing real estate market early warning model.
| Sample | Serial Number | Real Classification | Predictive Classification | |||||||
|---|---|---|---|---|---|---|---|---|---|---|
| Training set | 1 | 0.30 | 0.00 | 0.69 | 0.29 | 0.09 | 0.96 | 0.82 | 1 | 1 |
| 2 | 0.71 | 0.61 | 0.73 | 0.66 | 0.24 | 0.97 | 1.00 | 1 | 1 | |
| 3 | 0.87 | 0.79 | 0.67 | 0.35 | 0.08 | 1.00 | 0.98 | 1 | 1 | |
| 4 | 0.96 | 0.86 | 0.71 | 0.15 | 0.17 | 0.99 | 0.97 | 1 | 1 | |
| 5 | 1.00 | 1.00 | 0.77 | 0.44 | 0.39 | 0.97 | 0.90 | 1 | 1 | |
| 6 | 0.77 | 0.76 | 0.84 | 0.04 | 0.62 | 0.78 | 0.85 | 1 | 1 | |
| 7 | 0.71 | 0.60 | 0.81 | 0.08 | 0.54 | 0.52 | 0.68 | 1 | 1 | |
| 8 | 0.63 | 0.56 | 1.00 | 0.30 | 1.00 | 0.45 | 0.57 | −1 | −1 | |
| 9 | 0.35 | 0.52 | 0.76 | 0.60 | 0.35 | 0.42 | 0.33 | 1 | 1 | |
| 10 | 0.54 | 0.44 | 0.82 | 0.13 | 0.43 | 0.56 | 0.47 | −1 | 1 | |
| 11 | 0.66 | 0.70 | 0.93 | 0.33 | 0.73 | 0.35 | 0.53 | 1 | 1 | |
| 12 | 0.49 | 0.62 | 0.67 | 0.13 | 0.00 | 0.18 | 0.43 | 1 | 1 | |
| 13 | 0.40 | 0.47 | 0.76 | 0.07 | 0.30 | 0.48 | 0.56 | 1 | 1 | |
| 14 | 0.39 | 0.52 | 0.76 | 1.00 | 0.32 | 0.29 | 0.55 | 1 | 1 | |
| 15 | 0.38 | 0.51 | 0.73 | 0.04 | 0.24 | 0.58 | 0.44 | 1 | 1 | |
| 16 | 0.44 | 0.67 | 0.86 | 0.07 | 0.56 | 0.38 | 0.28 | 1 | 1 | |
| 17 | 0.21 | 0.39 | 0.93 | 0.12 | 0.69 | 0.00 | 0.30 | −1 | −1 | |
| Testing set | 18 | 0.00 | 0.06 | 0.00 | 0.49 | 0.21 | 0.49 | 0.00 | 1 | 1 |
Training and testing data of early warning model classifier 1 in Beijing real estate market.
The classification effect of the model can be tested using the testing set. The 2017 sample data is used as the testing set. Because the data in the testing set does not participate in the training, its classification effect can be used to demonstrate the classification ability of the model. After the model is built, the testing set sample data are input into the model. The final running result is shown in the sequence number 18 in Table 8. Similarly, the testing set samples must be input for classifier 2 and classifier 3, respectively, as shown in Table 9. After comparing the results of the three classifiers, it can be concluded that the output result of the testing set for the Beijing real estate market is “normal,” referring to the warning degree in Table 6, which is consistent with the actual situation. Therefore, the SVM model has a certain degree of credibility; it not only has a high accuracy rate, but also has a good generalization ability, which can be used to provide warnings regarding the development of the real estate market in Beijing in 2019.
| Classifier | Predictive Classification | Real Classification |
|---|---|---|
| Classifier 2 | 1 | 1 |
| Classifier 3 | −1 | −1 |
Testing results of early warning model classifiers 2 and 3 in Beijing real estate market.
4. REALIZATION OF THE EARLY WARNING SYSTEM FOR THE BEIJING REAL ESTATE MARKET
In the previous section, the feasibility of the model was preliminarily proved by the establishment and verification of the real estate market early warning model for Beijing. Therefore, in this paper this model will be utilized to provide early warnings for the Beijing real estate market in 2019. The results of the 2018 warning indicators, after processing, are shown in Table 10. After inputting the results into three classifiers, the model output results are shown in Table 11.
| Name of Indicators | Normalized Values |
|---|---|
| The ratio of real estate development investment to GDP | 0.23 |
| The ratio of real estate investment to fixed-asset investment | 0.57 |
| Commercial housing price growth rate/Urban residents' disposable income growth rate | −0.47 |
| Growth rate of real estate land area purchased/GDP growth rate | 0.00 |
| Commercial housing price growth rate | −0.04 |
| Residential sales/All commercial housing sales | 0.91 |
| Completed residential area/Completed area of all commercial housing | 0.52 |
Beijing's 2018 warning indicators and their normalized values.
| Year | Prediction Output |
||
|---|---|---|---|
| Classifier 1 | Classifier 2 | Classifier 3 | |
| 2019 | 1 | 1 | −1 |
Predictive value for Beijing's alarm status in 2019.
According to the output results of three classifiers and the theory described in previous sections, it can be concluded that the real estate market in Beijing is expected to operate normally in 2019.
5. DISCUSSION
5.1. Analysis of Early Warning Results
In recent years, the real estate market in Beijing has been developing rapidly. The inflow of large numbers of skilled workers and the development of the economy have created a huge demand for self-occupancy properties and investment properties, so commercial housing prices have remained high. In the 19 years from 2000 to 2018 (inclusive), in three years the market was classified as cold, two years were classified as hot, and other years were normal. Within this time period, the years 2008, 2009, and 2010 are three representative years which were cold, hot, and cold respectively, showing that the status alternated between cold and hot, without reverting to normal status. Reviewing the timing of the release and implementation of relevant national real estate regulation policies, it can be found that there were major adjustments of national macro policy in 2008. At the beginning of the year, the “Double Prevention Policy” was implemented. In the middle of the year, the “A Security Control” policy was implemented, and the “Promoting growth” was implemented at the end of the year. In order to promote growth, the state also implemented an expansionary monetary policy. From September to December in 2008, the central bank reduced interest rates five times consecutively and reduced the requirement reserve ratio four times. The result was overcorrection, which led to the direct change of the real estate market's status from cold in 2008 to hot in 2009.The real estate regulation and control policy of 2009 also changed from stimulus to containment: at the beginning of the year, “real estate preferential policies to stimulate the housing market” were implemented; “increasing land supply and rectifying market order” policy was carried out in the middle of the year; and at the end of the year “preventing the expansion of the bubble and curbing the excessive rise in house prices” was put forward. Since the end of 2009, regulation and control policy has gradually strengthened. In April of 2010, the State Council issued the “Ten National Rules,” which have been described as “the most stringent regulatory policy in history” and directly brought the real estate market to a cold status [74].
The macro-control policies in 2008–2010 basically achieved the intended purpose of regulation, but the use of these expansionary monetary policies and the strict management policy of restricting purchases and loans led directly to the rapid alternation between hot and cold markets, which was extremely abnormal market behavior. For the real estate market, stability is crucial.
5.2. Policy Advice
According to the early warning analysis for Beijing, it is found that the stability of China's real estate market should be the most important objective. The following four policy recommendations are intended to help achieve such stability.
Actively promote the marketization of real estate and focus on the balance between supply and demand.
Local governments should encourage the marketization of real estate within a reasonable range. The management of the market should be carried out within the framework of the market economy and should conform to market rules relating to the scope of adjustment, power operation, and policy formulation, in the implementation of measures. First, the imbalance of the total supply and demand in China should gradually be rectified and the effective supply should be increased. In this regard, it is first necessary to undertake long-term planning for the urban real estate market, analyzing the development trend in China's population and the process of urbanization to estimate future market demand, clarify the land supply plan, and stabilize market expectations. Second, it is reasonable to increase the distribution of property with respect to the rental housing market and to actively promote this market. Effective measures should be taken to stabilize levels of property rental, protect leasehold rights, and encourage and accelerate the development of the rental market. China should then adjust demand levels, establish a policy system for basic needs and other consumer investment needs, guide all forms of demand in the range that income levels can bear and encourage people to consume and invest rationally, thus ensuring the healthy development of the real estate market.
Improve systems and promote the long-term mechanism for the sustainable development of the real estate industry.
First, a complete system of laws and regulations should be constructed to clarify the boundaries between the government and the market in terms of real estate markets. While ensuring compliance with market rules, certain macroeconomic regulation and control can also be carried out. The responsibility of the government should be clarified on the issue of housing security based on specific laws. Second, it is reasonable to improve the land supply system and to seek a better way to resolve the contradiction between the monopoly of the land market and the high marketization of the secondary development market, such as by the block auction of land to prevent a secondary monopoly from being acquired by the buyer. Strict regulations on permissible development times after a developer obtains land can be utilized. Third, a scientific and reasonable housing security system can be built. In this regard, first the object of protection and its scope of protection should be scientifically defined; second, it is proper to encourage both rent and sale of properties in order to provide protection for low-income people without violating the laws of the market; third, low-cost housing, price-limiting housing, and other types of affordable housing should be clearly defined in order to accommodate their interface with each other and format a reasonable housing structure system.
Standardize real estate financing behavior and broaden real estate financing channels.
In the process of real estate investment, capital is the most basic factor. If sources of funds can be controlled, then investment in the real estate industry can also be fundamentally controlled. Therefore, if financial means are used reasonably and effectively, then real estate financing behavior can be further regulated. For example, the management of housing development loans can be strengthened and eligibility criteria for loans strictly examined. Specific policies and practices can also be learned from other countries to carry out appropriate financial innovation. First, in terms of institutional innovation, it is necessary not only to give full play to the advantages of commercial housing financial institutions, but also to appropriately increase the supply of policy-based housing finance, to provide maximum convenience to the people in need of debt guarantees, and to provide financial support for the supply of affordable housing, in order to form a financial system combining the two factors. Second, in terms of product innovation, China should promote the implementation of the pilot securitization of residential mortgage loans and enrich the sources of funds in order to reduce risk levels. Third, in terms of channel innovation, real estate developers can be guided to expand financing channels, not only by means of bank loans, but also through equity, bonds, trusts, and other means. These formal financing channels can reduce dependence on unstable sources of credit.
Strengthen the promotion of real estate market regulation policy.
First, it is necessary to enhance the transparency of information and prevent adverse stakeholders from transmitting incorrect information. Second, the effectiveness of regulatory policies can be maximized. If the government's guidance may influence people's investment decisions, the public can be influenced to establish a correct approach to consumption and their behavior in the real estate market can return to rational consumption. At the same time, it may be appropriate for the government to consider increasing supervision of media related to real estate markets in order to be better able to investigate and respond to media that is misleading to consumer expectations [72].
6. CONCLUSION
Among possible early warning methods, an SVM method that has performed well in dealing with problems such as small samples, generalization ability, and non-linearity is selected to establish a mathematical model for real-time early warning for real estate markets. Among the sample data, the output results for 2008, 2009, and 2010 were cold, hot, and cold, respectively. This is because national macro policy underwent frequent major adjustments in these three years, which have caused Beijing's real estate market to be subject to continuous fluctuations from containment to stimulus to containment. After the verification of the model, the future status of the real estate market in Beijing is predicted. The results indicate that the real estate market in 2019 will be in a “normal” state. At present, the keynote policy for China's real estate market is to maintain stability. According to the results of the early warning model, the Chinese government should promote the real estate market, improve the real estate system, broaden real estate financing channels, and strengthen publicity for real estate market regulation policies, in order to prevent the formation of a bubble in the Chinese real estate market and to achieve a balance between supply and demand and healthy development. In our future work, we will investigate the evaluation frameworks of existing early warning models based on the ELECTRE III, TOPSIS with the integration of proportional hesitant fuzzy linguistic information [75,76].
CONFLICT OF INTERESTS
The authors declare they have no conflicts of interest.
AUTHOR CONTRIBUTIONS:
All authors contributed to the work. All authors read and approved the final manuscript.
ACKNOWLEDGMENTS
This work was supported by the National Natural Science Foundation of China (Grant numbers 71801175, 71871171, 71971182, and 71902041), the Theme-Based Research Projects of the Research Grants Council (Grant number T32-101/15-R) and the Fundamental Research Funds for the Central Universities (Grant number 2042018kf0006), the Ger/HKJRS project (grant number G-CityU103/17), and partly by the City University of Hong Kong SRG (Grant number 7004969).
REFERENCES
Cite this article
TY  - JOUR
AU  - Xian-Jia Wang
AU  - Guan-Tian Zeng
AU  - Ke-Xin Zhang
AU  - Hai-Bo Chu
AU  - Zhen-Song Chen
PY  - 2020
DA  - 2020/02/03
TI  - Urban Real Estate Market Early Warning Based on Support Vector Machine: A Case Study of Beijing
JO  - International Journal of Computational Intelligence Systems
SP  - 153
EP  - 166
VL  - 13
IS  - 1
SN  - 1875-6883
UR  - https://doi.org/10.2991/ijcis.d.200129.001
DO  - 10.2991/ijcis.d.200129.001
ID  - Wang2020
ER  -