
A Search-Based Test Data Generation Method for Concurrent Programs
 , Hassan Haghighi*,
 - DOI
- 10.2991/ijcis.d.200805.003How to use a DOI?
- Keywords
- Software testing; Test data generation; Concurrent program; Hybrid meta-heuristic algorithm
- Abstract
Concurrent programs are being widely adopted in development of multi-core and many-core processors. However, these types of programs present some features such as concurrency, communication and synchronization which make their testing more challenging than sequential programs. Search-based techniques, which use meta-heuristic search algorithms, have frequently been used for testing sequential programs, especially in the test data generation activity. However, application of search-based techniques in test data generation for concurrent programs has seldom been covered in the literature. The first contribution of this paper is to present a search-based test data generation framework for concurrent programs. Additionally, a hybrid meta-heuristic algorithm, called SFLA-VND, is proposed, which could be used in the mentioned framework as well as other meta-heuristic algorithms. SFLA-VND is a combination of the shuffled frog leaping algorithm (SFLA) and the variable neighborhood descent (VND). The proposed framework has been experimented on five concurrent benchmark programs by applying genetic algorithm (GA), ant colony optimization (ACO), particle swarm optimization (PSO), SFLA and SFLA-VND. Experimental results demonstrate the effectiveness and efficiency of this framework. Also, the results confirm the superiority of SFLA-VND in comparison with some popular meta-heuristic algorithms, when they are used for test data generation.
- Copyright
- © 2020 The Authors. Published by Atlantis Press B.V.
- Open Access
- This is an open access article distributed under the CC BY-NC 4.0 license (http://creativecommons.org/licenses/by-nc/4.0/).
1. INTRODUCTION
The concurrent programming style is widely used in modern programs to improve the performance and decrease the computation time of the programs [1]. Such adoption of concurrent systems calls for new challenges, as it is important that these systems work correctly. Software testing is one of the significant stages in software development life cycle which aims to evaluate the quality and to improve the reliability of the software by detecting as many failures as possible.
Test data generation is an important activity in software testing because effectiveness and efficiency of the test is highly dependent to the number and quality of the test data. Various methods, such as search-based techniques, have been used for test data generation in sequential programs. Search-based methods apply meta-heuristic algorithms to automate the search for test data with the aim of maximizing the achievement of test goals [2]. However, the application of these methods for test data generation in concurrent programs has rarely been covered in the literature.
Concurrent programs include some features such as concurrency, communication and synchronization that make testing a challenging activity. These features have not been considered in the fitness function of the search-based methods, which have been introduced for sequential programs so far. Therefore, direct application of these methods to concurrent programs would be ineffective [3].
A concurrent program consists of multiple processes that interact using either message passing or shared memory paradigms. The vast majority of testing approaches have focused on shared memory programs, and there is a few researches working on message-passing programs. Also, most testing techniques for concurrent programs target the selection of relevant interleavings, and a few techniques work on test data generation [4].
This paper mainly concentrates on test data generation for message-passing-based concurrent programs and has two main contributions:
Proposing a search-based test data generation framework for concurrent programs. This framework uses a testing criterion alongside a fitness function which are both well suited for concurrent programs. It consists of four main steps. First, the program under test is instrumented by which some codes are added to the program in order to obtain the required information from the program execution for a particular input data. Next, a graph called the parallel control flow graph (PCFG) is built from the program. In the third step, a list of test requirements which are to be covered is extracted according to the all-def-s-use test criterion; all-def-s-use is one of the test criteria introduced for concurrent programs in [5,6]. The fourth step tries to cover each test requirement using a meta-heuristic algorithm. This step is the most important step of the proposed framework in which each of the meta-heuristic algorithms can be used.
Suggesting a new hybrid meta-heuristic algorithm named SFLA-VND. It is based on a modified version of the shuffled frog leaping algorithm (SFLA), which uses the variable neighborhood descent algorithm (VND) for local search. We use SFLA-VND in the framework proposed as the first contribution, even though each of the meta-algorithms introduced so far can be used in this framework as well.
SFLA is a meta-heuristic optimization algorithm that mimics the memetic evolution of a group of frogs when seeking for the location that has the maximum amount of available food. This algorithm has shown its good performance in many optimization problems [7–9]. However, this algorithm may converge to a solution that is not the global optimum. To solve this problem, we combine SFLA with the VND algorithm in order to intensify the search and achieve a better solution. The VND algorithm will only be run if SFLA gets stuck in local optima. In this situation, VND receives the best solution produced by SFLA and tries to improve it. To do this, VND performs the search in the neighborhood of the best solution while the neighborhood domain increases during the search process. In addition, we utilize another technique, called replacement, to escape the algorithm from local optima. In the replacement stage, a percentage of elements with the lowest fitness are replaced by random elements.
The proposed framework for test data generation has been evaluated by applying genetic algorithm (GA), ant colony optimization (ACO), particle swarm optimization (PSO), SFLA and SFLA-VND. In addition, the framework has been investigated in terms of its ability to detect program faults. The results show the effectiveness and efficiency of this framework in test data generation for concurrent programs.
The paper is organized as follows: In Section 2, the basic concepts are given, and a literature review is presented. Section 3 introduces the proposed framework. Then, it is followed with a detailed description of SFLA-VND in Section 4. In Section 5, the experimental results are presented. Finally, Section 6 covers the conclusion and the suggested future works.
2. BACKGROUND
2.1. Basic Concepts
A concurrent program consists of two or multiple processes/threads which are in progress at the same time. Parallel programs can be considered as a particular type of concurrent programs which their processes/threads are executed simultaneously [10]. A parallel program can be modeled with a graph called the PCFG [5]. Other types of the concurrent programs can also be modeled as a graph. For example, in Prado et al. [11], the method of converting a multithreaded concurrent program to the PCFG graph has been described.
A PCFG for a parallel program consists of control flow graphs of the program processes. These graphs are linked by so-called inter-processes or communication edges which represent communication between processes. The control flow graph of the concurrent program process p is represented with
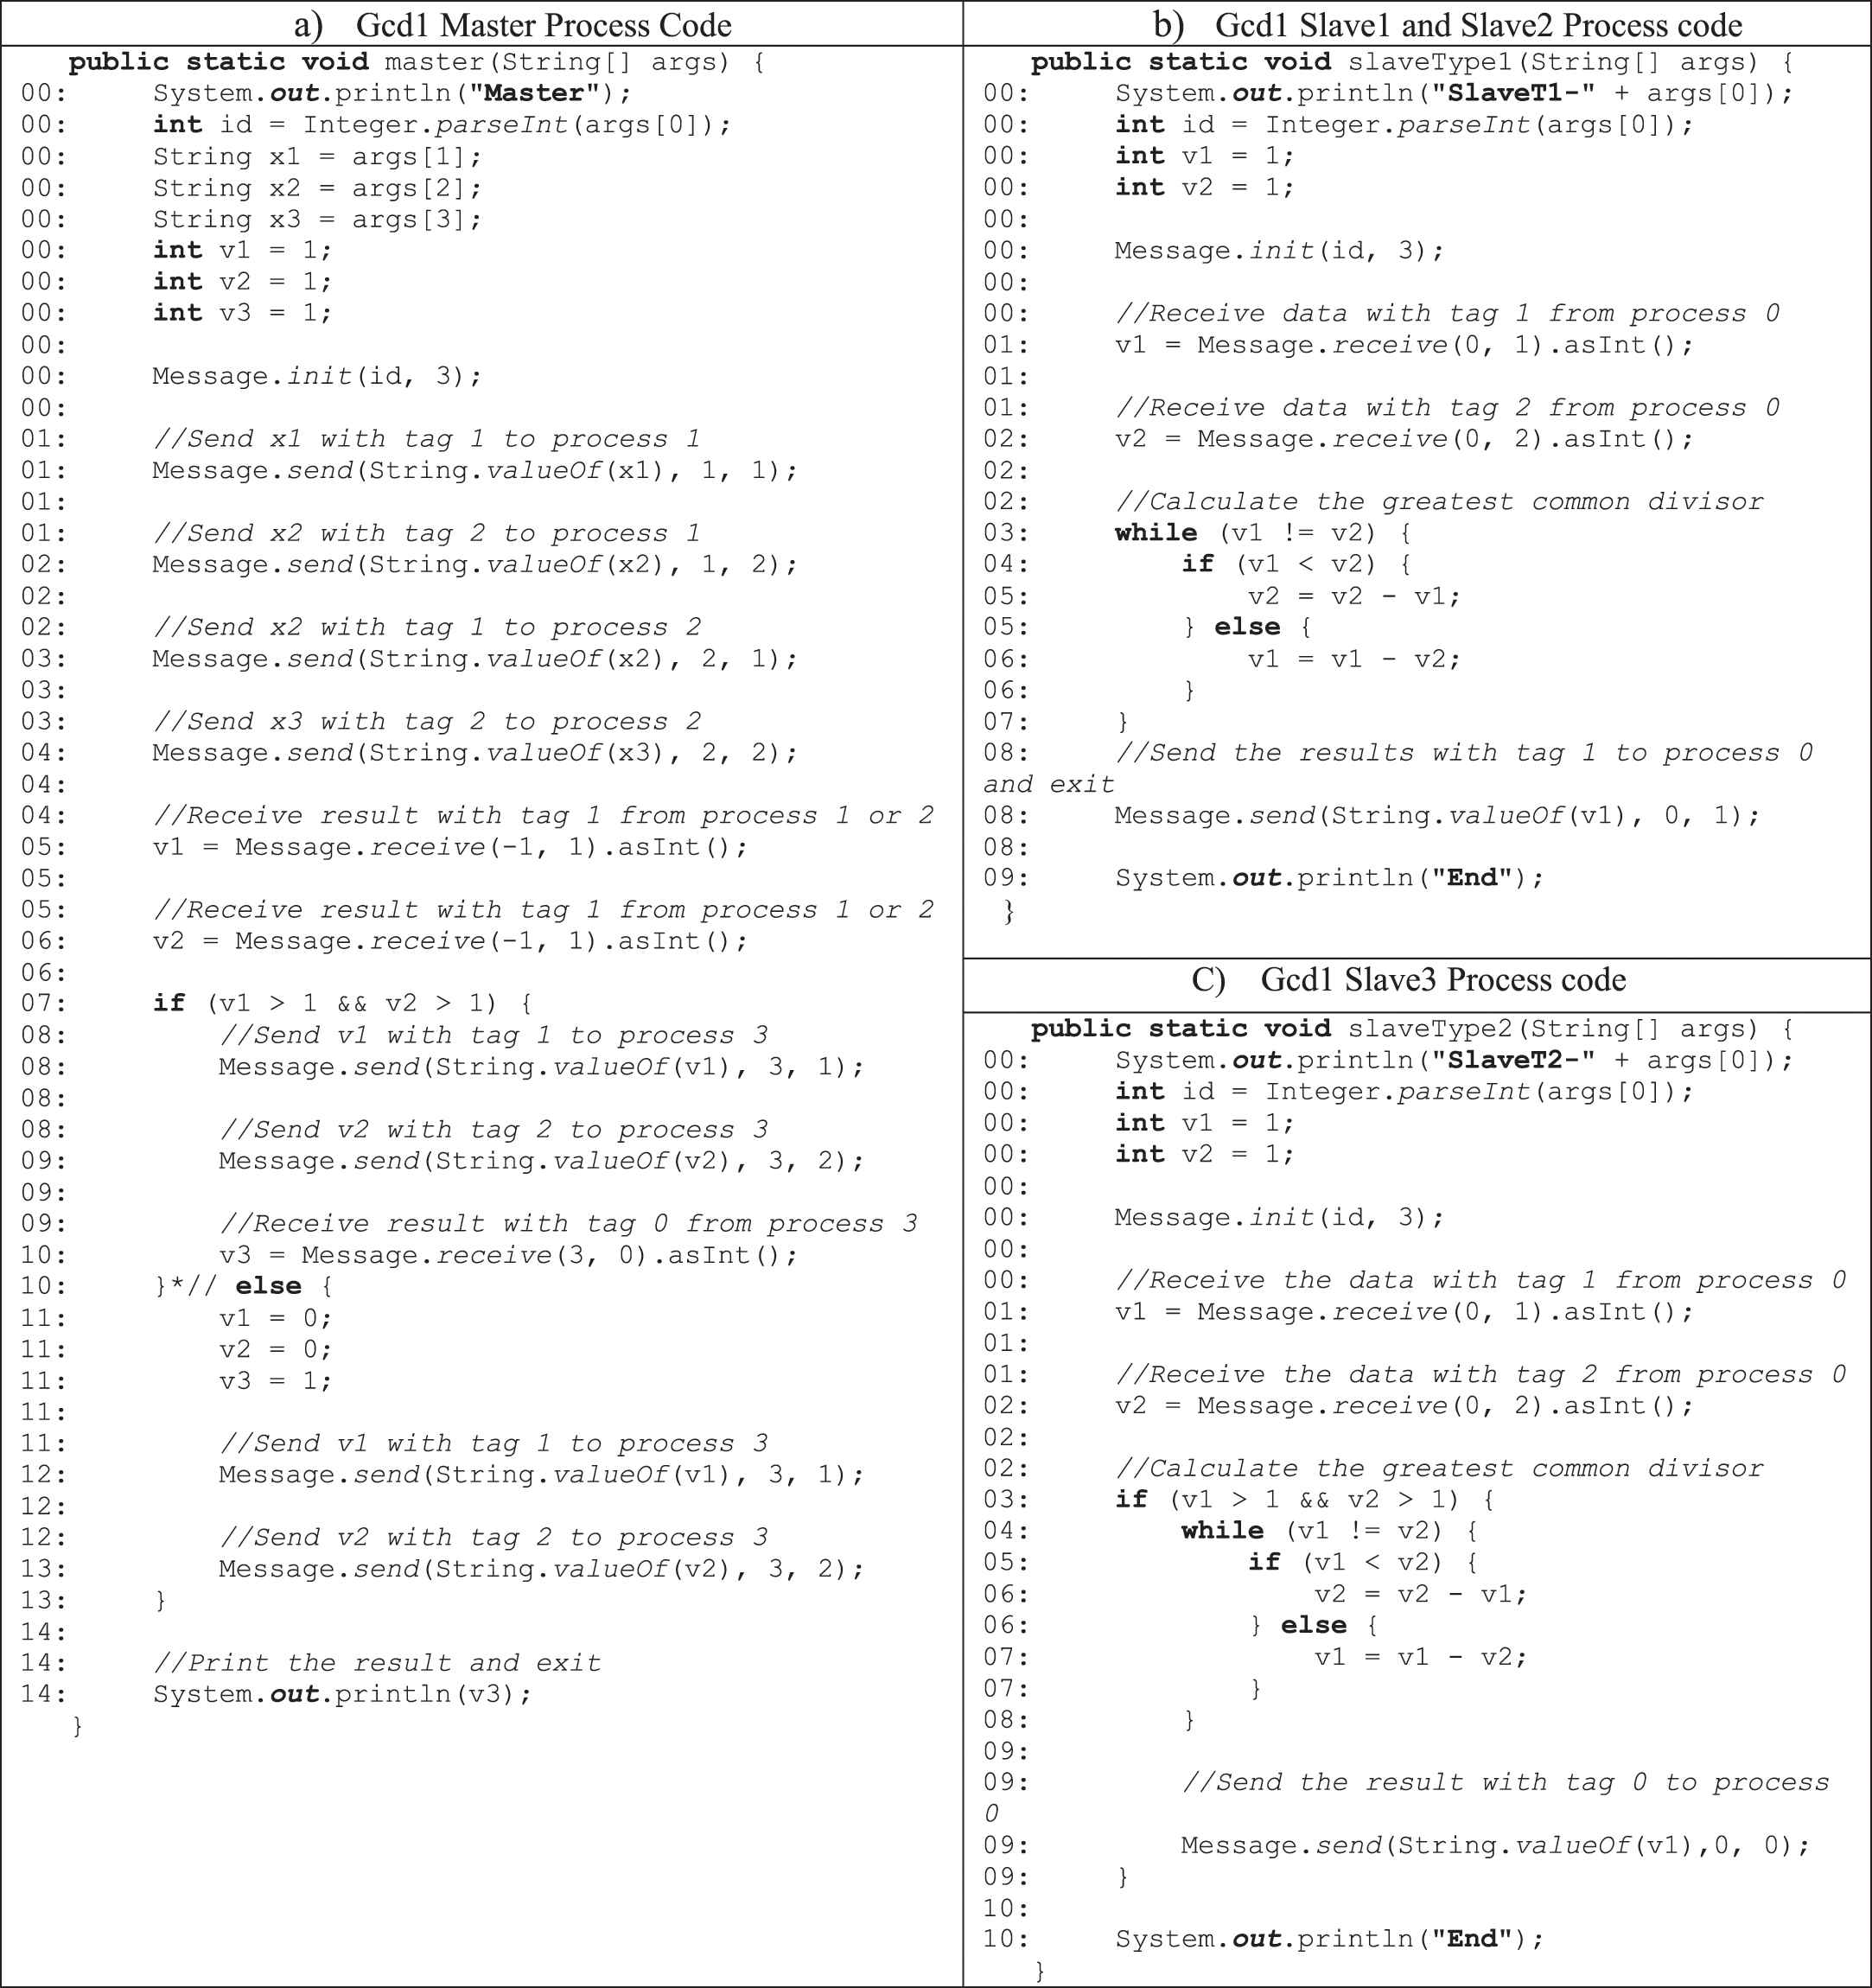
Gcd1 program: (a) master process, (b) slave1 and slave2 processes and (c) slave3 process.
Figure 2 represents the PCFG of Gcd1. A control flow graph is drawn for every process of Gcd1 in PCFG. Each line of the source code is labeled with a number on the left side which represents the related node number in PCFG. Communications between processes are also represented with communication edges. For example, a communication edge (10, 11) is drawn between node 1 from the master process and node 1 from slave process 1.
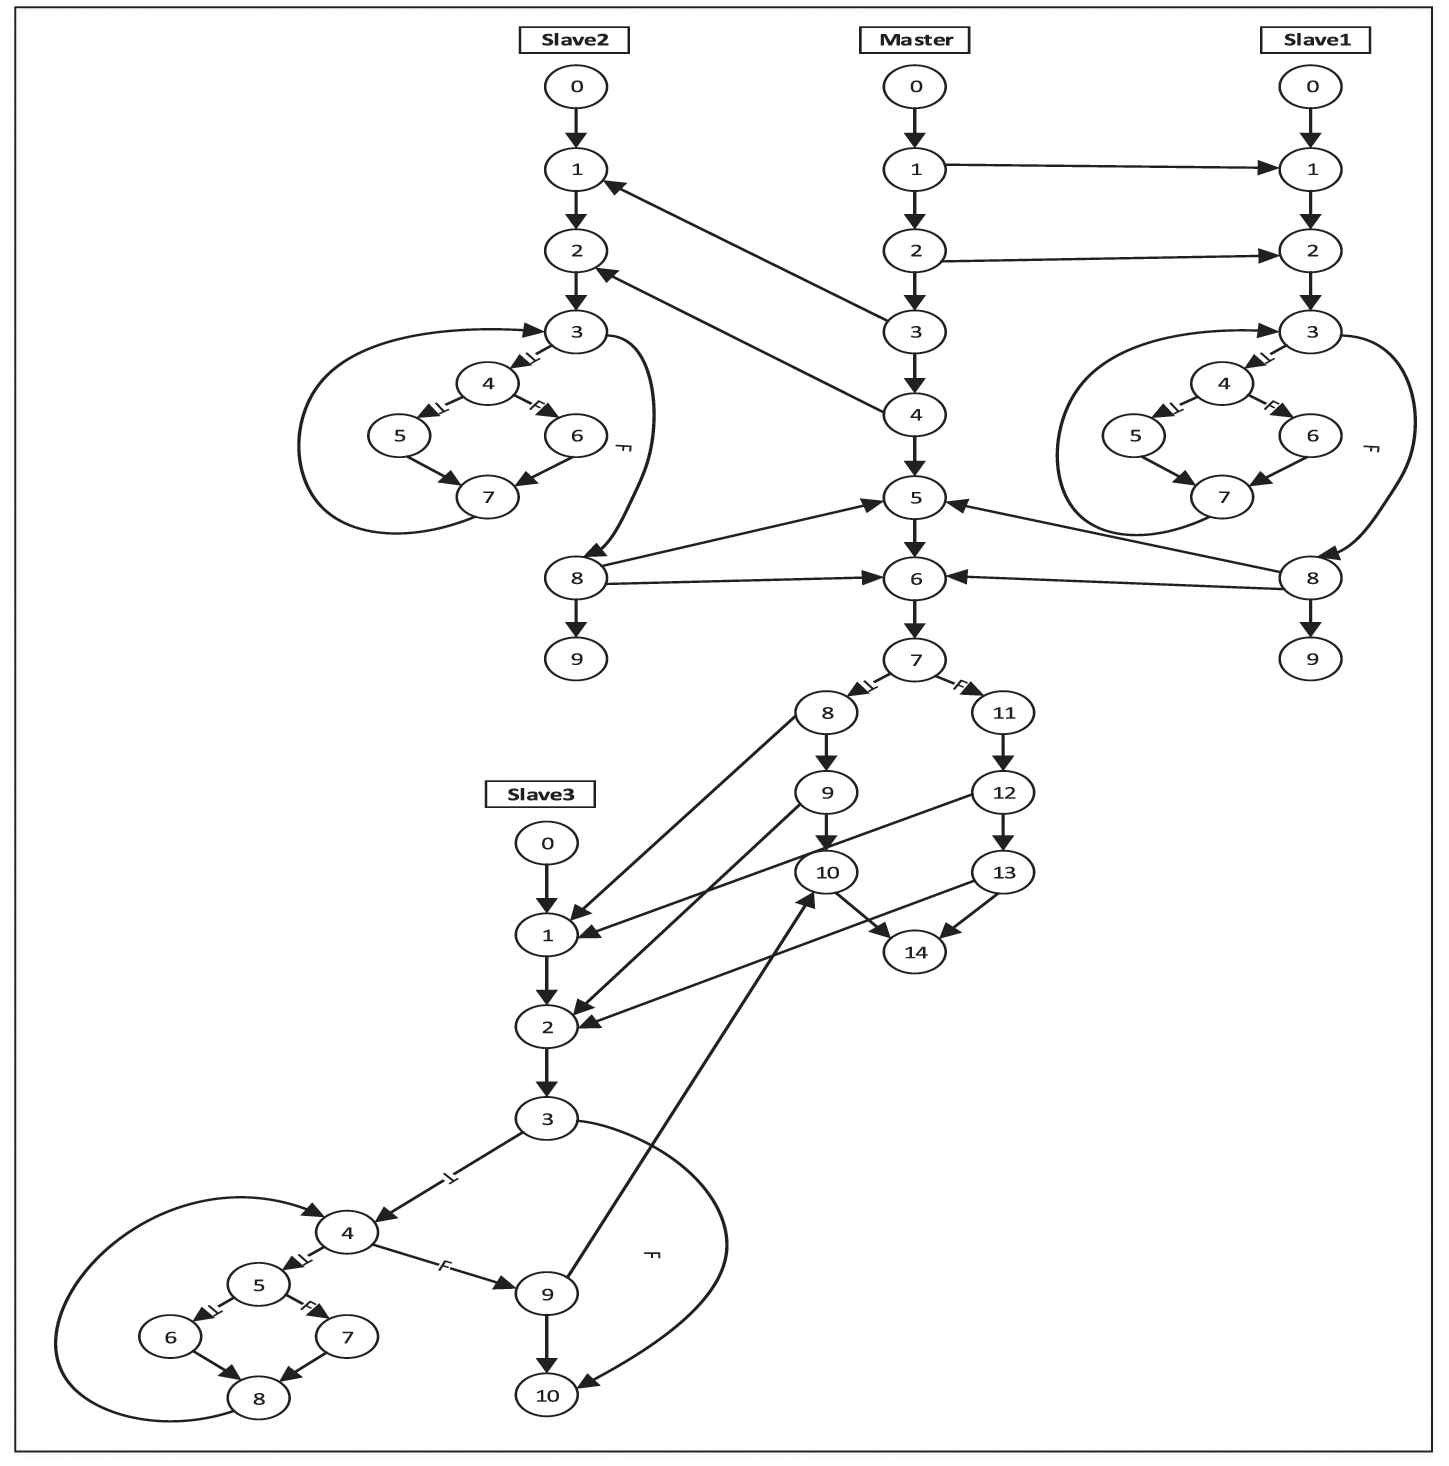
Parallel control flow graph (PCFG) graph for Gcd1.
We have implemented a library of methods in java, which allows communication between different processes in the concurrent program Gcd1 and other benchmark programs used in our experiments. Details on how to implement this library and use the send and receive methods are described in Section 5.2.
Souza et al. [5] have presented two groups of testing criteria for message-passing-based parallel programs. These criteria have been defined with respect to the notion of PCFG. The first category includes testing criteria which are based on control and communication flows. The most important criteria of this group are all-nodes-coverage, all-send-nodes-coverage, all-receive-nodes-coverage, all-edges-coverage and all-communication-edges-coverage. The testing criteria of the second group are based on data and message-passing flows. In this paper, we use a testing criterion from the second group, called “all-def-s-use.” Since the proposed framework considers the message-passing paradigm, the communication related errors are the most possible concurrency errors in the involved processes. The all-def-s-use criterion forces the program to cover the communication edges, and therefore, could be appropriate for detecting this kind of errors.
A definition is a location where a value for a variable is stored into memory (assignment, input commands, etc). So, the receive command in the programs with message-passing capabilities can be considered as a definition of a variable. A use is a location where a variable's value is accessed. The uses can be classified to computational use, predicate use and communication use. The computational use occurs in a computation statement. The predicate use occurs in a predicate statement and the communication use occurs in communication commands. In the all-def-s-use criterion, the objective is to cover all def-use pairs which are also passed from a communication edge in a path from the definition location to the use location. The use in this criterion includes both computational and predicate uses.
Considering the all-def-s-use criterion for Gcd1, 55 test requirements can be defined. As an example of the test requirements, consider variable
2.2. Related Work
Through the years, several methods for generating test data have been proposed. Since the present research is concerned with search-based test data generation, studies based on search-based methods are reviewed here. Most of these methods have been done in respect of sequential programs, and a small number of them have paid attention to concurrent programs. In this section, an overview of related works is presented. In addition, the differences between our work and previous works are described.
Search-based methods for test data generation in sequential programs: Jones et al. [13] and Pargas et al. [14] investigated the use of the GA for automated test data generation, aiming at branch coverage. Pachauri et al. [15] suggested three techniques to enhance the efficiency of test data generation using the GA. The suggested improvements involved presenting a new technique to order the program code branches, for being selected as the coverage goals, transferring a maximum of 10 percent of the desired elements of each generation to the next generation, and storing several generated population's elements for a branch into a generated initial population of the sibling branch. Yang et al. [16] proposed a new search-based method for test data generation, called the regenerate genetic algorithm (RGA). RGA adds a new regeneration strategy to the traditional GA, which enables it to avoid the possible local stagnation.
Tracey et al. [17] proposed a framework to generate test data for branch coverage based on the simulated annealing (SA) algorithm. Windisch et al. [18] selected the branch coverage criterion as the testing objective and used the PSO algorithm for generating test data. Zhu et al. [19] proposed an improved PSO algorithm using adaptive inertia weight, and the results showed that the proposed PSO algorithm had higher efficiency in comparison to GA and the basic PSO. The proposed approach in Jiang et al. [20] reduced the particle swarm evolution equations and got an evolution equation without velocity. This paper also proposed an adaptive adjustment scheme based on inertia weight, which balances search capabilities between global search and local search.
Becerra et al. [21] formulated the test data generation problem as a constraint optimization problem and used the differential evolution (DE) algorithm to solve the problem. This study used the branch coverage criterion. A combination of the symbolic execution method and the artificial bee colony (ABC) algorithm was used for path coverage by Dahiya et al. [22].
Mao et al. [23] used the modified ACO algorithm for automated test data generation. This work was an improvement of their earlier work [24], in which they used the harmony search (HS) algorithm to generate test data satisfying branch coverage. Sharifipour et al. [25] presented a memetic ACO algorithm for structural test data generation. The proposed approach incorporates
In Ghaemi and Arasteh [26], SFLA was proposed to generate test data. In this work, branch coverage was used as the basis of the fitness function to generate effective test data. For comparing the performance of the SFLA-based test data generation method with some other metaheuristic algorithms, seven benchmark programs were used. The results have indicated that the proposed method has certain advantages over other methods based on GA, PSO, ACO and ABC.
Search-based methods for test data generation in concurrent programs: Tian and Gong in [3] presented a modified co-evolutionary GA for test data generation in parallel programs without uncertainty. The proposed algorithm was compared with the standard GA, the co-evolutionary GA and the random method. The results have shown that the proposed algorithm has better performance in terms of success rate (SR), speed and the number of evaluated individuals. A developed version of their work, presented in [27], focuses on the path coverage problem for message-passing interface (MPI) parallel programs with blocking communication. The problem has been formulated as an optimization problem whose decision variables are the program inputs and the execution order of the sending nodes. The proposed method, called NICS_GA, has been evaluated through a series of controlled experiments on five typical programs. The experimental results have shown that the proposed method can generate test data for path coverage, effectively and efficiently.
Tian et al. in [28] have studied the problem of generating test data for message-passing parallel programs with respect to the multiple paths coverage criterion. They have proposed an enhanced set-based evolutionary algorithm to improve the efficiency of test data generation. The algorithm uses information related to the quality of a scheduling sequence during the evolution of a population. The proposed algorithm was applied to nine message-passing parallel programs and was compared with the traditional set-based evolutionary algorithm. The experimental results have shown that the suggested algorithm reduces the number of generations and the required time for test data generation.
In Sun et al. [29], sun et al. focused on the problem of test data generation in MPI programs using the path coverage criterion. To increase the efficiency of the approach, a method for scheduling sequence reduction was suggested. In the proposed method, the program inputs are first sampled by the Latin hypercube sampling method. Then, the program is executed for each sample under each scheduling sequence and all the scheduling sequences are sorted considering the similarities between the paths traversed by these samples and the target one. Finally, a scheduling sequence with the best quality is selected and its feasibility is investigated based on the symbolic execution. This method was applied to seven typical MPI programs and was compared with the random method. The experimental results have indicated that test data can be generated under the selected scheduling sequence with low time consumption and high SR.
To sum up, most of the search-based methods for test data generation have mainly focused on sequential programs and have not taken into account the unique characteristics of concurrent programs. Therefore, they are not suitable for testing concurrent programs.
Application of search-based methods for test data generation in concurrent programs is a new trend. Our search-based approach is specifically proposed for concurrent programs and considers the features such as concurrency, communication and synchronization. In comparison with the previous methods, our approach uses a different test criterion, i.e., all-def-s-use, and considers the failure detection capability as an additional evaluation metric. Furthermore, a new hybrid meta-heuristic algorithm, namely SFLA-VND, is proposed which could be used in our approach as well as other meta-heuristic algorithms.
3. THE PROPOSED FRAMEWORK FOR TEST DATA GENERATION
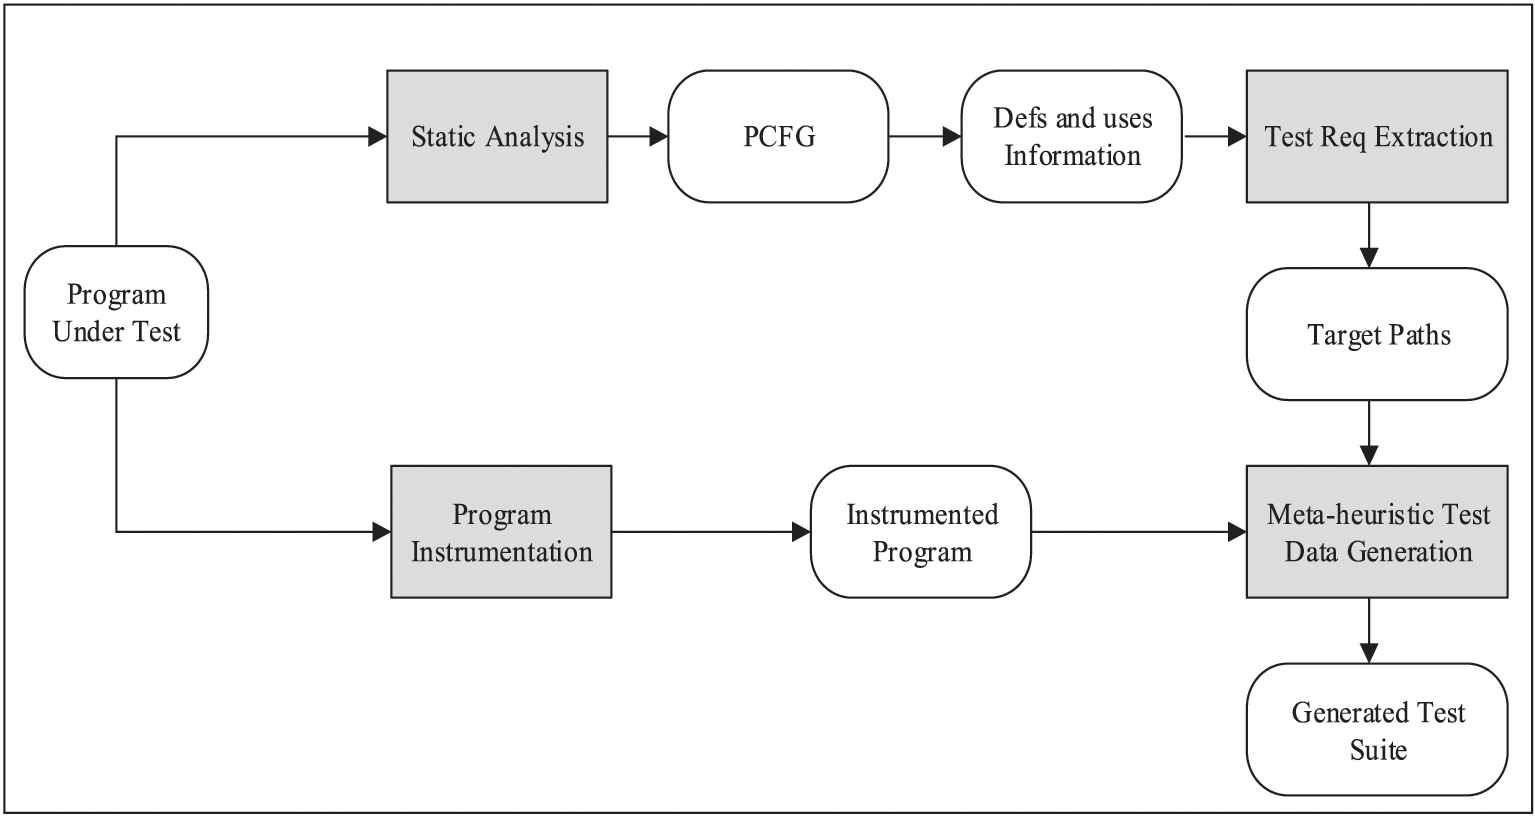
The overall framework is depicted in Figure 3. This framework consists of four main components: program instrumentation, static analysis, test requirements extraction and meta-heuristic test data generation. These components are described in Section 3.1.
The overall framework of the proposed approach.
3.1. The Framework Components
Program Instrumentation: In this component, some codes are added to the program under test in order to obtain the required information from the program execution for a particular input data. This information includes the traversed paths in each process and the used communication edges. The information obtained from the instrumented code will be used in the stage of the meta-heuristic test data generation to compute the input data fitness.
Static Analysis: This component is in charge of generating the PCFG graph of the program under test. In addition, the location of the definitions and uses of the program variables is determined. This information will be used in the next step to extract test requirements.
Test Requirements Extraction: This component is responsible for extracting a list of test requirements to be covered according to the all-def-s-use test criterion. Then, for each of the extracted test requirements, a path is specified in the graph. Each path begins with a node in which a variable is defined, and after passing a communication edge, it ends with a use of that variable in another process. The considered paths are the shortest simple paths (in a simple path, no node appears more than once) between the definition and the use locations of a variable. In programs with loops, simple paths of the Sidetrips type are used [30].
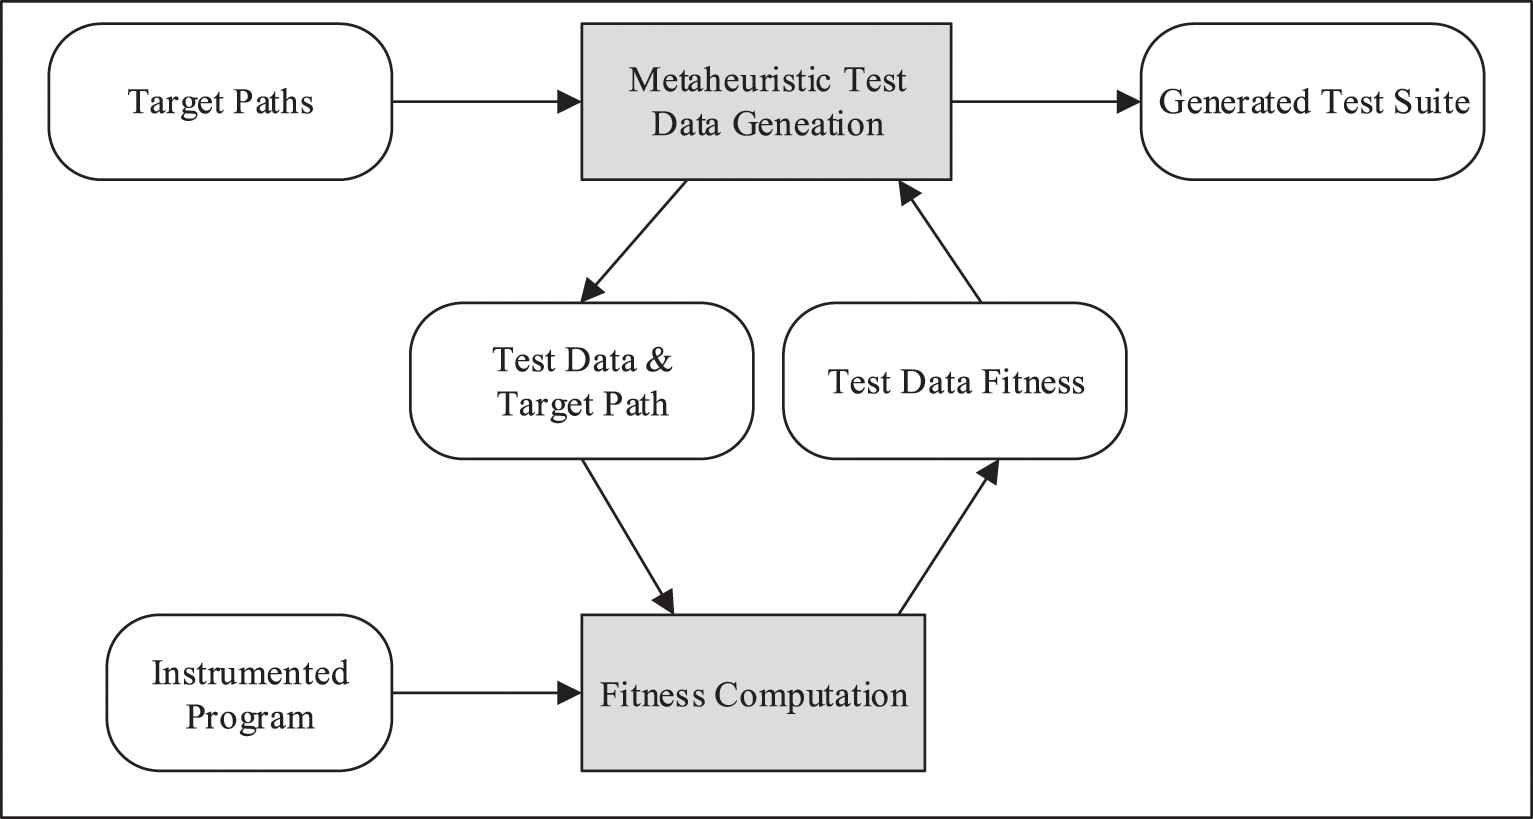
Meta-heuristic Test Data Generation: This is the main component of the framework. It executes repeatedly and, in each repetition, the test data is generated for one of the simple paths generated at the previous step. Figure 4 shows the details of this step schematically. At this stage, a meta-heuristic algorithm will be used to generate test data. In our experiments, four existing meta-heuristic algorithms along with a novel hybrid meta-heuristic algorithm have been used for this purpose.
The flowchart of the test data generation step.
Each meta-heuristic algorithm starts with the generation of a random initial population (or random input data). This population is improved using the meta-heuristic algorithm. During the process of generating test data, whenever it is necessary to calculate the fitness of population elements, this will be done by calling a function called the fitness computation. The fitness function uses the input data of program under test, the target path, and the instrumented program under test as inputs. After executing the instrumented program for the input data, the function measures the fitness of the input data by comparing the executed path with the target path.
3.2. Fitness Function
Fitness function is the most important part of a meta-heuristic algorithm because its quality has a great effect on the algorithm's performance. In this research, Eq. (1) is used to measure the fitness of the input data
This fitness function consists of two parts which are described in the following. To calculate the first part, i.e.,
After executing the program under test with an input data
State 0: No part of the first subpath of the target path is covered.
State 1: A part of the first subpath of the target path is covered.
State 2: The entire first subpath is covered, but no part of the third subpath is covered.
State 3: The entire first subpath and part of the third subpath are covered.
State 4: The first and third subpaths of the target path are fully covered, but the communication edge (the second subpath) is different from the target path.
State 5: The first, second and third subpaths of the target path are fully covered.
The second parameter in the fitness function is the normalized branch distance (NBD). The value of the branch distance is calculated and normalized using Eq. (2). The method presented in [15] is used to calculate the branch distance and the NBD.
The value of the branch distance is calculated by assigning the input values to the variables of the predicate of the critical branch. The critical branch is the first different node in the comparison of the traversed path for a test data with the target path. Table 1 shows how to calculate the branch distance for different types of predicates, where
| No. | Predicate | Branch Distance |
|---|---|---|
| 1 | ||
| 2 | ||
| 3 | ||
| 4 | ||
| 5 | ||
| 6 | ||
| 7 | ||
| 8 | ||
| 9 | ||
| 10 |
The branch distance calculation for different types of predicates.
The first part of the proposed fitness function has a greater effect on the value of this function. This means that, for input data xk and
4. THE HYBRID META-HEURISTIC ALGORITHM
In this section, we introduce a hybrid meta-heuristic algorithm, called SFLA-VND. The SFLA-VND algorithm is a modified version of the SFLA algorithm, in which the VND algorithm is applied as a stage of SFLA. In the following, firstly, the SFLA algorithm is reviewed for better understanding of the proposed hybrid algorithm. Then, we provide a detailed description of the VND and the SFLA-VND algorithms.
SFLA [31,32] is a metaheuristic algorithm in which a set of frogs (or initial solutions) cooperate to find the most significant sources of food which can be considered as global optimum points in optimization problems. In the first stage of this algorithm, the frogs are randomly distributed over the search space. Then, the population is partitioned into smaller communities called memeplexes. A random subset, called a submemeplex, is selected from each memeplex. In each submemeplex, the worst frog tries to get to the location that has the maximum amount of available food by leaping toward the best frog. To ensure the global exploration, the frogs are periodically shuffled and reorganized into new memeplexes. Generation by generation, the algorithm continues until a stop criterion is satisfied.
In the basic SFLA, the memeplex evolution process involves constructing a submemeplex in each memeplex and trying to improve the worst frog inside it. The frogs in a memeplex are selected for creating a submemeplex based on the triangular probability distribution. This type of distribution causes the worse frogs to have a small chance of being present in the submemeplex and being evolved. Therefore, submemeplex creation in the basic SFLA is an ineffective process. In addition, because of trying to improve only the worst frog in each submemeplex, the memeplexes will evolve slowly. Regarding the mentioned reasons, submemeplex construction stage of the basic SFLA is eliminated in the proposed hybrid algorithm. In addition, instead of the evolution of the worst frog in each memeplex, all frogs except the best frog will participate in the evolution process. Meanwhile, similar to the PSO algorithm, the velocity parameter is defined for each frog in addition to the position parameter. Also, the frog jumping is performed considering the position of the best memeplex frog and the best frog of the whole population.
The SFLA-VND algorithm has two new steps that will only be implemented if the algorithm is stuck in local optima. These two steps include performing the local VND search algorithm on the best frog of the population, and the replacement operation. In the replacement step, Rr percentage of the frogs with the least fitness are removed from the population and replaced with random frogs. We call Rr the replacement rate, which is one of the parameters of the proposed algorithm.
The variable neighborhood search (VNS) [33] algorithm is a meta-heuristic algorithm based on the systematic changes of local structures. Due to the advantages of this algorithm, such as a small number of control parameters and high efficiency, it has been successfully used in various combinational optimization problems. In recent years, several types of VNS strategies, such as VNS Basic, Reduced VNS, VND, Skewed VNS and General VNS (GVNS), have been proposed. A comprehensive review of various VNS versions has been presented in [34].
VND has proved its effectiveness in solving many combinatorial problems [35–37]. The main idea of the VND algorithm is to design several neighborhood structures and systematically change neighborhoods when local searches are caught up in local optimums. More precisely, the algorithm starts with an initial solution, and then, follows a cycle of local search and neighborhood change until the termination condition is met. The search process is repeated in each neighborhood until better answers are found. The pseudocode of the VND algorithm is presented in Algorithm 1.
Algorithm 1: Pseudo-code of VND
1 Procedure VND (s, Kmax)
2
3 while
4
5 if
6
7
8 else
9
10 end while
11 return s;
In this algorithm, s is an initial solution and kmax is the number of neighborhood structures.
Figure 5 shows the flowchart of the proposed SFLA-VND algorithm. The algorithm includes 9 steps which are described in the following:
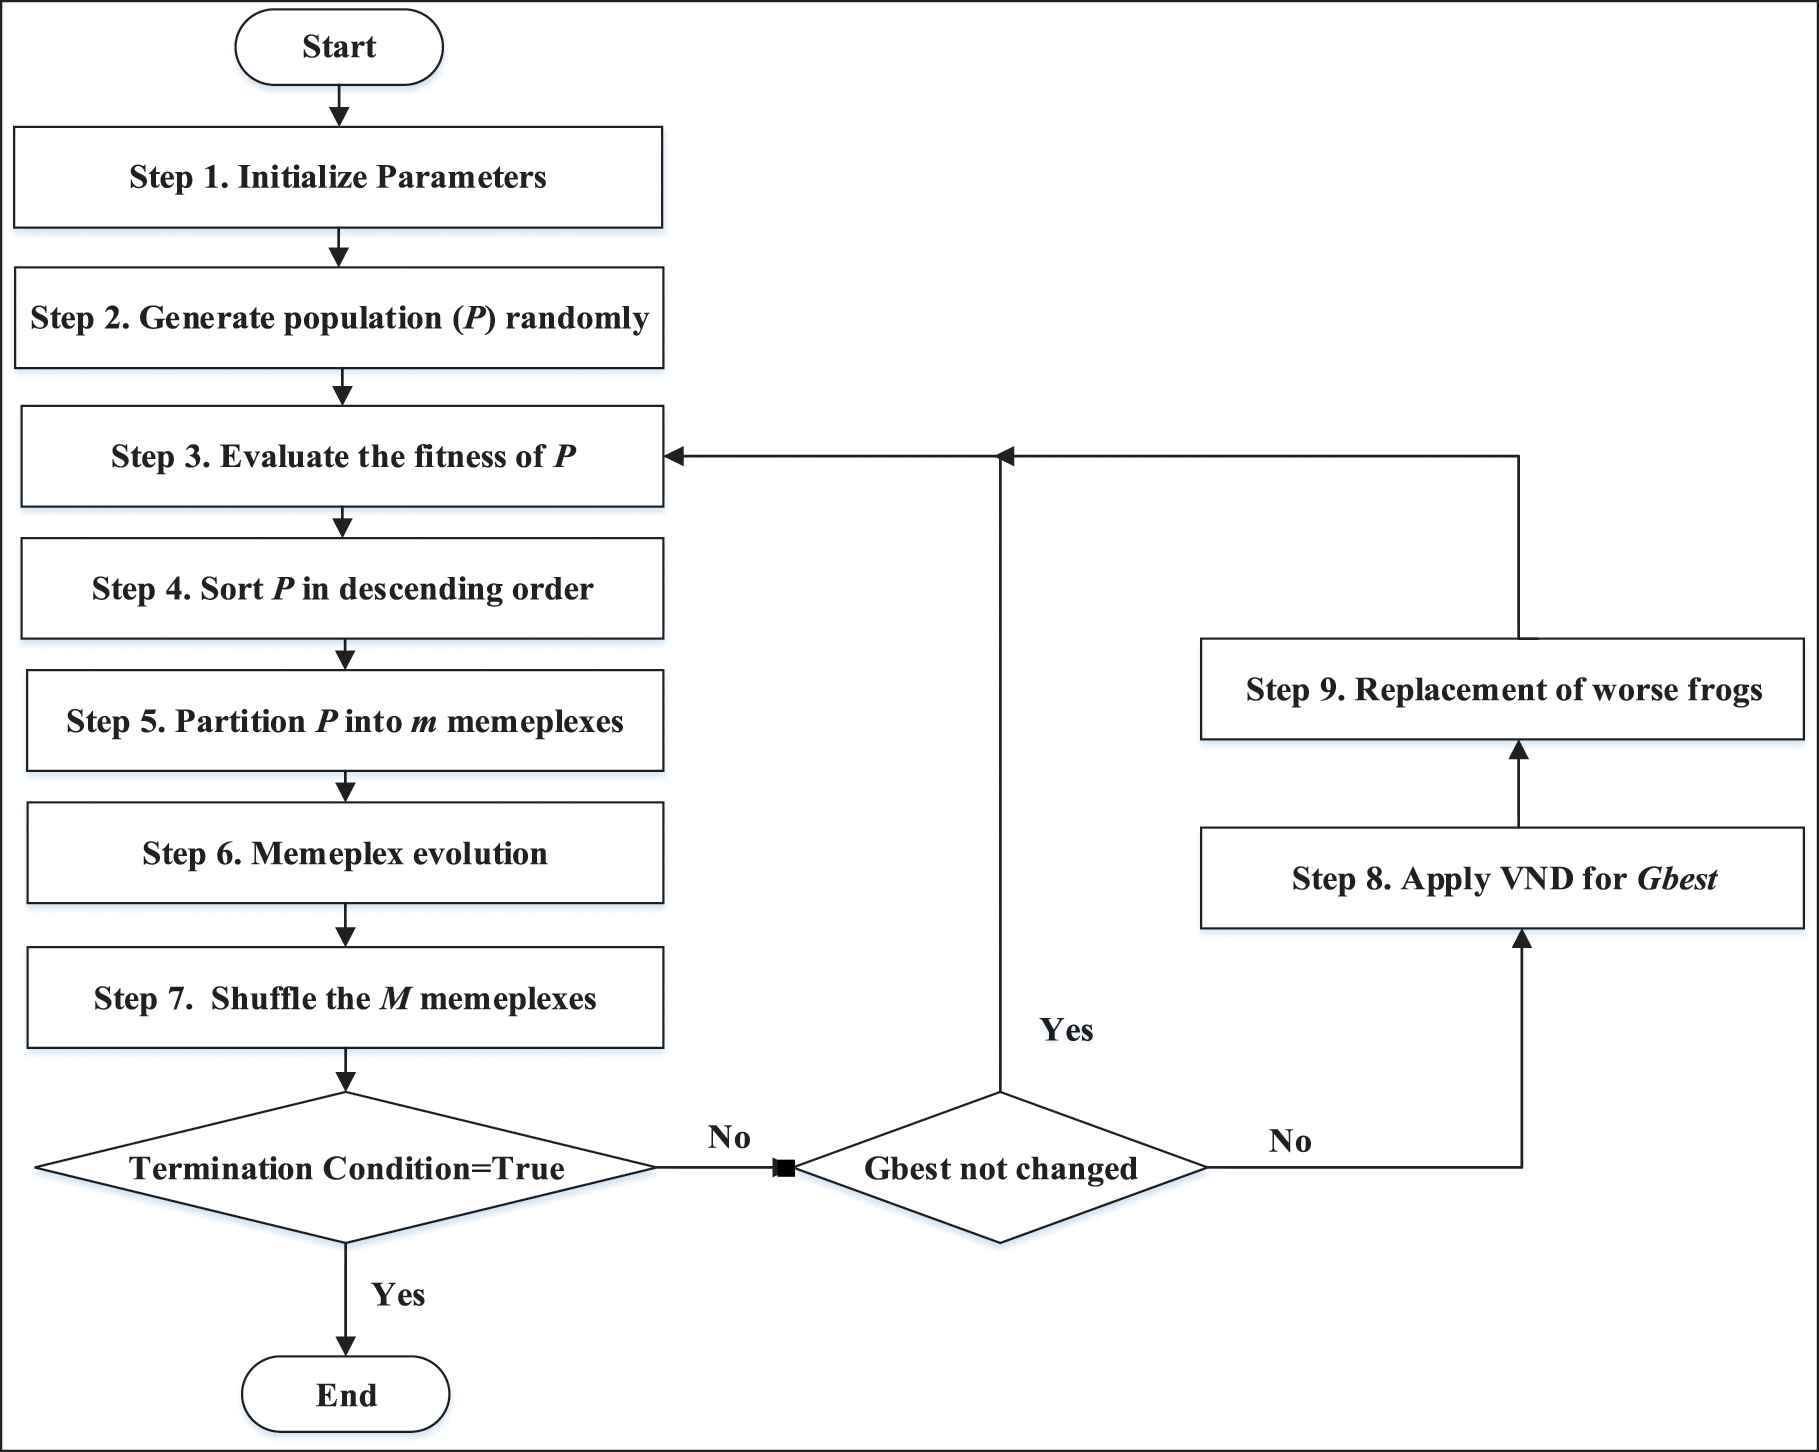
The shuffled frog leaping algorithm_variable neighborhood descent (SFLA_VND) algorithm flowchart.
Step 1: The algorithm parameters are initialized. These parameters include the number of population elements (P), the number of memeplexes (m), the number of frogs in each memeplex (n), the maximum number of algorithm generations (maxGen), the number of evolutions of each memeplex (maxMemGen) and the replacement rate (Rr).
Step 2: This step is to generate a random population of elements. Each of the population elements is called a frog. P frogs with position and velocity components are generated randomly.
Step 3: The fitness of each frog is calculated using the fitness function.
Step 4: The frogs are arranged in the descending order according to their fitness values.
Step 5: The sorted frogs are distributed over memeplexes. This will be done with a mechanism similar to that used in the standard SFLA. So that, The ith frog goes to the (i mod m)th memeplex, such that all the frogs are distributed in all the memeplexes.
Step 6: The goal is the evolution of the frogs in each of the memeplexes. At this iterative step, the frogs in each memeplex jump to the new positions considering the position of the best frog in the memeplex (mbest) and best position found by any frog in the population (gbest). If
Step 7: The frogs in the various memeplexes are shuffled. Then, the termination condition is checked. The termination condition is to reach the maximum number of generations (maxGen), to reach the maximum possible value of the fitness function, or to converge to a certain fitness value. If the fitness value of the best frog be constant for a number (k) of consecutive repetitions, the convergence condition is met. If the termination condition does not meet and the best frog in the last generation is equal to the best value in the previous generation, firstly, the eight and nine steps are done and then the algorithm returns to the third step to rebuild the memeplexes. Otherwise, the algorithm will go straight to the third step. Therefore, the steps eight and nine will only be applied when the algorithm is stuck in the local optima. These steps will be done at maximum k-1 times to mitigate getting stuck in local optima.
Step 8: The VND algorithm is used to search around the best frog. If a better frog is found, it will be considered as the best frog. In the used VND algorithm, three different neighborhood structures are defined. Each of the neighborhoods includes a region in the radius of rmax around the best frog, where the rmax value increases from the first to the third neighborhoods. Suppose that the variable Xi is the best frog represented by a vector of input variables of the program under test. Also,
Step 9: In this step, Rr percent of the frog population with the least amount of fitness is removed from the population and replaced with new random frogs. In simple optimization problems, which their optimal solution is usually found in the first few generations of the algorithm, there will be no need to conduct steps eight and nine. These steps will only be applied when the algorithm is caught up in the local optima.
5. EVALUATION
In order to evaluate the proposed framework for generating test data, it has been implemented by applying five meta-heuristic algorithms, GA, ACO, PSO, SFLA and SFLA-VND, on five concurrent benchmark programs. The results of these meta-heuristic algorithms are presented and compared in this section. In Section 5.1, the evaluation criteria are introduced. In Section 5.2, details of the used benchmark programs and the configurations of the meta-heuristic algorithms are presented. Also, in this section, we show the results of the sensitivity analysis performed in order to find the optimal values for the parameters of SFLA-VND. The results of the experiments and the statistical analysis are presented in Section 5.3. Finally, Section 5.4 evaluates the failure detection capability of the proposed framework.
5.1. Evaluation Metrics
To evaluate the proposed method, two criteria are used: one for the effectiveness of the generated test data and another one for the efficiency of the test data generation method. The effectiveness criterion is measured by the average coverage (AC) and the SR metrics. The efficiency criterion is measured by the average time (AT) and the average number of the fitness evaluations (FEs) metrics. The mentioned metrics are introduced as follows:
Average Coverage: The average number of the test requirements covered by the algorithm in 100 runs.
Success Rate: The probability of covering all test requirements by test data. The value of this metric is the ratio of the number of executions capable for covering all test requirements to the number of all executions.
Average Time: Average runtime of the algorithm.
Average number of FEs: The average number of fitness function calls in all executions of the algorithm.
5.2. Experiment Setup
We use five concurrent benchmark programs for evaluating the proposed method. Table 2 shows the characteristics of the benchmark programs used in the experiments. In the first column of this table, the name of the benchmark program is given. The columns 2 to 5 represent the number of inputs, program processes, send commands and receive commands in each of the programs, respectively. In the sixth column, a brief description of the functionality of each program is presented.
| Programs | #Arg | Processes | Sends | Receives | Description |
|---|---|---|---|---|---|
| Gcd1 [38] | 3 | 4 | 13 | 13 | Calculates the greatest common divisor of 3 integers |
| Gcd2 [38] | 4 | 7 | 18 | 18 | Calculates the greatest common divisor of 4 integers |
| Index [1] | 16 | 4 | 9 | 9 | Searches an input character in a given string |
| Matrix [1] | 3 | 9 | 6 | 6 | Multiplies two input matrices |
| SkaMPI1 [39] | 30 | 2 | 20 | 20 | A tool for the design of performance-portable message-passing interface (MPI) programs |
The benchmark programs used for experimental analysis.
To communicate the processes in the benchmark programs, we have added a library of methods to Java in order to exchange messages. The facilities of this library are similar to MPI and PVM. To implement the library, the data exchange capabilities of the existing datagram socket in Java have been used. The library includes the send and receive methods. The send method consists of three input parameters. Theses parameters are the variable name, the destination process number and a data tag. The receive method has two input parameters. The first parameter is the receiver ID and the second parameter is the data tag. In fact, the receive method receives a data from a specific sender with a specific tag. If the receiver ID in the receive method is equal to −1, the send data from each sender will be allowed and it will be received. Also, if the data tag in the receive method is equal to −1, the send data will be admitted with any tag. In fact, the program supports uncertainties with placing one or both parameters of the receive method equal to −1. For example, as shown in Figure 2, the non-deterministic receive method is used in nodes 5 and 6 of the master process. Also, the send method used in the benchmark programs of this paper are from non-blocking type. It means that after sending data by the send command, the next command is immediately executed without waiting to receive data by the receiver.
Since the parameters of each meta-heuristic algorithm should be adjusted precisely for desired performance of the algorithm, we used the best values reported in the past works for the parameters of GA, ACO, PSO and SFLA. However, the optimal values for the parameters of the SFLA-VND algorithm have been derived from the sensitivity analysis. Sensitivity analysis is one of the methods which is used to determine the optimal values of the parameters. In this method, the effect of each parameter on the system performance is investigated. The SFLA-VND algorithm has several parameters. In this section, we report the results of performing sensitivity analysis on four important parameters of this algorithm. These parameters are the number of memeplexes (m), the number of frogs in each memeplex (n), the number of evolutions per sample (N) and the replacement rate (Rr).
To perform the sensitivity analysis, only the AC and the AT were considered. In other words, the SR and the average number of FEs were ignored because of their behavioral similarities to the AC and AT metrics.
By examining the values of the AC and AT, it was found that when the number of elements of the population exceeds 20, there is not much change in the AC value; however, the AT value increases. For this reason, the values of m and n were chosen so that their multiplication was close to 20. Among the different values considered for parameters m and n, the highest AC and the lowest AT were obtained in the case where
To evaluate the effect of variations in parameter N, the values of three other parameters were considered constant and the results for different values of N were obtained. The parameters were considered as
As stated in Section 4, if the fitness value of the best frog remains constant for k consecutive iterations, the convergence condition is met. We have considered two different values 5 and 10 for k and investigated the impact of these values on experiment results. In experiments with
The parameters of the meta-heuristic algorithms used in the experiment are given in Table 3. The population size in the SFLA-VND algorithm, equal to 24 was obtained from multiplication of the memeplexes number and the memeplex size. For fairly comparison of the meta-heuristic algorithms, the obtained population size is considered for all algorithms, too. Also, the number of iterations was considered to be 100 in all algorithms.
| Algorithm | Parameter | Value |
|---|---|---|
| PSO | w: Inertia weight | 0.6 |
| c1: Cognitive parameter | 2.05 | |
| c2: Scaling parameter | 2.05 | |
| GA | Tournament size | 2 |
| Crossover probability | 0.9 | |
| Mutation probability | 0.05 | |
| ACO [40] | K (archive size) | 60 |
| Q (Locality of search process) | 0.5 | |
| Zita (Speed of convergance) | 0.85 | |
| SFLA | Number of memeplexes | 3 |
| Memeplex size | 8 | |
| Number of memeplex evolutions in each iteration | 10 | |
| Submemeplex size | 60 percentage of memeplex size | |
| Maxstep | 0.2 | |
| SFLA-VND | Number of semeplexes | 3 |
| Memeplex size | 8 | |
| Number of memeplex evolutions in each iteration | 10 | |
| w: Inertia weight | 0.6 | |
| c1: Cognitive parameter | 2.05 | |
| c2: Scaling parameter | 2.05 |
The parameter settings of five meta-heuristic algorithms
5.3. Experimental Results and Discussion
In Tables 4 and 5, the algorithms are compared based on the average value obtained for the four evaluation metrics. In order to draw conclusions in much higher confidence, the ANOVA test was conducted on two metrics of the AC and AT. For each of these two metrics, the results of the SFLA-VND algorithm are compared with the other four meta-heuristic algorithms in terms of the mean difference and obtained p-value. The p-value is used to determine the significance of the mean difference between the results of the two compared algorithms at the 0.05 level. If the p-value is less than 0.05, it shows the significant difference and superiority of one of the algorithms. However, if this value is greater than 0.05, it can be concluded that the mean of the results of the two algorithms don't have a significant difference at the level of 0.05 and the algorithms have comparable performance.
| Average Coverage(%) |
Success Rate(%) |
|||||||||
|---|---|---|---|---|---|---|---|---|---|---|
| Program | GA | ACO | PSO | SFLA | SFLA-VND | GA | ACO | PSO | SFLA | SFLA-VND |
| Gcd1 | 100 | 100 | 99.97 | 99.97 | 100 | 100 | 100 | 98 | 98 | 100 |
| Gcd2 | 100 | 100 | 100 | 100 | 100 | 100 | 100 | 100 | 100 | 100 |
| Index | 95.85 | 99.85 | 99.7 | 100 | 100 | 46 | 92 | 86 | 100 | 100 |
| Matrix | 99.53 | 100 | 100 | 100 | 100 | 96 | 100 | 100 | 100 | 100 |
| SKaMPI1 | 98.04 | 99.81 | 99.77 | 99.91 | 99.95 | 58 | 84 | 80 | 92 | 96 |
Comparative analysis on the metrics average coverage and success rate.
| Average Time |
Average Fitness Function Evaluation |
|||||||||
|---|---|---|---|---|---|---|---|---|---|---|
| Program | GA | ACO | PSO | SFLA | SFLA-VND | GA | ACO | PSO | SFLA | SFLA-VND |
| Gcd1 | 82.01 | 68.86 | 59.97 | 59.31 | 53.29 | 129.36 | 98.22 | 89.76 | 90.24 | 81.92 |
| Gcd2 | 53.40 | 27.83 | 33.17 | 25.80 | 23.75 | 74.04 | 40.56 | 48.00 | 36.90 | 34.64 |
| Index | 6748 | 878.1 | 954.7 | 941.2 | 936.3 | 1342.4 | 141.3 | 174.7 | 196.7 | 190.3 |
| Matrix | 363.7 | 121.47 | 137.35 | 117.05 | 102.35 | 151.04 | 46.98 | 56.16 | 48.00 | 43.14 |
| SKaMPI1 | 2481.3 | 976.70 | 986.91 | 968.37 | 954.37 | 532 | 199 | 203 | 198 | 192 |
Comparative analysis on the metrics average time and the number of average fitness evaluations.
According to Table 4, it can be seen that the SFLA-VND algorithm has the highest AC and SR. However, the results of the compared algorithms are close to each other. For Gcd2, the results of all the algorithms with respect to the two mentioned metrics are the same. This is because the complexity of the Gcd2 program is low so that all meta-heuristic algorithms are able to cover all its test requirements. For SKaMPI1 which is the largest and most complex program among benchmarks, the SFLA-VND algorithm performs better than the other algorithms. This indicates that the use of VND in our hybrid algorithm is effective in avoiding it to get stock in local optima.
Table 6 shows the results of the ANOVA test on the AC metric. It is determined that the AC of the SFLA-VND algorithm is always greater than or equal to this metric for other algorithms. As shown in Table 6, there is no noticeable difference between the mean of different algorithms except for the two cases Index and SKaMPI1 which the SFLA-VND algorithm performs better than the GA.
| SFLA-VND(x) vs SFLA(y) |
SFLA-VND(x) vs PSO(z) |
SFLA-VND(x) vs ACO(w) |
SFLA-VND(x) vs GA(q) |
|||||
|---|---|---|---|---|---|---|---|---|
| Benchmark | (x-y)% | p-value | (x-z)% | p-value | (x-w)% | p-value | (x-q)% | p-value |
| Gcd1 | 0.345 | 0.265 | 0.345 | 0.265 | 0 | 1 | 0 | 1 |
| Gcd2 | 0 | 1 | 0 | 1 | 0 | 1 | 0 | 1 |
| Index | 0 | 1 | 0.26 | 0.479 | 0.148 | 0.686 | 4.148 | 2.99E-24 |
| Matrix | 0 | 1 | 0 | 1 | 0 | 1 | 0.47 | 0.25 |
| SKaMPI1 | 0.046 | 1 | 0.186 | 0.913 | 0.139 | 0.968 | 1.907 | 4.34E-13 |
The ANOVA test on the average coverage results at the 0.05 significant level.
The comparative analysis of the AT and the average number of FEs is presented in Table 5. The results show that with respect to both metrics, SFLA-VND outperformed the other algorithms for all benchmarks except the Index benchmark. It can be concluded that eliminating the process of composing submemplexes has resulted in a faster algorithm. In addition, the proposed mechanism for the evolution of memeplexes with the participation of all its frogs has been effective and has increased the convergence speed.
For the Index benchmark, ACO showed the best metrics values. However, for this benchmark, ACO has not been able to cover all the test requirements, while SFLA-VND has done so. Thus, the lower value of AT in ACO is probably because of the algorithm convergence to a nonoptimal value. SFLA-VND has been able to escape local optima by applying the VND algorithm and the replacement operator in the eight and nine steps.
The results of the ANOVA test on the AT values are presented in Table 7. These results show that for all benchmarks, the AT of the SFLA-VND algorithm is less in comparison to the SFLA algorithm. However, the difference isn't remarkable. Also, SFLA-VND has better results than the PSO algorithm. But, their difference is only significant for Gcd2. Comparison of the results for SFLA-VND and ACO shows that the hybrid algorithm has better AT values in four benchmarks, whereas the difference is only significant for Gcd2. In one benchmark, i.e., Index, which the ACO algorithm has better value, the superiority is not significant. The AT of SFLA-VND is always lower than that of GA for all benchmarks, and the difference is significant. In other words, SFLA-VND has considerable superiority than GA.
| SFLA-VND(x) vs SFLA(y) |
SFLA-VND(x) vs PSO(z) |
SFLA-VND(x) vs ACO(w) |
SFLA-VND(x) vs GA(q) |
|||||
|---|---|---|---|---|---|---|---|---|
| Benchmark | (x-y)% | p-value | (x-z)% | p-value | (x-w)% | p-value | (x-q)% | p-value |
| Gcd1 | −6.02 | 0.356 | −6.675 | 0.306 | −15.569 | 0.017 | −28.718 | 1.53E-05 |
| Gcd2 | −2.048 | 0.238 | −9.416 | 1.28E-07 | −4.083 | 0.019 | −29.6653 | 8.54E-44 |
| Index | −4.916 | 0.985 | −18.432 | 0.944 | 57.615 | 0.828 | −5812.069 | 6.22E-60 |
| Matrix | −14.702 | 0.628 | −35.003 | 0.249 | −19.126 | 0.528 | −261.386 | 7.95E-16 |
| SKaMPI1 | −14 | 1 | −32.541 | 0.999 | −22.333 | 1 | −1526.9 | 4.31E-13 |
The ANOVA test on the average time results at the 0.05 significant level.
The Boxplot chart shown in Figure 6 is used to study and compare the distribution of the AT of different algorithms. It can be seen from the graph that for the two benchmarks Gcd1 and Gcd2, the values of the first, middle and third quartiles of SFLA-VND are less in comparison to the other compared algorithms. Regarding the Index benchmark, except for the GA, the distribution of four other algorithms is approximately the same. For SFLA-VND, the values of the first, middle and third quartiles are almost equal with respect to the Matrix benchmark. The values of these three quartiles in SFLA-VND are less than the corresponding values in the other algorithms. Also, the distribution of the ACO and PSO algorithms is similar to that of the SFLA-VND algorithm.
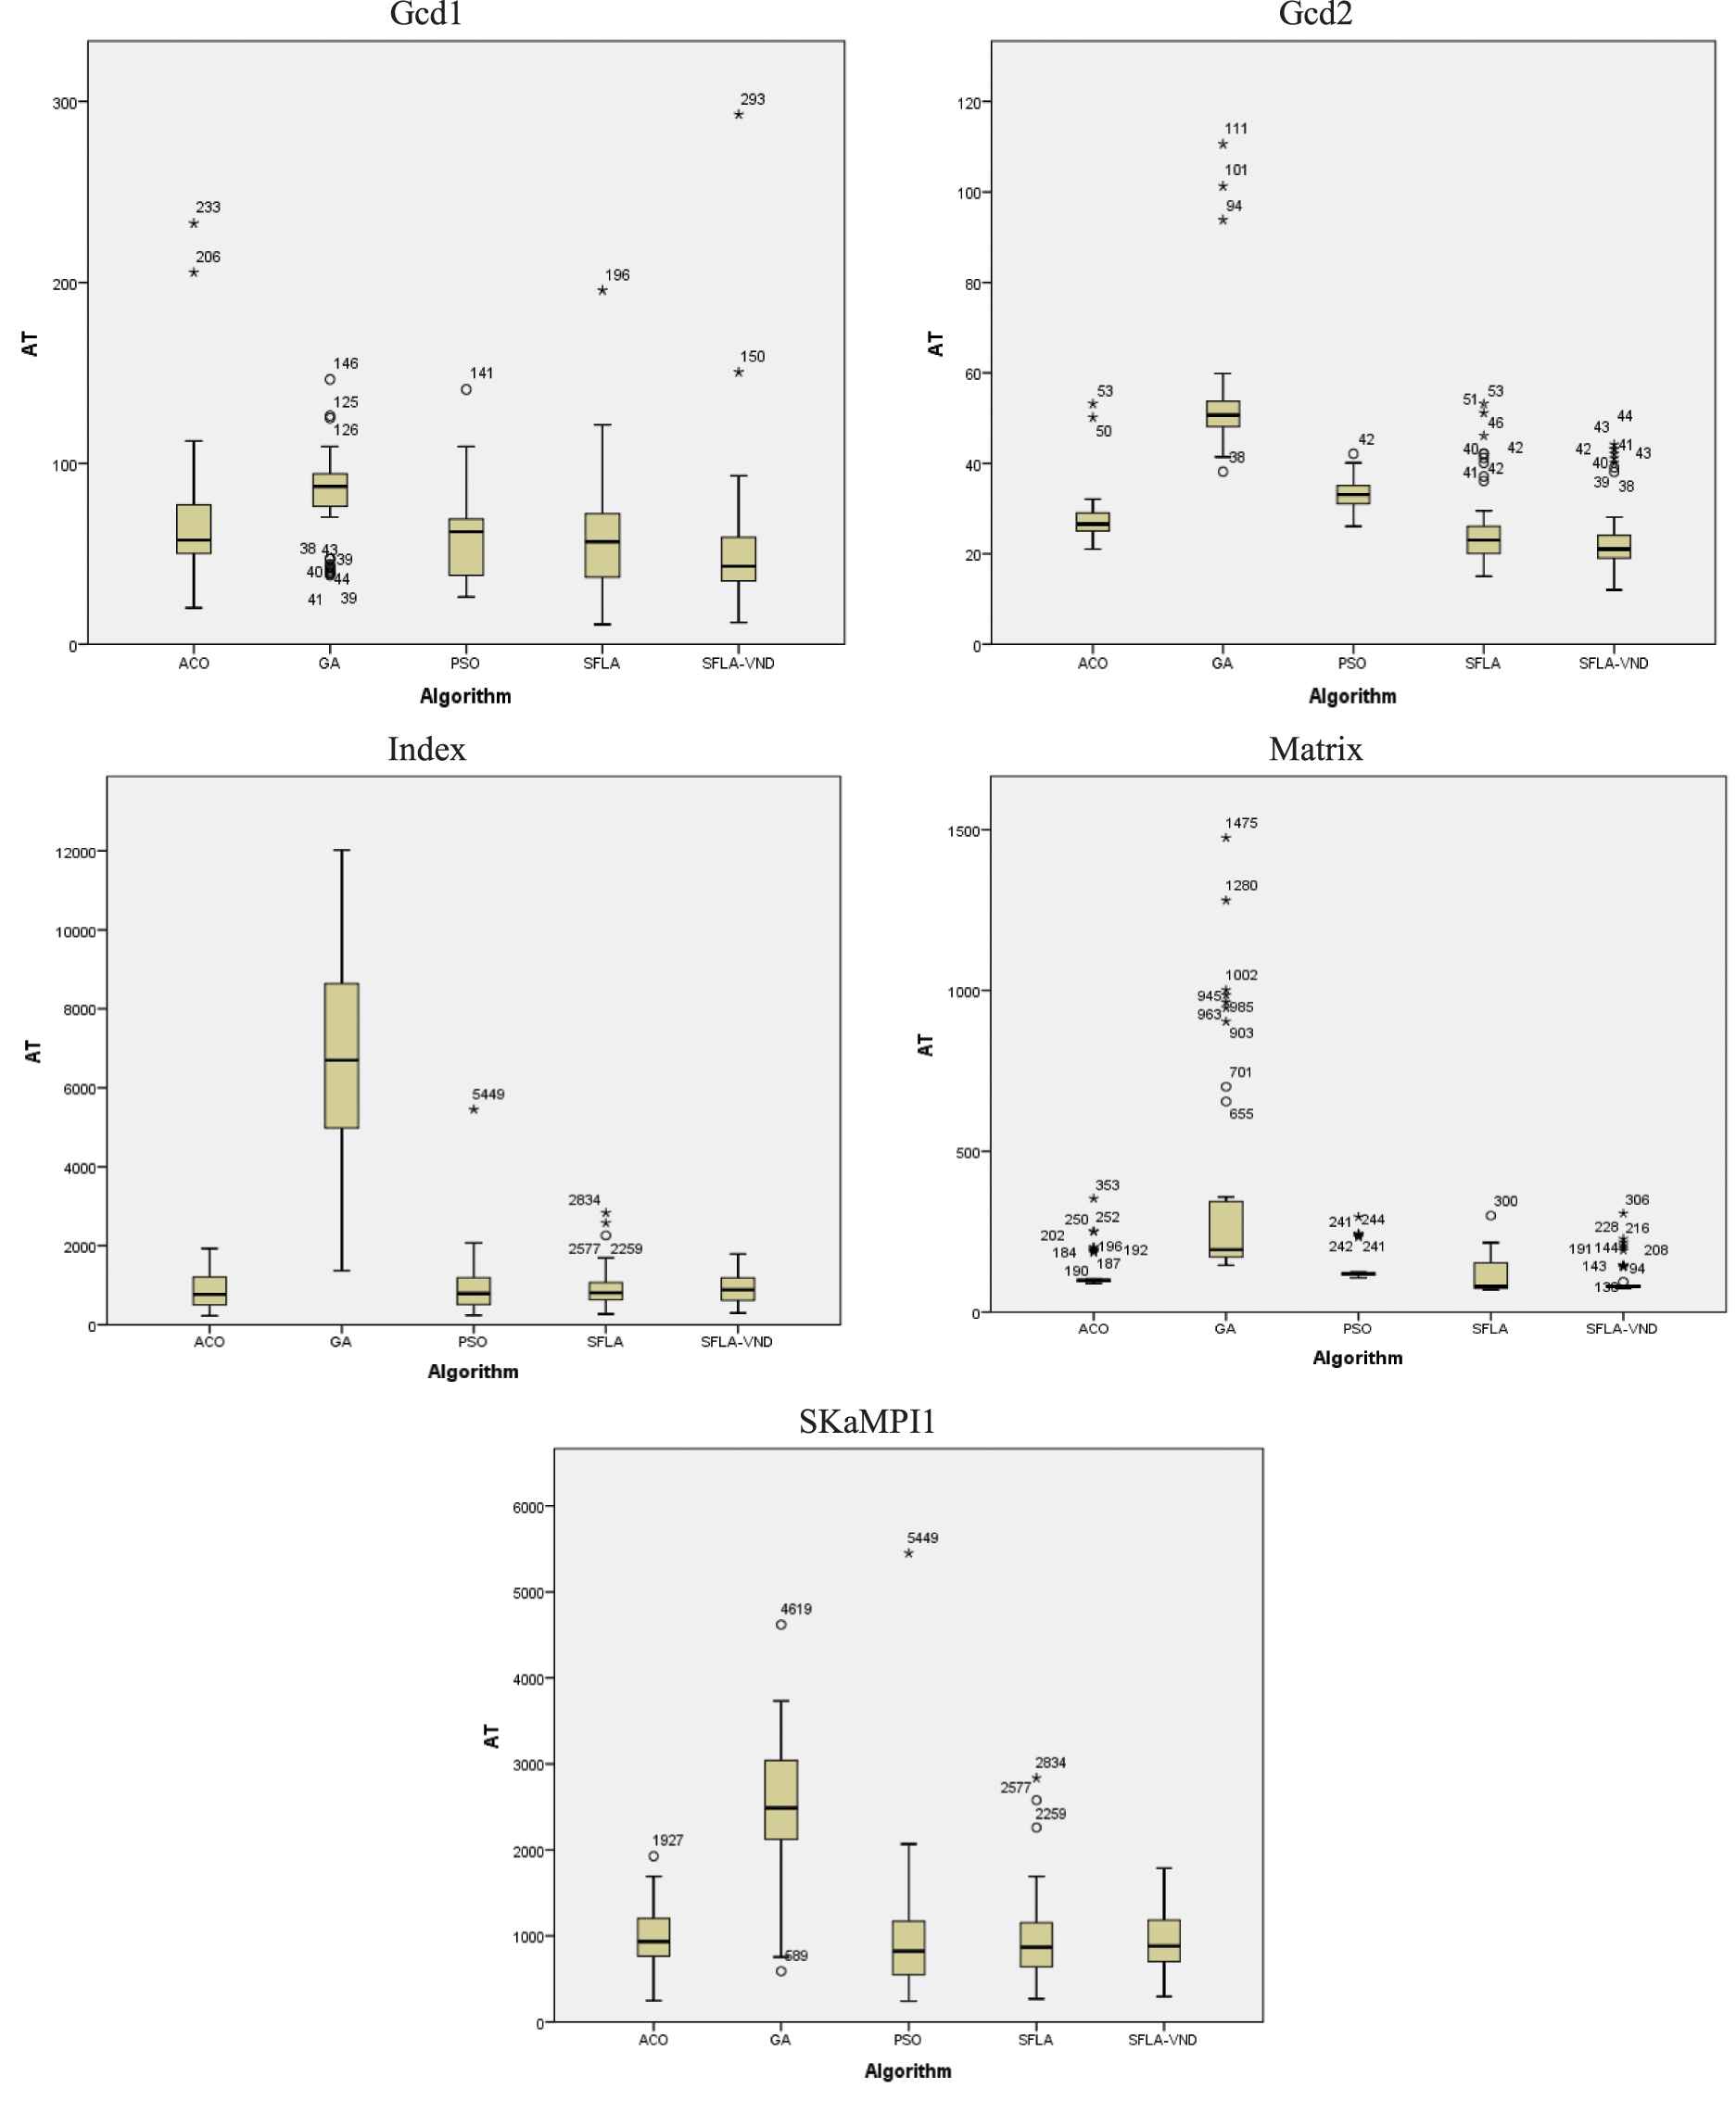
Boxplots for the average time (AT) metric.
According to the experimental results, SFLA-VND has shown higher efficiency for larger and more complex programs, i.e., Index and SKaMPI1. To further analyze the differences between the compared algorithms even for the current rather small benchmark programs, we conducted another experiment.
In this experiment, we found the value of the AC obtained by each competitive algorithm exactly when the SFLA-VND algorithm reached the highest level of coverage. For example, if SFLA-VND reached the AC of 100 and ended after 10 iterations for a program, the AC for the rest of the algorithms was calculated after 10 iterations for the same program. The results of this experiment is shown in Table 8.
| Average Coverage (%) |
|||||
|---|---|---|---|---|---|
| Program | GA | ACO | PSO | SFLA | SFLA-VND |
| Gcd1 | 65.17 | 73.41 | 82.73 | 84.34 | 100 |
| Gcd2 | 45.43 | 83.17 | 70.62 | 89.15 | 100 |
| Index | 33.24 | 99.85 | 95.72 | 96.41 | 100 |
| Matrix | 44.37 | 80.20 | 73.63 | 85.45 | 100 |
| SKaMPI1 | 42.79 | 95.71 | 94.92 | 96.38 | 99.95 |
Algorithms comparison in fixed iteration.
5.4. Evaluation of the Failure Detection Capability
To evaluate the capability of the proposed method for identifying program failures, some faults have been introduced in three benchmark programs, Gcd1, Index and Matrix, and the ability of the proposed method to detect resulting failures has been measured. In this regard, our method is compared with SFLA_Seq [26] and NICS_GA [27] as two search-based methods which have already been used for test data generation in sequential and concurrent programs, respectively. These methods were briefly described in Section 2.2.
For each benchmark program, several faulty versions with an injected fault have been created. Table 9 lists the number of faulty versions for each program as well as the type of the injected faults. The type of the faults injected to the benchmark programs, and also, the number of faults per type have been extracted from [41]. Since the experiment results in the previous section showed higher performance of SFLA-VND compared with the other meta-heuristic algorithms, we used this algorithm to identify the faults.
| Type of Fault | Gcd1 | Index | Matrix |
|---|---|---|---|
| Incorrect loop or selection structure | 2 | 1 | 1 |
| Incorrect process in messages | 2 | 2 | 1 |
| Incorrect size of array | 0 | 2 | 3 |
| Non initialized variable | 2 | 1 | 4 |
| Incorrect destination process address | 2 | 2 | 2 |
| Incorrect type of parameter | 1 | 2 | 3 |
| Incorrect message data type | 1 | 1 | 1 |
| Changing of communication primitives type | 5 | 2 | 1 |
| Incorrect data sent or received | 1 | 3 | 4 |
| Change the logical operator in predicative statements | 2 | 1 | 3 |
| Missing statements | 5 | 3 | 6 |
| Increment/decrement of variables in communication primitives | 1 | 1 | 2 |
| Total | 24 | 21 | 31 |
The number of faults inserted in each program.
The test suite generated for the faultless version of each program has been used to detect failures in their faulty versions. Due to the nondeterminism in the execution behavior of a concurrent program, execution of the program with available test suite does not guarantee covering all the previously covered test goals. In other words, some test goals that had been previously covered at the test data generation stage was not covered at the failure detection stage. So, we needed a mechanism that could replay a previously executed run of the program using a controlled execution. The controlled execution mechanism follows the same idea proposed by Carver and Tai [42]. The required information to replay a specific execution was saved during the process of test data generation.
For detecting failure in a faulty program, initially, the faulty program was executed with the test suite. If some of the previously covered requirements were not covered, a controlled execution was employed to cover the remaining uncovered requirements. The capability of the proposed method for detecting failures was evaluated when the amount of coverage reached to amount of this metric in test data generation stage.
The percentage of the faults transformed into the failures during feeding the generated test suite to the program has been considered as the failure detection capability. Table 10 shows the calculated value of the failure detection capability for each benchmark program. Note that the proposed approach has been able to detect all failures in Gcd1, and only one failure in the Index and Matrix benchmarks has not been recognized. In addition, the results show that the proposed method performed better than the two compared methods. Moreover, the considerable difference between SFLA_Seq and the proposed method in terms of the effectiveness of test data generation for concurrent programs is confirmed.
| Programs | Proposed Method (%) | NICS-GA (%) | SFLA_Seq (%) |
|---|---|---|---|
| Gcd1 | 100 | 100 | 83.3 |
| Index | 95.2 | 90.4 | 76.1 |
| Matrix | 96.7 | 93.5 | 77.4 |
Failure detection capability.
6. THREATS TO VALIDITY
This section investigates possible threats to the validity of the empirical studies performed in this study. The internal threat to the validity includes parameter settings, such as the memeplex size, the number of memeplexes and the number of memeplex evolutions in each iteration. To minimize this threat, as described in Section 5.2, we tried various experiments to seek for suitable values of special parameters of the proposed algorithm. However, the same parameters in the compared algorithms are considered to be equal and are not tuned for each algorithm separately. For example, the same value of the population size is considered for all algorithms, while one algorithm may perform better with a different value. Therefore, the parameter settings remain a threat to validity. In order to determine the optimal values of these parameters, a large number of experimental studies will be required in the future.
The threat to the construct validity deals mainly with whether the experiment is measured in an appropriate way. To address this, we adopted coverage, SR, time consumption and the number of evaluated individuals as the evaluation metrics. Furthermore, multiple experiments have been run and average values of the metrics have been reported.
An external threat to the validity is to limit the extent to which the results can be generalized. We tried to minimize this threat by selecting programs with various numbers of processes, sending and receiving statements and input variables, as well as input domains in the experiments, suggesting their good representativeness. These programs are either widely used in other studies or from nontrivial MPI benchmarks. Another external threat could be the fact that the AT results depend on specific hardware and software platforms which were used in experiments. Hence conducting experiments on different platforms may yield different results from those in Table 6.
7. CONCLUSION AND FUTURE WORK
Search-based techniques are widely used for generating test data in sequential programs. However, these methods have seldom been used to generate test data in concurrent programs. In this paper, firstly, a framework for generating test data in concurrent programs was presented. Then, a hybrid meta-heuristic algorithm named, SFLA-VND, was proposed. SFLA-VND is a combination of the SFLA and VND algorithms. Finally, the meta-heuristic algorithms GA, ACO, PSO, SFLA and SFLA-VND were implemented in the proposed framework and their performance was compared. The results of experiments on five concurrent benchmark programs indicated high efficiency of the proposed framework for generating test data as well as successful application of the SFLA-VND algorithm.
The applied benchmark programs in the current research do not use shared variables, which prevents occurring some types of concurrent errors. Atomicity violations are a major source of failures in concurrent programs with shared memory. In future, we plan to extend the proposed framework in order to generate test data for concurrent programs with the objective of the atomicity violation detection.
Game theory is a mathematical model which deals with interactions between various entities by analyzing the strategies and choices. Recently, this theory has been extensively used in the fields like economics, sociology, computer science, etc. Given the competitive nature of processes in concurrent programs, the use of game theory in testing concurrent programs seems to be useful which is suggested for future work.
The evaluation of the proposed method on benchmark programs with higher complexity and presenting meta-heuristic algorithms that are compatible with the specific features of concurrent programs are also suggested for future works.
CONFLICT OF INTEREST
The authors declare that they have no conflict of interests.
AUTHORS' CONTRIBUTIONS
The authors have contributed to all processes and stages of this research.
REFERENCES
Cite this article
TY  - JOUR
AU  - Seyed Mohsen Mirhosseini
AU  - Hassan Haghighi
PY  - 2020
DA  - 2020/08/17
TI  - A Search-Based Test Data Generation Method for Concurrent Programs
JO  - International Journal of Computational Intelligence Systems
SP  - 1161
EP  - 1175
VL  - 13
IS  - 1
SN  - 1875-6883
UR  - https://doi.org/10.2991/ijcis.d.200805.003
DO  - 10.2991/ijcis.d.200805.003
ID  - Mirhosseini2020
ER  -