
A Heuristic and ANN based Classification Model for Early Screening of Cervical Cancer
 , N. K. Karthikeyan2,
 - DOI
- 10.2991/ijcis.d.200730.003How to use a DOI?
- Keywords
- Cervical cancer; SMOTE; SVM classifier; Backpropagation; Deep Learning
- Abstract
Cervical cancer is one of the most leading causes of mortality among women worldwide. This deadly disease could be prevented by vaccines and easily cured if detected at an early stage. Various researchers focus on providing methods for unambiguous results of screening tests for early diagnosis of cervical cancer and also on detecting stages of cervical cancer through Pap smear images of the cervix. Various socio-economic factors of women in underdeveloped countries limit the regular Pap smear test for screening of cervical cancer. It is pragmatic that the prediction on the likelihood of cervical cancer is not always possible based on the fewer inquiries from the patients and the data remain inadequate. Oversampling of the data is needed to any dataset for preprocessing the data and this is achieved by using Synthetic Minority Oversampling Technique (SMOTE). In the proposed work, chi-square, a filter-based feature selection method is used to select the attributes based on their correlation between feature and the class to remove the irrelevant attributes from the dataset. Further genetic-based feature selection is used to filter the best optimal features from the selected attributes. Linear Support Vector Machine (SVM) classifier is applied to the selected attributes from the genetic algorithm to aid in predicting the model through training and testing, resulting in an accuracy of 93.82%. Backpropagation, a deep learning method is used as a classification model for cervical cancer, resulting in an improved accuracy of 97.25%. The experimental results show the efficiency of the proposed model is better in comparison to the previous models in terms of accuracy.
- Copyright
- © 2020 The Authors. Published by Atlantis Press B.V.
- Open Access
- This is an open access article distributed under the CC BY-NC 4.0 license (http://creativecommons.org/licenses/by-nc/4.0/).
1. INTRODUCTION
Cervical cancer is one of the most prevalent cancers among women with a global estimate of more than 570,000 every year approximating 6.6% among all other cancers [1]. Cervical cancer occurs in women's cervix and propagates to damage the entire organs of the body resulting in death. This cancer is identified as an abnormal cell growth in the cervix part of the women at the preliminary stage [2]. During the later stage, it extends to all the other parts predominantly the abdomen and lungs. In a common aspect, cervical cancer is caused by Human Papilloma Virus (HPV) a sexually transmitted infection [3]. Smoking, usages of contraceptives, multiple pregnancies are the few other significant factors that cause cervical cancer.
Cervical cancer tends to show no or fewer symptoms at an earlier stage in the human body. Based on the study of literature, it is observed that it takes several years to show symptoms when a normal cell turns into a cancerous cell in the cervical region [4]. During the advanced stage, some of the symptoms that surface include abnormal or irregular vaginal bleeding, increased vaginal discharge, and pelvic pain along with other illness.
Pap smear or Pap test is the commonly adapted procedure done by collecting cells from the cervix and inspected to test the presence of cancer. Detecting cervical cancer early through Pap test gives a greater chance of cure by treating it in right time [5]. However, for people in underdeveloped and developing countries, the lack of screening resources and physicians to detect and acquire treatment early is confronted.
To reduce the high mortality rate of cervical cancer, it is important to undergo consistent screening test in every 3–5 years for every woman over 30 years of age. It is inferred that in underdeveloped countries, frequent screening was not possible because of poor medical infrastructure and expertise [6–9]. Cytology or Pap smear test, Biopsy, Schiller, and Hinslemann are the screening methods available for screening cervical cancer. Cytology method is a microscopic analysis of tissue collected from the cervix that identifies the cell growth and also the intensity of it [10]. The biopsy method is a surgical diagnostic process carried out by collecting living tissue samples to categorize if the sample is malignant or benign [11]. Hinslemann test is a visual inspection of the cervix by applying an iodine solution [12]. This inspection at times yield varied results based on the expertise of the examiner. In the Schiller test, Lugol's iodine is administrated for visual inspection of doubtful region in the cervix [13]. This is more similar to the earlier method and relies on the expertise of the examiner for accurate results.
In the era of computational intelligence and high-performance computing, automating the screening tests by mining and computational methods could ease the process. The data mining task becomes significantly important for finding out patterns in the dataset for analyzing the risk factors of cervical cancer. In this study, different classifications algorithms are implemented and tested to shorten the diagnostic time to simplify the decision-making process by physicians. This study also proposes a predictive model to forecast the likelihood of occurrence of cancer among women thus aiding her to avoid undergoing screening tests time and again.
In the proposed paper, the dataset [14] containing the risk factors of cervical cancer that include demographic information, habits, and historic medical records is collected from the UCI repository. On the collected dataset, a filter-based feature selection method is applied to eliminate the irrelevant features. Since genetic algorithms are best known for converging to optimal solutions in larger solution space, it is applied to optimize the performance of the proposed model. A Backpropagation algorithm is then used to train the feed-forward neural networks for analysis and screening of cervical cancer and to improve the accuracy by a supervised learning method.
The paper is organized as follows: Section 2 describes a detailed literature on different study on cervical cancer. Section 3 describes the dataset used in the proposed work. Section 4 describes the methods used for preprocessing and feature selection. Section 5 describes the implemented model. Section 6 describes the comparative study on results obtained by evaluating the model and the paper is concluded in Section 7.
2. LITERATURE STUDY
Many research works have been conducted for the classification of various stages of cervical cancer and analyzing the risk of the possibility of women susceptible to cervical cancer. Various approaches based on clinical features, genetics and image analysis were carried out for the detection and classification of cervical cancer.
One of the studies by Ho et al. [15] used a logistic regression model and compared the results with Chi-square Automatic Interaction Detector (CHAID) model on the dataset with 12 attributes and 710 samples. Initially, logistic regression is built in an assumption that it takes a major position in predicting or classifying the clinical outcomes. Further, the CHAID model is built with 577 training data and 133 test data with a classification accuracy rate of 88.70%. In another study of Pap smear images by Yamal et al. [16] used logistic regression in a dataset of 1728 patients and 133 features. Micro-level (cell level) classification was performed on images and posterior probability is used to conduct classification at the patient level. The model resulted in an accuracy rate of 89% which is found to be elevated than the previously affirmed model.
In a study that compared the C5.0 algorithm with the SVM algorithm by Tseng et al. [17] on the dataset of 12 attributes over 168 samples, 118 are chosen to be the training data and 50 as test data. C5.0 algorithm achieved the classification accuracy of 92.44%. The key risk factor of recurrence—proneness of cervical cancer in patients was also identified.
In one of the studies by Wu et al. [18], Principal Component Analysis (PCA) for dimensionality reduction and the SVM algorithm for classification were used in a dataset with 32 attributes over 858 samples along with target class variables. These methods resulted in the classification accuracy of 90.48%.
Kurniawati et al. [19] carried out a study with the Pap smear images that compared the Random Forest (RF) algorithm with SVM on a dataset with 75 samples and 38 attributes grouped into 7 classes. The cell characteristics of the Pap smear image were studied by microscopic anatomical pathology of Pap smear result. It was observed that the RF algorithm converged with the maximum classification accuracy rate of 80.10%.
In another work [20], 917 Pap smear images were collected with 20 attributes and implemented using RF algorithm by Sun et al. A framework for cervical cancer diagnosis is presented based on an RF classifier with RuleF feature selection, resulting in the classification accuracy of 94.44%.
In one of the research, convolution neural network (CNN) model was developed for the experimental data that contained 65 images and 32 × 32 filters were applied and trained for 300 epochs [21]. The predicted class was either a normal class or cervical cancer class representing 3 other stages of it. The classification rate of 77.25% was obtained by this deep learning approach. Besides a 5-fold validation method to validate the predicted class was also carried out.
In another study [22], Pap smear and Liquid Based Cytology (LBC) datasets were used for ConvNets deep learning model over 917 images. The datasets were analyzed to predict the normal and abnormal condition on the cervical cancer images. The experimental results showed that the predicted class had a classification accuracy of 98.3%, which is found to be the highest accuracy achieved by CNN on Pap smear images. In [23], ConvNet pipeline were used for multi-label image [24] classification were the labels and image features are also extracted and loss function is also carefully designed [25].
When using cervical images, the overhead in image processing and the ability to train a model appears to be the challenge as inferred through the extensive literature review on the works carried out by various researchers. This beckons the proposal to cart out a work that includes improved feature selection methods. Genetic algorithm, known for the convergence to maxima at a diminutive time while a huge solution space deems appropriate for feature selection among several attributes to chose. Backpropagation algorithm a standard and widely used training algorithm is adapted later to improve the accuracy of the classification.
3. DATASET DESCRIPTION
Cervical cancer dataset as in Table 1 is obtained from UC Irvine Machine Repository (Fernandes et al. [5]) collected from “Hospital Universitario de Caracas” in Caracas, Venezuela. The dataset is comprised of 858 patient records (samples) with 32 attributes and 4 target classes for further computational analysis through machine and deep learning models through a supervised learning method.
| F1 | Age |
| F2 | Number of sexual partners |
| F3 | First sexual intercourse (age) |
| F4 | Number of pregnancies |
| F5 | Smokes |
| F6 | Smokes (years) |
| F7 | Smokes (packs/year) |
| F8 | Hormonal Contraceptives |
| F9 | Hormonal Contraceptives (Years) |
| F10 | IUD |
| F11 | IUD (years) |
| F12 | STDs |
| F13 | STDs (number) |
| F14 | STDs: condylomatosis |
| F15 | STDs: cervical condylomatosis |
| F16 | STDs: vaginalcondylomatosis |
| F17 | STDs: Vulvo-perineal Condylomatosis |
| F18 | STDs: syphilis |
| F19 | STDs: pelvic inflammatory disease |
| F20 | STDs: genital herpes |
| F21 | STDs: molluscum contagiosum |
| F22 | STDs: AIDS |
| F23 | STDs: HIV |
| F24 | STDs: Hepatitis B |
| F25 | STDs: HPV |
| F26 | STDs: Number of diagnosis |
| F27 | STDs: Time since first diagnosis |
| F28 | STDs: Time since last diagnosis |
| F29 | Dx: Cancer |
| F30 | Dx: CIN |
| F31 | Dx: HPV |
| F32 | Dx |
AIDS, acquired immunodeficiency syndrome; HPV, Human Papilloma Virus; STDs, Sexually Transmitted Diseases; CIN, Cervical Intraepithelial Neoplasia; IUD, Intrauterine device.
Cervical cancer dataset.
4. MATERIALS AND METHODS
4.1. Data Preprocessing
The data collected from various resources are vulnerable to noise, missing values, outliers, and inconsistent values. It is important to preprocess the data before the application of any mining process. Preprocessing becomes a crucial step to improve the data efficiency during the knowledge discovery. Some of the preprocessing steps involved are dealing with the missing values, data transformation, data reduction which makes the dataset more meaningful. The data preprocessing steps that are involved in the proposed research are discussed further.
Preprocessing is done to remove the missing values. Out of 32 attributes, the attributes like “Time since first diagnosis”(F27) and “Time since last diagnosis”(F28) had almost 92% of missing data and are removed because of incomplete data. The details were found missing due to patient's privacy reasons. Two attributes like STDs: cervical condylomatosis (F15) and STDs: AIDS (F22) has zero values for all the patients, so these two attributes were also deleted.
In attributes such as number of pregnancies, hormonal contraceptives, first sexual intercourse, missing values are replaced by the value of the mean of the variable. The mean value of the attribute is calculated by the following formula (1)
Due to the arbitrary behavior of the algorithms in terms of the range of values related to each feature, it is decided to scale all the features using min-max normalization. Min-max normalization is applied and the values are transformed in the range of [0, 1] by using the formula (2)
where minA and maxA are the minimum and maximum value of the attribute respectively.After normalization of data, the resultant dataset has 734 patient records with 28 attributes and it is identified as imbalanced data since only 70 patient records are cancerous and 664 patient records are noncancerous. To resolve this problem of imbalanced dataset, Chandrashekar et al. [26] Synthetic Minority Oversampling Technique (SMOTE) is used. The main principle of SMOTE, an oversampling method which generates “synthetic” samples rather than oversampling by replacements. The records for the minority class labels are separated from the dataset. Synthetic samples are generated by randomly selecting only one column from each record and finding the difference with its neighbor record. Oversampling of data through SMOTE is carried out using the Equation (3)
“Xknn” is the nearest neighbor of x that is obtained by finding the Euclidean distance between “Xi” and every other sample in the minority class set A. The sampling rate “S” is set according to the number of samples needed to balance the dataset. For each
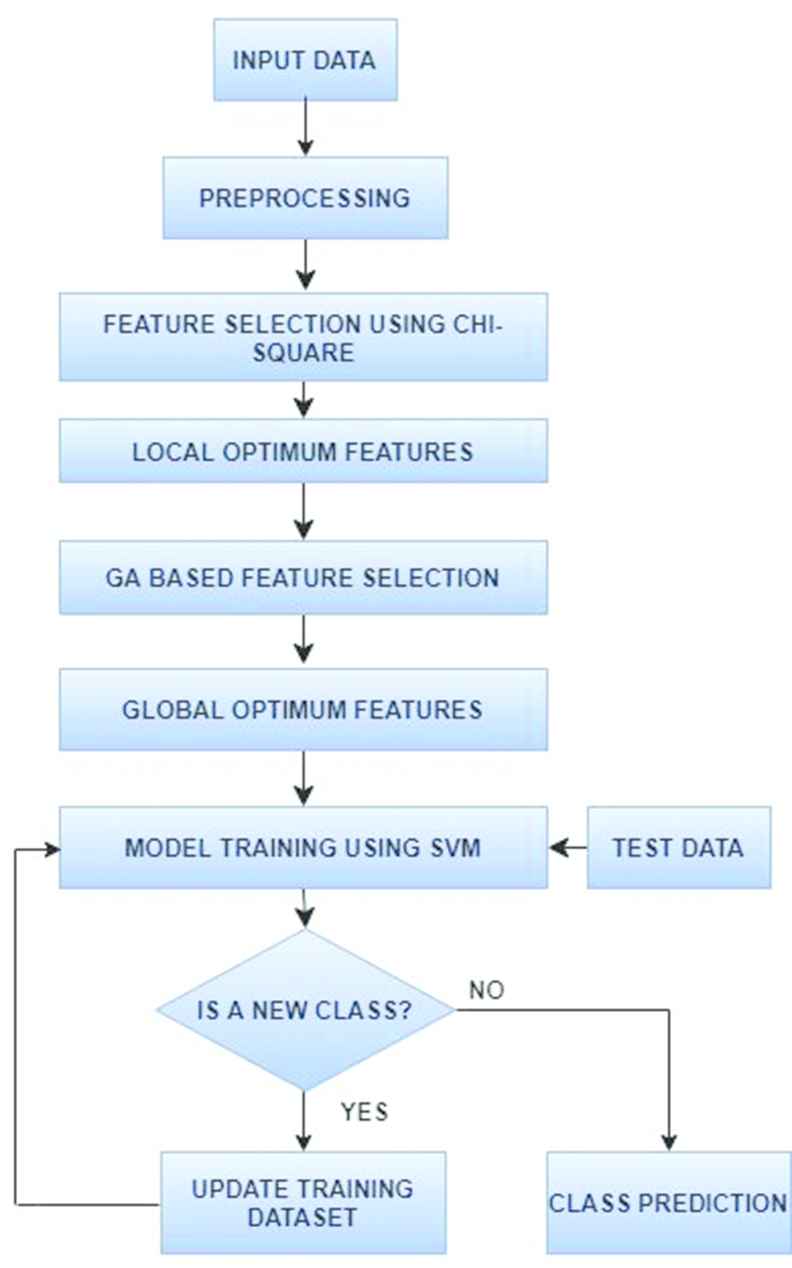
Flow diagram of the proposed work.
4.2. Feature Selection Methods
In data mining, dimensionality reduction is the most popular technique used to remove noisy data, missing values, and redundant attributes. This dimensionality reduction can further be classified into two types: Feature extraction and Feature selection. Feature extraction is the process of finding a new set of features, by mapping some functions. Feature selection is the process of selecting the subset of features from the original data which can effectively remove noise, missing values, and redundant features from the dataset. Some of the feature selection methods include filter, wrapper, and embedded methods. Filter methods are used to select features without using any learning algorithm. This method ranks each feature according to univariate or multivariate metrics and selects the features that have the highest ranking. In the proposed research work, the filter-based feature selection method is used to select the subset of features from the cervical cancer dataset.
4.2.1. Chi-square χ2 test for feature selection
The chi-square test is used to identify the relationship between the features in the dataset. The χ2 value is computed as the difference between the expected frequency and the observed frequency. It is given by the formula (4)
The χ2 statistic, tests the hypothesis whether attributes A and B are independent i.e., there is no correlation exists between them. To perform the χ2 test, the Null hypothesis is defined initially and subsequently the Alternate hypotheses. The contingency table for attributes A and B are built showing the list of tuples. Further, the expected frequency is calculated using the formula (5)
Now calculate the χ2 statistic by
For the degree of freedom, the chi-square value needs to reject the hypothesis at the significant level 0.01 whose statistic value is 30.58. If the computed chi-square value of the attributes is above this value; the hypothesis is rejected and identifies that the attributes are strongly correlated. By applying the chi-square analysis over the cervical cancer dataset, it is observed that F16, F18, F19, F20, F21, F24, F25, F29, F30, F31, F32 are the attributes that do not have feature to feature correlation and feature to class contribution to the convergence of the class labeled biopsy. Similarly, on analysis, it was found that the remaining attributes show predominant influence toward the class label. Also, the extracted features over the chi-square test have minimal coincidence among the features. The accuracy of the chi-square based correlation analysis was observed to be 82%.
4.2.2. Correlation coefficient for feature analysis
To find the relationship between any two numeric attributes A and B, Correlation coefficient (Otherwise known as Pearson's product-moment correlation) is used. A Correlation matrix is a table containing a correlation coefficient between a set of attributes. Each attribute (Xi) in the matrix is correlated with every other value in the matrix (Xj) and is computed using the Equation (8)
The covariance between A and B is defined in Equation (9)
The correlation coefficient is then calculated by (10)
Based on the correlation matrix, it is found that if the relationship between any features in the matrix is just about 1 then it is highly correlated. In the cervical cancer dataset, features like F1, F2, F3, F4, F5, F12, F25, and F26 have a correlation value of less than 0.6. So, these attributes are directly taken for consideration as it is not correlated. For the highly correlated features like F6 and F7, F8 and F9, F10 and F11, F29 and F31, to remove the dependant features, only one of the features is considered.
4.2.3. Genetic algorithm based feature selection
Genetic algorithm, one of the widely used heuristic techniques is used for feature selection. It uses a stochastic method for optimization of function based on the analogy to the Darwinian principle of “Survival of the fittest.” It is a heuristic optimization method based on the mechanics of natural genetics and biological evolution. In feature selection, the iterative computations are performed to optimize the generalization performance of a predictive model and to minimize the error.
The genetic algorithm is a stochastic optimization method in which the genes of the individuals called population are initialized in random. The number of genes represents the number of features that are taken from the previous feature selection methods. Roulette wheel selection method is used to select the gene at random for crossover. Among the various crossover methods, a 2-point crossover is used to find the next generation genes. Mutation is used to flip the bits in genes at random. Fitness evaluation is done based on the newly generated population. Figure 2 depicts the process involved in Genetic Algorithm for feature selection.
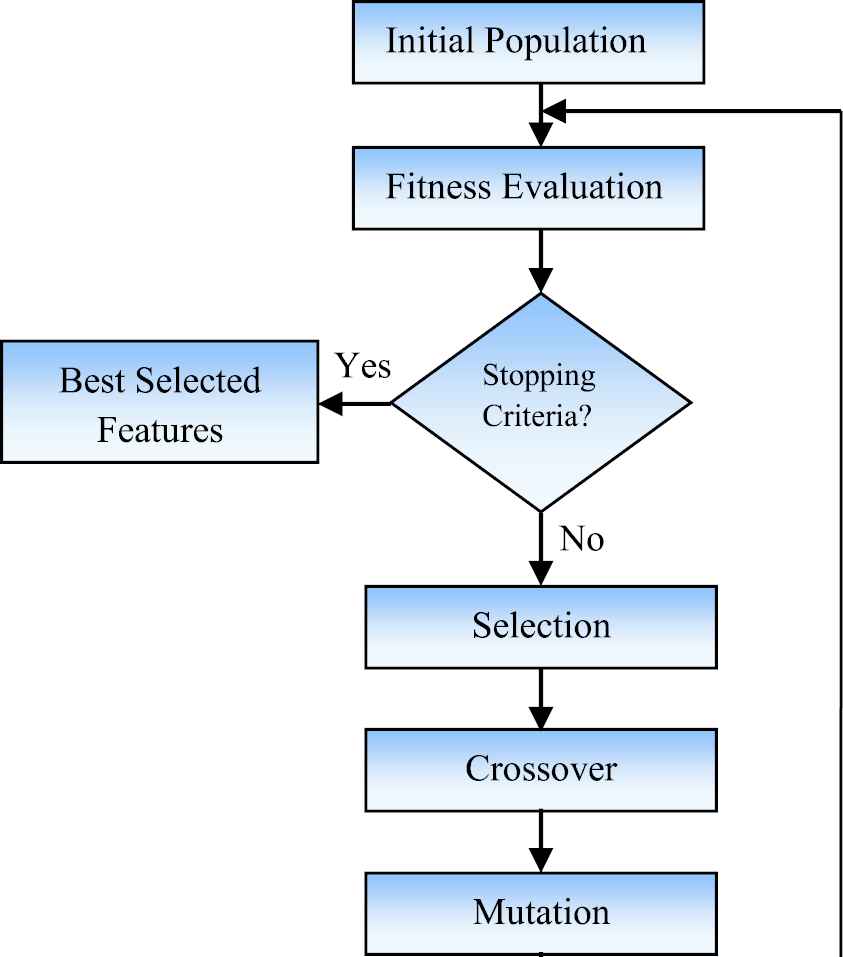
Process involved in genetic algorithm.
From the chi-square and correlation methods, some of the features are selected as best features and is given as input to the genetic algorithm to find the globally best features in feature space. Based on several operations in the genetic algorithm method, it is found that F1, F2, F3, F4, F5, F6, F8, F10, F12, F26 shows major contribution to the class label.
5. PROPOSED METHODOLOGY
5.1. SVM Based Linear Classifier
SVM algorithm separates data of two different classes through a distinct separating line called hyperplane by taking a set of data as input [27]. An optimal subset of features is selected from the genetic algorithm and is directly fed into the SVM linear classifier model to predict the possibility of cervical cancer. Given a training data
To learn a classifier f(x) or an optimal hyperplane is defined by (11)
For any training attributes, consider
Any selected records of patients are satisfied for any point that lies on or above the hyperplane H1 and belongs to the class +1 biopsy. Any tuples that falls on or below H2 belongs to class −1 which falls under other class. Hence the selected features from the genetic algorithm are given to SVM classifier and the accuracy of the model is obtained as 93.82%.
5.2. Backpropagation
In the field of Artificial Neural Networks, the Backpropagation algorithm is a type of supervised learning method for training weights in a multilayer feed-forward networks. The basic principle of the Backpropagation approach is to model a given function by fine-tuning the weights of the input signal and produce an expected output signal. The system is trained using a learning method, and if the error obtained from the previous epoch (i.e., iteration) is between the system's output and a known expected output then it propagates back to adjust the weight to get the minimum loss [28].
The neural network of the proposed model is shaped with input neurons, two hidden layers, and an output layer. The input layer is formed by the number of features selected from the GA model. By assuming weights for each node connected to the hidden layers, the output at the hidden layer is computed by considering input nodes and weights which is given by the formula (16)
And applying ReLu activation function, the output at the hidden layer is calculated by
Based on the number of hidden layers in the model, the output at each hidden layer is calculated. For example, consider 3 nodes in the first hidden layer that is termed as layer 2, the output at the hidden layer is calculated as
For n nodes in the layer m, the output is calculated as
The features extracted from the genetic algorithm is given as an input to the deep learning model which uses ReLu function in all the hidden layers as it is computationally less expensive since the output is either 0 or x. Sigmoid is used as an activation function in the output layer because it is a binary classification problem and the value of more than 0.5 is turned as a positive class for biopsy and vice versa. The error in trained model is calculated by finding the difference from the sum of squares of error using the target values and the result from previous layers through forward propagation and it is given in the Equation (21)
After computing the error, it propagates back to adjust the values in the weight parameters by gradient descent optimization method and iterates “n” number of times until the error is equal to 0 or some negligible amount. The separated test data from cervical cancer dataset is applied to test the model and accuracy is then calculated.
6. RESULTS AND DISCUSSION
6.1. Classification Based on Age
The dataset is first analyzed and separated to examine various age groups. This is to have a new finding on the impact of cervical cancer scattered upon a varied age group. Hence the entire system modeling is made upon several categories of age like less than 25 years, 25–35 years, 35–55 years, and more than 55 years. It is observed that the women below age 25 are uncommon to acquire cervical cancer since they may not have exposure to any of the attributes identified from the contributing features from Genetic Algorithm (GA). It is observed that only 15% of women are diagnosed with cervical cancer between the ages of 25–35, after their first sexual intercourse below the age of 18 and their indulgence in smoking habits. It is also observed that 50% of women from the age of 35 to 55 are most likely to get cervical cancer. This is because; they undergo numerous sexual contacts with insufficient contraceptive measures. Only 25% of women are susceptible to cervical cancer after the age of 55. This 25% of contribution is mainly due to their weak immune system to fight against infections. Thus, it is tacit that every woman between the age of 35–55 must undergo screening test at regular intervals. The following Figure 3 depicts the probability distribution of cervical cancer over the ages.
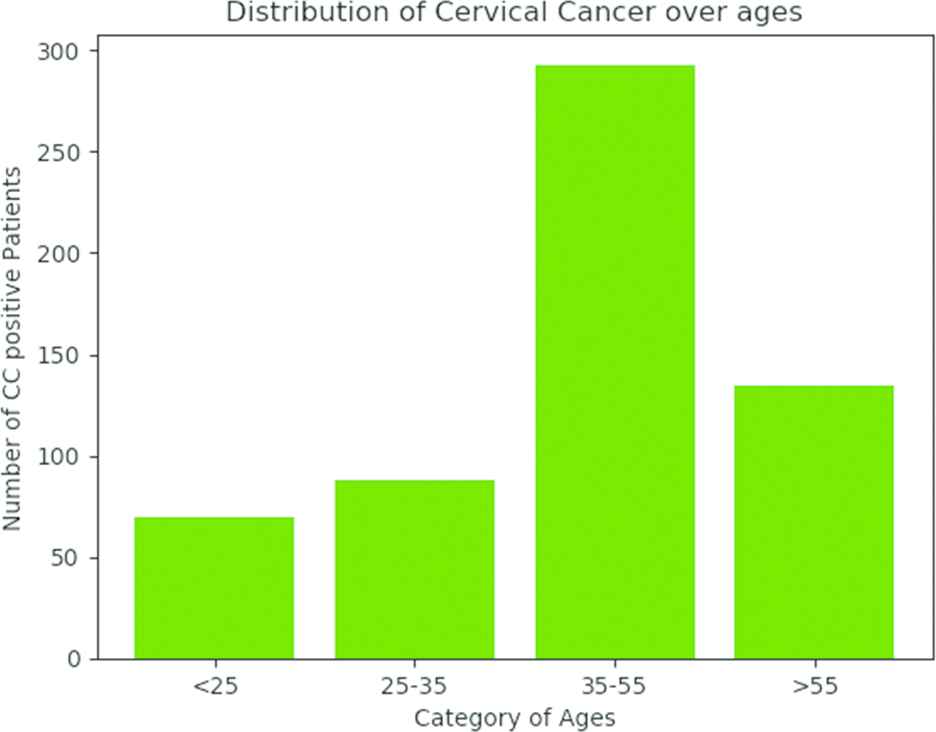
Distribution of cervical cancer over the ages.
6.2. Linear SVM Based Classification
For the described dataset, the relationships between all the attributes in the dataset were found by chi-square analysis and correlation coefficient. Some of the standard libraries of python is used for implementation are scikit-learn and numpy. The computation chi-square statistic defined the chi-square test value of 30.58 as a hypothesis. The features F1, F2, F3, F4, F5, F6, F8, F10, F12, and F26 are the list of attributes that accepts the hypothesis and are highly independent when determining the feature to feature correlation. These insights that these features individually contribute to the classification of cervical cancer and cannot be omitted or rejected in the feature selection process. Table 2 represents the chi-square computation values for all the features extracted from the experimental analysis.
| Significant no | Features | Computed Value | Significant no | Features | Computed Value |
|---|---|---|---|---|---|
| 1 | F4 | 510.771 | 6 | F2 | 47.811 |
| 2 | F5 | 161.309 | 7 | F3 | 42.155 |
| 3 | F8 | 91.731 | 8 | F10 | 41.129 |
| 4 | F1 | 67.436 | 9 | F12 | 35.347 |
| 5 | F6 | 49.616 | 10 | F26 | 31.693 |
Computed Chi-square values in terms of positive class label.
Figure 4 illustrates the feature to feature correlation of F8 to all other remaining features taken for consideration from the filter-based feature selection method and it is pragmatic that all features are independent with minimum threshold value.
Similarly, Figure 5 illustrates the relationship between F12 to all other selected features and it is found that these attributes are independent of each other in terms of feature to feature correlation in the described dataset. Each feature is contributed individually in predicting the screening test of cervical cancer.

Feature to feature dependency with F8.
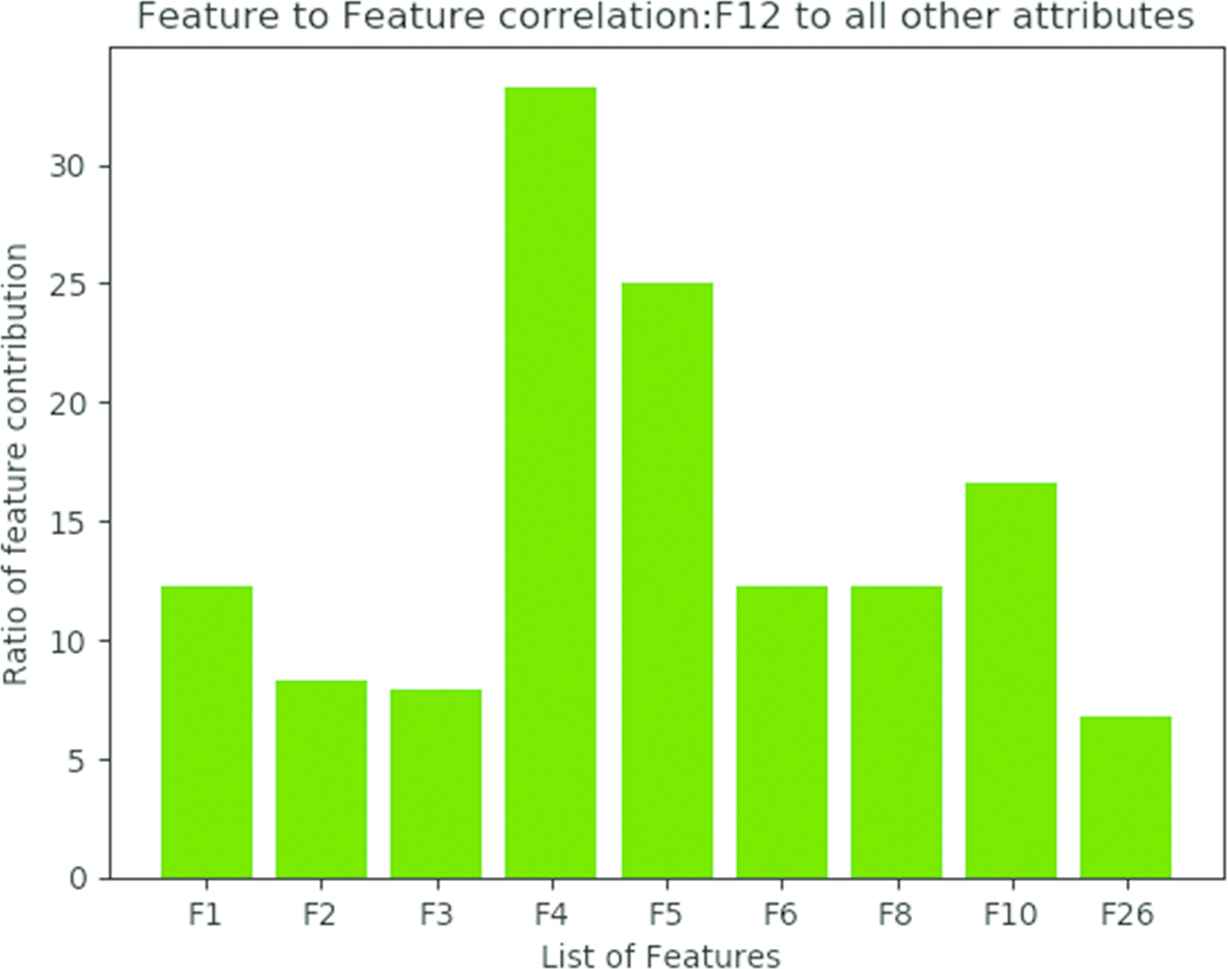
Feature to feature dependency with F12.
6.3. GA Based SVM Classification
Further, the dataset is analyzed to find the features contributing toward the positive class of biopsy. The resultant independent feature from GA based feature selection methods were considered for analysis and showed the improved accuracy by lowering the false positive rate. Each feature is considered as a gene or initial population for the genetic algorithm method. The combinations of all the ten features are considered as chromosome. The features F1, F2, F3, F4, F5, F6, F8, F10, F12, and F26 are fed into system modeling. Furthermore, fitness value for the previous iteration and the current iteration has given the same value in the 25th iteration. It showed the faster convergence to the results from the selected attributes toward the class label by generating the global optimum features in the increased global feature space. The Figure 6 shows the features to class contribution for the selected attributes from GA.
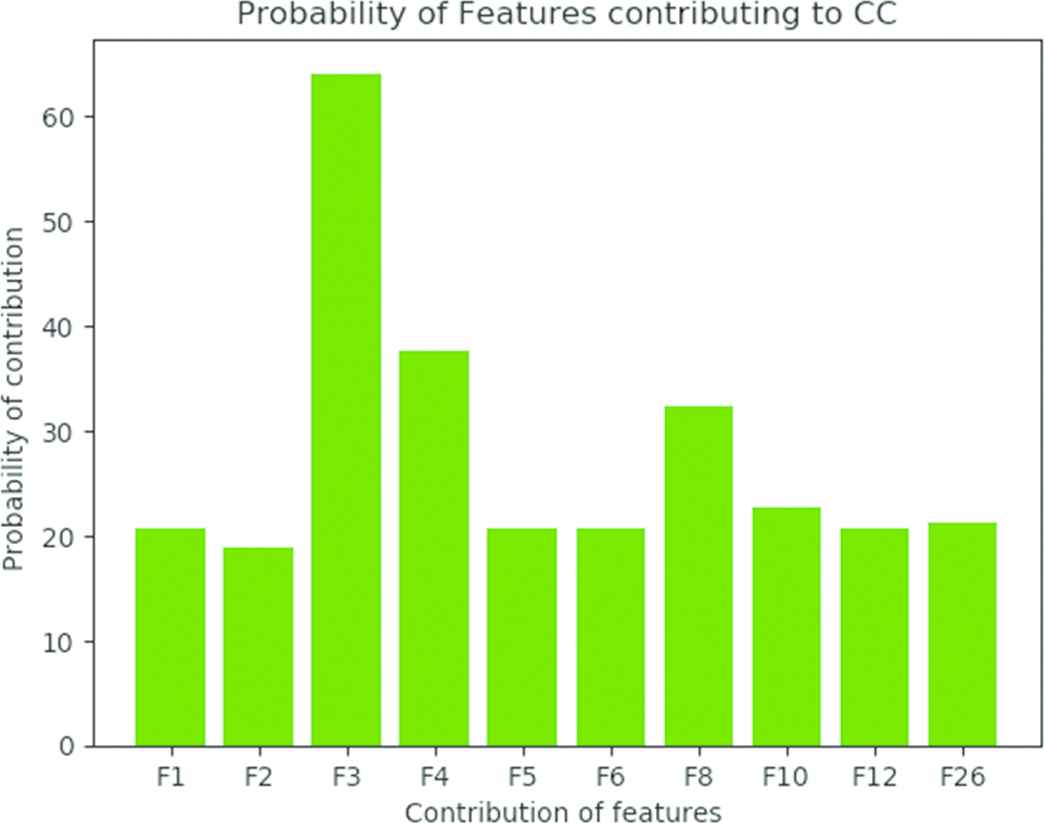
Feature to class dependency.
6.4. Classification Based on Backpropagation
In the Backpropagation method, randomly 917 records are used for training the model and 305 records to test the model. In each layer, the output of each neuron is calculated with weight and bias. The computed input is given to the sigmoid activation function. The resultant value from each neuron is given as input to the next layer neuron. During the first epoch, all the input neurons are initialized with its value (0 or 1) and the weight for neuron is set as a random value of 0.3. Two hidden layers are implemented and the loss value obtained is 0.67. Upon 20 epochs, the loss value is minimized to 0.11, it means the model is learned for given input parameters and the accuracy obtained is 0.9. This algorithm works well on large datasets. The performance of the model can be improved by changing the learning rate and the number of hidden neurons. By increasing the number of hidden neurons, the complexity of the model will be increased and extreme care should be taken to minimize the computational complexity.
6.5. Performance Analysis
The experimental result shows the comparison of performance in terms of accuracy for various models implemented above existing models. The accuracy of the model is calculated by Equation (22)
SMOTE is an oversampling technique and it is applied to make the data more sensible to the cancer patients. The observed results are compared before applying SMOTE to the dataset and also measured the after impact of the application of SMOTE. From literature, various algorithms specified in the Table 3 used the same data source which is also considered for comparison with the models implemented in the proposed work.
| Comparison on Various Models | Before SMOTE (Unbalanced Data) | After SMOTE |
|---|---|---|
| Decision Tree method | 91.03 | 89.72 |
| Rotation Tree method | 88.52 | 87.83 |
| Random Forest | 92.63 | 90.63 |
| SVM Linear method | 93.82 | 92.42 |
| Backpropogation | 97.25 | 96.43 |
SMOTE, Synthetic Minority Oversampling Technique.
Accuracy of various models in comparison.
The observed results clearly show that the SVM-Linear classifier model and Backpropagation model gives higher accuracy when compared to Decision Tree, Rotation Tree, and RF models. Upon several epochs in the Backpropagation algorithm for all class labels implemented, it is found that mean accuracy gives a better result of 97.25% whereas the SVM Linear classifier model gives the accuracy of 93.82% which is shown in Figure 7.
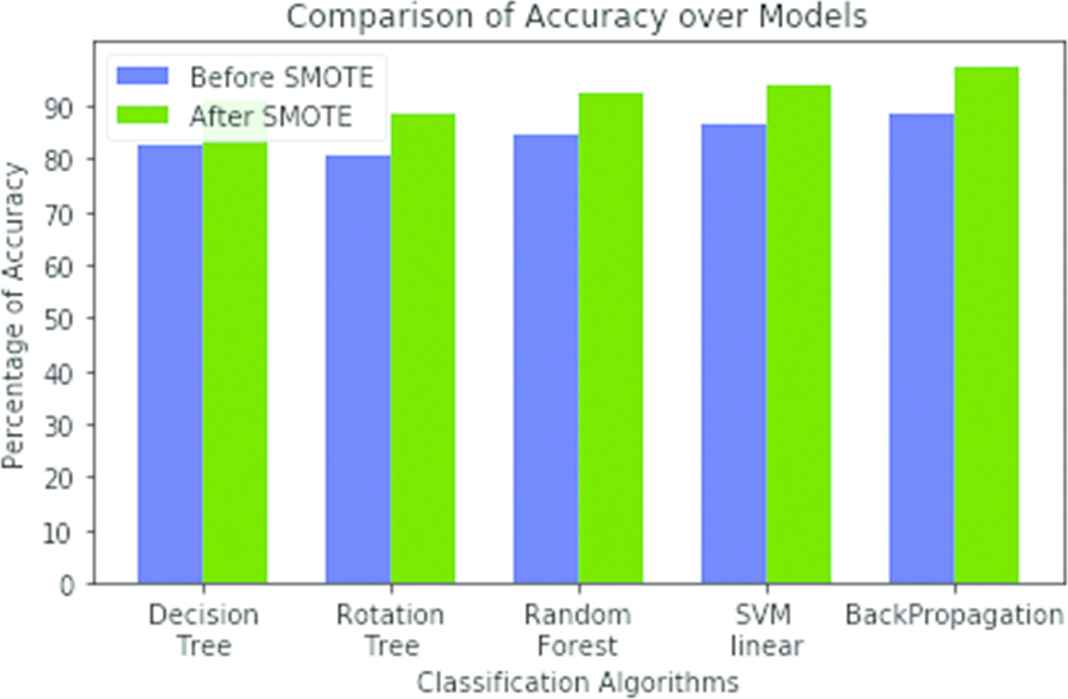
Comparison of accuracy over models.
7. CONCLUSION
Cervical cancer is the most common cancer in women and its screening test involves a lot of time and resources. In underdeveloped countries, the screening test is not possible because of a lack of medical facilities like the availability of physicians, equipments, etc. In this perspective, data mining and machine learning algorithms were used to predict the leeway of getting cervical cancer even before the screening test is done. Feature selection methodologies were used to find the set of features that contribute to the positive diagnosis of cervical cancer. Linear SVM model was implemented on the dataset and found to have an accuracy of 93.82%. The results were significantly improved in using the Backpropagation algorithm for the identified problem resulting in an improved accuracy of 97.25%. This proves that the model holds well in screening of cervical cancer considering the gravity of such a grave disease. As a future direction, this research may be helpful in creating awareness by implementing with mobile application.
CONFLICT OF INTEREST
The authors declare that they have no conflict of interests.
AUTHORS' CONTRIBUTIONS
This manuscript is the author's original work. The content of this manuscript or a major portion thereof has not been copyrighted, published, accepted for publication or submitted simultaneously elsewhere. S. Priya and N. K. Karthikeyan designed the manuscript, worked on the implementation of algorithms and proofs, drafted the manuscript and checked the final version of the manuscript.
ACKNOWLEDGMENTS
Authors sincerely thank the reviewers for their valuable comments and suggestions that have incorporated to enhance the quality of the work.
REFERENCES
Cite this article
TY  - JOUR
AU  - S. Priya
AU  - N. K. Karthikeyan
PY  - 2020
DA  - 2020/08/17
TI  - A Heuristic and ANN based Classification Model for Early Screening of Cervical Cancer
JO  - International Journal of Computational Intelligence Systems
SP  - 1092
EP  - 1100
VL  - 13
IS  - 1
SN  - 1875-6883
UR  - https://doi.org/10.2991/ijcis.d.200730.003
DO  - 10.2991/ijcis.d.200730.003
ID  - Priya2020
ER  -