
A Novel Target Searching Algorithm for Swarm UAVs Inspired From Spatial Distribution Patterns of Plant Population
 , Yongqiang Hu3, , Tingjuan Li3, *,
 - DOI
- 10.2991/ijcis.d.201109.001How to use a DOI?
- Keywords
- Swarm robotics; Target search; Swarm intelligence; Bean optimization algorithm; Cauchy distribution
- Abstract
Like some social animal groups, the evolution of plant populations in nature also contains swarm intelligence. Aiming at the problem of swarm Unmanned Aerial Vehicles (UAVs) target searching in complex and unknown environments, this paper explores search models suitable for swarm UAVs by investigating the spatial distribution patterns of plant population and proposes a novel robot bean optimization algorithm (RBOA) based on Cauchy distribution and normal distribution (CRBOA). It has been demonstrated by comparative experiments with RBOA and adaptive robotic particle swarm optimization (A-RPSO) that the CRBOA has excellent stability, striking a good balance between exploration and exploitation.
- Copyright
- © 2021 The Authors. Published by Atlantis Press B.V.
- Open Access
- This is an open access article distributed under the CC BY-NC 4.0 license (http://creativecommons.org/licenses/by-nc/4.0/).
1. INTRODUCTION
Swarm intelligence is the macro-intelligence behavior of social creatures through cooperation [1] The research of swarm robotics started with the observation of the cluster behavior in nature, especially the research of insects, birds, bacteria, fish, and other groups, and found that the complex behavior of robot systems can be achieved by simple individual collaboration [2]. Through the coordinated control of these individuals with limited capabilities, while taking full advantage of their own local perception and interaction capabilities, based on the self-organizing mechanism and the principle of swarm intelligence, swarm robots can emerge intelligent behaviors to solve various problems existing in robot and multi-robot systems. This can improve the reliability, efficiency and robustness of the robot system to perform complex tasks [3].
At present, the research contents of swarm robotics include target searching, tasks planning, communication mechanisms between individuals, path planning, coordination control, area coverage, and formation control problems [3,4]. Among them, the target searching problem is one of the most important problems in swarm robotics [5]. In recent years, human beings are facing the problems of frequent natural disasters, unstable international environment, fierce military competition, tight supply and demand of resources, and development of space resources. The target searching research of swarm robotics makes it applicable to such problems like search and rescue work after the accident, peacekeeping counter-terrorism, military strikes, mineral resource prospecting, and fault detection [6–8]. In the field of swarm robotics, through years of development, research on target searching has made some progress. But for the target searching problems in unknown complex environments, how to improve the search efficiency, reliability, robustness, and scalability of robotic systems are still frontier of current research, and have practical significance and application value.
Research on the swarm robotics inspired by plants is rare. The main reason is that the emergence mechanism of swarm intelligence of plants is not famous and not easy to be to associated with the construction of swarm robotics. But the botany-related research shows that plants and plant groups also have intelligence [9,10]. This result can provide novel ideas for the research of swarm robotics. Aiming at the problem of target searching in unknown environments, based on robot bean optimization algorithm (RBOA) [11], this paper investigates the spatial distribution pattern of plant populations and proposes a novel RBOA based on Cauchy distribution and normal distribution (CRBOA). The efficiency of target searching is improved. The experiments were performed in the simulation environment based on five benchmark functions. By adding the experimental success rate to the previous experimental indexes, and comparing with the typical swarm robotics algorithms: adaptive robotic particle swarm optimization (A-RPSO) and RBOA, the effectiveness of CRBOA was verified.
The rest of the paper is organized as follows: Section 2 reviews the literature on the spatial distribution of plant populations and introduces BOA and RBOA. Section 3 describes the design and implementation of CRBOA. The algorithm experiment and analysis are given in Section 4. Section 5 concludes the paper and points out some future works.
2. THE PATTERN OF PLANT POPULATION AND BOA
2.1. Introduction to the Pattern of Plant Population
The pattern of plant population refers to the spatial distribution of plants within a certain horizontal spatial range [12,13]. It is formed by the interaction of various mechanisms of the plant ecosystem, which is the basis for exploring the mechanism of maintaining biodiversity.
Due to the close relationship between plant spatial patterns and ecological processes [14], qualitative and quantitative analysis of plant distribution patterns to infer its formation process and the underlying ecological mechanism has become an important work of ecologists [15]. Many ecologists have been persistently studying the spatial distribution pattern of multiple populations of various plant ecosystems in different regions. This work is to reveal the potential causes of spatial distribution patterns, and to elucidate the occurrence, development, and dynamic changes of plant populations. Furthermore, the relationship between species, ecological function of plant population in the community, and the interaction law between plants and environmental factors will be understood.
In addition to the influence of biological factors such as seed diffusion and density, the formation of plant distribution patterns is also driven by the heterogeneity of abiotic factors. Because habitat factors are a combination of multiple environmental factors. Terrain, light, soil, climate, and their interactions will form a heterogeneous representation of habitats in time or space, which will have a direct impact on the spatial pattern of plants. As the spatial distribution of most species has habitat preferences [16,17], the research on plant spatial distribution patterns is mainly focused on whether habitat heterogeneity is the reason for the formation of plant spatial distribution patterns and whether it has an impact on plant distribution patterns. Research on the spatial pattern of ecosystems has proved that the spatial heterogeneity of habitats leads to the existence of spatial patterns, and the spatial pattern is a concrete manifestation of spatial heterogeneity [18]. Many researches, both at the species level and at the community level, have also shown that habitat heterogeneity plays an important role in plant spatial distribution patterns.
There are usually three types of spatial distribution of plant populations: aggregate distribution, random distribution and uniform distribution [19]. Regardless of whether it is a common species or a rare species, it is generally to show spatial distribution of aggregate, and common species tend to exhibit more aggregate distribution than rare species. Regarding the reasons for the formation of the spatial pattern of aggregation, some researches have shown that the life history characteristics of plants, that is, the characteristics of plant growth and development throughout the life, have a great impact on species distribution patterns [20]. In the study of the characteristics of plant life history, some scholars believe that the restriction of species diffusion (that is, the seeds always be scattered in the area closer to the parent plant) can explain the spatial distribution of plant aggregation [21]. It is considered by the neutral theory: the plant community is just an accidental combination of species. The distance of seed propagation determines the pattern and degree of aggregation of the species. Other scholars believe that the characteristics of plant life history is the particularity in the relationship with the external environment and other functions, that is, species specialization. The aggregation distribution pattern of plants is due to the species specialization. Different species adapt to different habitats and are restricted by different habitat factors. Species coexist by occupying different resources and spaces [22]. The density constraint theory provides an explanation for the nonaggregation distribution pattern of species. This theory emphasizes that resource competition between neighbors and allelopathic effects (autotoxicity and other susceptibility effects) affect the survival of neighboring individuals of the same species or other species. So, the species can show a uniform or random distribution pattern. In recent years, the interpretation of the spatial distribution pattern of species is more and more inclined to the result of the combined effects of the three ecological processes of diffusion restriction, niche differentiation and density restriction [23]. Many analysis methods include chi-square test, block-size analysis of variance, species-juxtaposition, two-term local variance method, trend surface analysis, nearest neighborhood analysis, and point pattern analysis have been used to analyze the spatial pattern of plant populations [24].
2.2. Introduction to the BOA and RBOA
Inspired by spatial distribution pattern of plants, the BOA was proposed. The BOA is a kind of swarm intelligence algorithm. The individuals in the algorithm are represented as
The normal distribution is a kind of typical pattern of plant population. As an example, the BOA based on the normal distribution can be seen from the formula (2).
edge represents the edge distribution points of the problem domain.
Dmin represents the shortest Euclidean distance from
H(x) is a customized linear function.
Its probability density function can be seen from the formula (3).
At present, the research of BOA has completed the following contents, including the preliminary design and implementation of BOA [25], the preliminary convergence analysis of BOA [26], introducing the negative binomial distribution into BOA [27], chaotic BOA [28], and so on.
As a kind of swarm intelligence algorithms, in order to meet the operation requirements of swarm robots, the RBOA was proposed by adding novel mechanisms like free motion space strategy, scheduling strategy, population allocation model, and individual number allocation method [11]. When solving the target searching problems in complex environments, the experimental results of RBOA are better than that of A-RPSO. It is proved that the spatial distribution pattern of plants is a very good natural evolution experience and suitable for the research of swarm robotics. We will continue to work with ecologists to explore more population distribution models that are suitable for RBOA.
3. TARGET SEARCHING METHOD FOR SWARM UAVS BASED ON CAUCHY DISTRIBUTION
3.1. Major Improvements
Based on the research of spatial distribution pattern of plants and aggregate distribution, a kind of RBOA based on CRBOA is proposed. The main differences between CRBOA and RBOA are mainly the change of distribution models for the first phase searching and the refine searching.
3.1.1. Cauchy distribution for the first phase searching
The improvement of the BOA algorithm is basically based on the spatial distribution model of plants in nature. This research based on bionics often needs to cooperate closely with ecologists and carry out a large number of statistical experiments. Going “bionic” blindly may not get good results. Making full use of the statistical information provided by the population can effectively improve the performance of the algorithm [29]. Normal distribution is a typical model in the evolution pattern of the spatial distribution of plant populations, but a large amount of literature shows that Cauchy distribution can better balance the contradiction between local search and global search [30].
Compared with the 3-sigma principle of the normal distribution, the Cauchy distribution has more scattered values [31]. Therefore, the Cauchy distribution is used instead of the normal distribution to improve the global search ability of the RBOA algorithm, thereby improving the target search performance of the algorithm. In the RBOA algorithm, the expectations and variance of the normal distribution play an important role in how to effectively determine the search direction and search range of the population. However, the expectations and variance of the Cauchy distribution do not exist, but considering the probability density function in formula (4).
The median x0 and the scale parameter γ can reflect the concentration and dispersion of the probability density function.
The graph of the probability density function of the standard normal distribution and the Cauchy distribution meeting x0 = 0 and γ = 1 is shown in Figure 1.

Comparison of the probability density function of Cauchy distribution (x0 = 0, γ = 1) and standard normal distribution.
In the CRBOA, the individual is determined according to the parent and the Cauchy distribution model. The details of the Cauchy distribution can be seen from formula (4). The median x0 and the scale parameter γ are set as follows:
In the case of one parent, its offspring individuals are determined just by Cauchy distribution with x0 and γ. For multiple parents, the predetermined parent spacing threshold is used to further expand the working range of the swarm to improve their operational effectiveness in complex environments.
3.1.2. Normal distribution for the refine searching
Negative binomial distribution is a typical model of the spatial distribution pattern of plant populations in nature, as well as a typical model of plant abundance pattern. Suppose there is a separate set of Bernoulli numbers, and each experiment has two results, “success” and “failure.” The probability of success in each experiment is p, and the probability of failure is 1-p. In MATLAB software, when the predetermined number of “success” times reaches r times, the number of experiments will follow a negative binomial distribution: X ~ nbinrnd (r, p). A Bernoulli process is a discrete process. That is to say, the number of experiments, failures, and successes are all integers. Therefore, in RBOA, the output of nbinrnd needs to be converted to continuous waypoints within the target area based on the parent robot’s position. Although numerical conversion-based negative binomial distribution model has good experimental results, its setup is complicated, and the output of the distribution model brings damage to the natural meaning of the model.
The normal distribution is also a typical model of the spatial distribution pattern of plant populations in nature. It is an aggregated spatial distribution pattern like the negative binomial distribution, and it can easily generate data results that conform to physical meanings. Therefore, the normal distribution is used instead of the negative binomial distribution for the refine searching.
As shown in Figure 2, the parent uses a normal distribution to determine the path trajectories required for the refine searching within the target area. The specific steps are as follows:
The track point sequence of the parent is determined according to the normal distribution model N
where μi is the concentrated trend position. δi is the degree of dispersion of the distribution of track points. γ is the scale parameter of the target area. αγi is the customized offset with default value 1.The generated track points are randomly sorted and connected in order. The connected points form a random search path. The parent UAV moves along the search path to achieve detailed search operations within the target area.
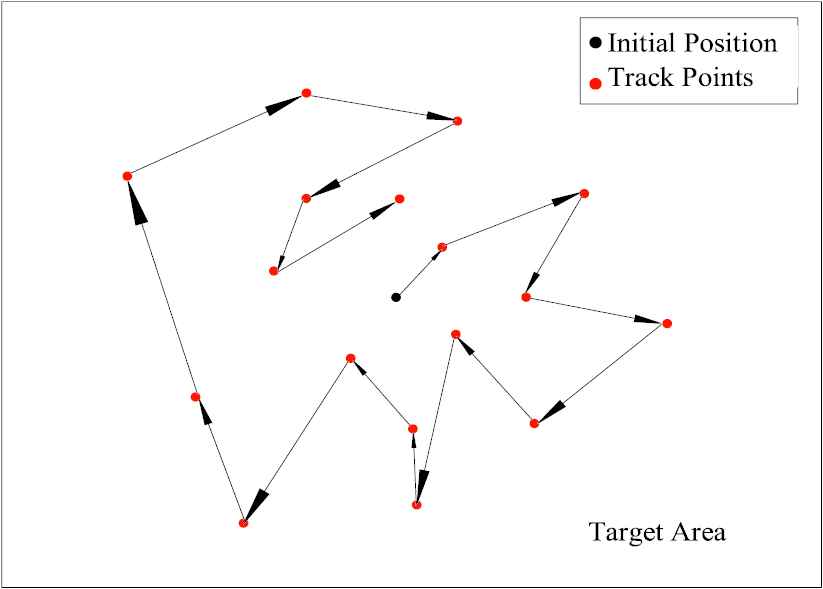
Refine searching in the target area. The red points are the generated track points. When they are connected, a random search path for the parent Unmanned Aerial Vehicle (UAV) is generated.
3.2. Algorithm Implementation
Based on the CRBOA, a swarm UAVs simulation based on CRBOA is constructed. The flowchart of CRBOA can be seen in Figure 3. The following steps are included in CRBOA:
Step 1. The swarm UAVs are initialized including the parameter settings of UAVs, Cauchy distribution and normal distribution.
Step 2. Begin population initialization. The individual UAVs are randomly distributed in the task area.
Step 3. Using each individual UAV as a control point, a Thiessen polygon is generated to divide the space into several independent regions. There is only one individual UAV in each region.
Step 4. In each independent region, a random search path for each individual UAV is generated. During the specified time, the individual UAV performs a search task in its independent region and determines its best fitness value before the end of the period [11].
Step 5. Begin the population evaluation. If the best target area is found or the end of search stage (first phase) is reached, go to Step 11.
Step 6. Based on the fitness values of the individual UAVs, the parent UAV (location) of the current swarm is selected. If the number of parent UAVs in the swarm exceeds one, the distance threshold between parent UAVs must be met.
Step 7. Set the parameters x0 and γ of Cauchy distribution base on the position of parent individual.
Step 8. The parent UAV generates the positions of its descendant individuals based on Cauchy distribution and its position.
Step 9. Individuals carry out positions scheduling according to the new position distribution [11].
Step 10. Go to Step 3.
Step 11. The track points for refine searching in the target area are generated by the normal distribution model.
Step 12. The search path for the parent UAV is generated by connecting the track points randomly. The parent UAV searches along the route to achieve detailed search operations.
Step 13. Update the best value.
Step 14. Go to step 11 until the optimal target meets the demand or the refine search phase ends.

Flowchart of Cauchy distribution and normal distribution (CRBOA).
4. EXPERIMENTS AND DISCUSSIONS
The experiments of target searching simulation were carried out to verify the effectiveness of CRBOA. We make the same simulation experiment assumptions as in reference [11]. The MATLAB R2015a and Multiparametric Toolbox 3.0. are used to write and run the experimental programs.
4.1. Experimental Description
The target search problem can be defined as Swarm UAVs with the ability of target information perception enter the unknown environment within the known range to search the target. In the search process, UAV is required to allocate search resources reasonably, determine the best search area online and determine the target location. Therefore, the target search simulation experiment is designed. The experimental environments are mainly constructed by the multimodal benchmark functions. This kind of functions usually has many local extremum points and it is not easy to find the global extremum point for most swarm intelligence algorithms in few iterations. A list of selected typical benchmark functions is provided in Table 1. The functions are marked as F6 to F10 from top to bottom. In the experiment, we set the global optimal extremum as the goal. The contour map of the function can be easily connected with the real target search environment, such as topographic map or pollutant concentration, and the target point can represent the lowest altitude or pollution source correspondingly. Swarm UAVs can move freely in the environment and is abstracted as a group of points.
| Function Name | Mathematical Representation | Initial Range | Best Value |
|---|---|---|---|
| Shaffer’s F6 | [−600, 600]2 | 0 | |
| Quartic | [−1.28, 1.28] n | 0 | |
| Schwefel 2.26 | [−500, 500] n | −837.966 | |
| Rastrigin | [−5.12, 5.12] n | 0 | |
| Ackley | [−32, 32] n | 0 |
Benchmark functions.
Many swarm intelligence algorithms are used in target searching. A comparison of some intelligent algorithms was made in references [11,32,33], concluding that RBOA and A-RPSO performed better. In the experiment, we will compare the performance of CRBOA with that of RBOA and A-RPSO.
The common settings for the three algorithms include the following:
The number of UAVs: popsize = 10.
The maximum number of evolutionary generations: maxgen = 20.
The stop condition: the number of evolutions reach maxgen or the target value has been met.
The number of experimental repetitions: niter = 50.
The other parameters of the algorithms are set as Table 2.
| CRBOA | RBOA | A-RPSO |
|---|---|---|
|
|
|
A-RPSO, adaptive robotic particle swarm optimization; RBOA, robot bean optimization algorithm; CRBOA, Cauchy distribution and normal distribution; UAV, Unmanned Aerial Vehicle.
Parameter settings of each algorithm.
4.2. Experimental Results
The Tables 3–8 lists the average results (Average), standard deviations (Stdev), optimal results (Min), worst results (Max), evolutionary generations (Gen), and success rate (Success) respectively for CRBOA, RBOA, and A-RPSO after 50 runs for each function.
| Algorithm | F6 | F7 | F8 | F9 | F10 |
|---|---|---|---|---|---|
| CRBOA | 8.17E–3 | 1.76E–03 | –8.36E+02 | 2.17E–02 | 2.58E–02 |
| RBOA | 8.42E–3 | 1.85E–03 | –8.21E+02 | 2.93E–02 | 2.59E–02 |
| A-RPSO | 2.17E–2 | 1.94E–02 | –6.12E+02 | 2.04E+00 | 2.13E–01 |
CRBOA, Cauchy distribution and normal distribution.
Comparisons between CRBOA and other algorithms for average.
| Algorithm | F6 | F7 | F8 | F9 | F10 |
|---|---|---|---|---|---|
| CRBOA | 3.38E–03 | 1.09E–03 | 1.67E+01 | 2.34E–02 | 1.61E–02 |
| RBOA | 3.28E–03 | 1.17E–03 | 4.15E+01 | 2.49E–02 | 1.79E–02 |
| A-RPSO | 1.26E–02 | 1.90E–02 | 1.12E+02 | 2.23E+00 | 4.98E–01 |
Comparisons between CRBOA and other algorithms for Stdev.
| Algorithm | F6 | F7 | F8 | F9 | F10 |
|---|---|---|---|---|---|
| CRBOA | 5.52E–05 | 8.54E–05 | −8.38E+02 | 1.77E–04 | 5.68E–03 |
| RBOA | 6.34E–05 | 1.88E–04 | −8.38E+02 | 5.84E–04 | 4.89E–03 |
| A-RPSO | 9.72E–03 | 1.16E–03 | −8.38E+02 | 1.07E–02 | 8.29E–03 |
Comparisons between CRBOA and other algorithms for min.
| Algorithm | F6 | F7 | F8 | F9 | F10 |
|---|---|---|---|---|---|
| CRBOA | 9.75E–03 | 5.31E–03 | −7.20E+02 | 8.69E–02 | 7.93E–02 |
| RBOA | 9.82E–03 | 4.56E–03 | −7.20E+02 | 1.41E–01 | 8.72E–02 |
| A-RPSO | 4.88E–02 | 8.14E–02 | −3.97E+02 | 1.25E+01 | 2.60E+00 |
Comparisons between CRBOA and other algorithms for max.
| Algorithm | F6 | F7 | F8 | F9 | F10 |
|---|---|---|---|---|---|
| CRBOA | 1.92E+01 | 1.43E+01 | 5.52E+00 | 9.64E+00 | 9.48E+00 |
| RBOA | 1.96E+01 | 1.45E+01 | 6.04E+00 | 9.82E+00 | 1.31E+01 |
| A-RPSO | 2.00E+01 | 1.97E+01 | 1.95E+01 | 1.82E+01 | 1.61E+01 |
Comparisons between CRBOA and other algorithms for gen.
| Algorithm | F6 | F7 | F8 | F9 | F10 |
|---|---|---|---|---|---|
| CRBOA | 18% | 64% | 98% | 100% | 100% |
| RBOA | 14% | 66% | 86% | 100% | 100% |
| A-RPSO | 0% | 8% | 6% | 24% | 60% |
Comparisons between CRBOA and other algorithms for success.
The function F9 is a typical multimodal function and its figure can be seen from Figure 4. It is selected to visualize the target search process of CRBOA and A-RPSO in order to show the search process more vividly. The experiment screenshots are shown in Figures 5 and 6. The bottom graphs of Figures 5 and 6 are the contour plots of the F9 function. The target point is at coordinates (0, 0). The colored area block in Figure 6 are free motion areas constructed dynamically for individuals based on the Thiessen polygon.
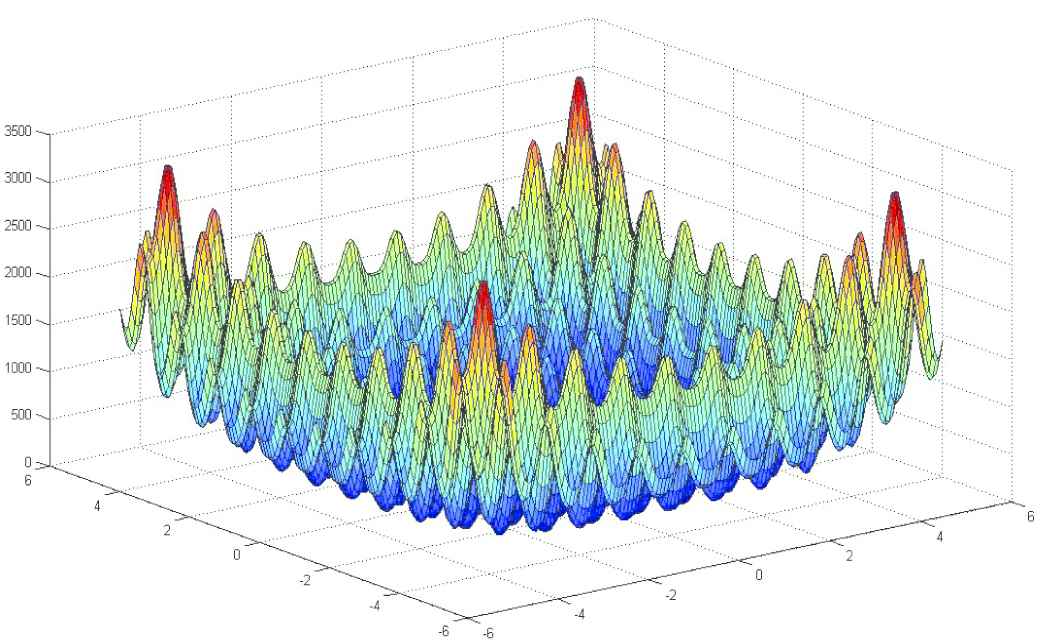
Figure of function Rastrigin (F9).
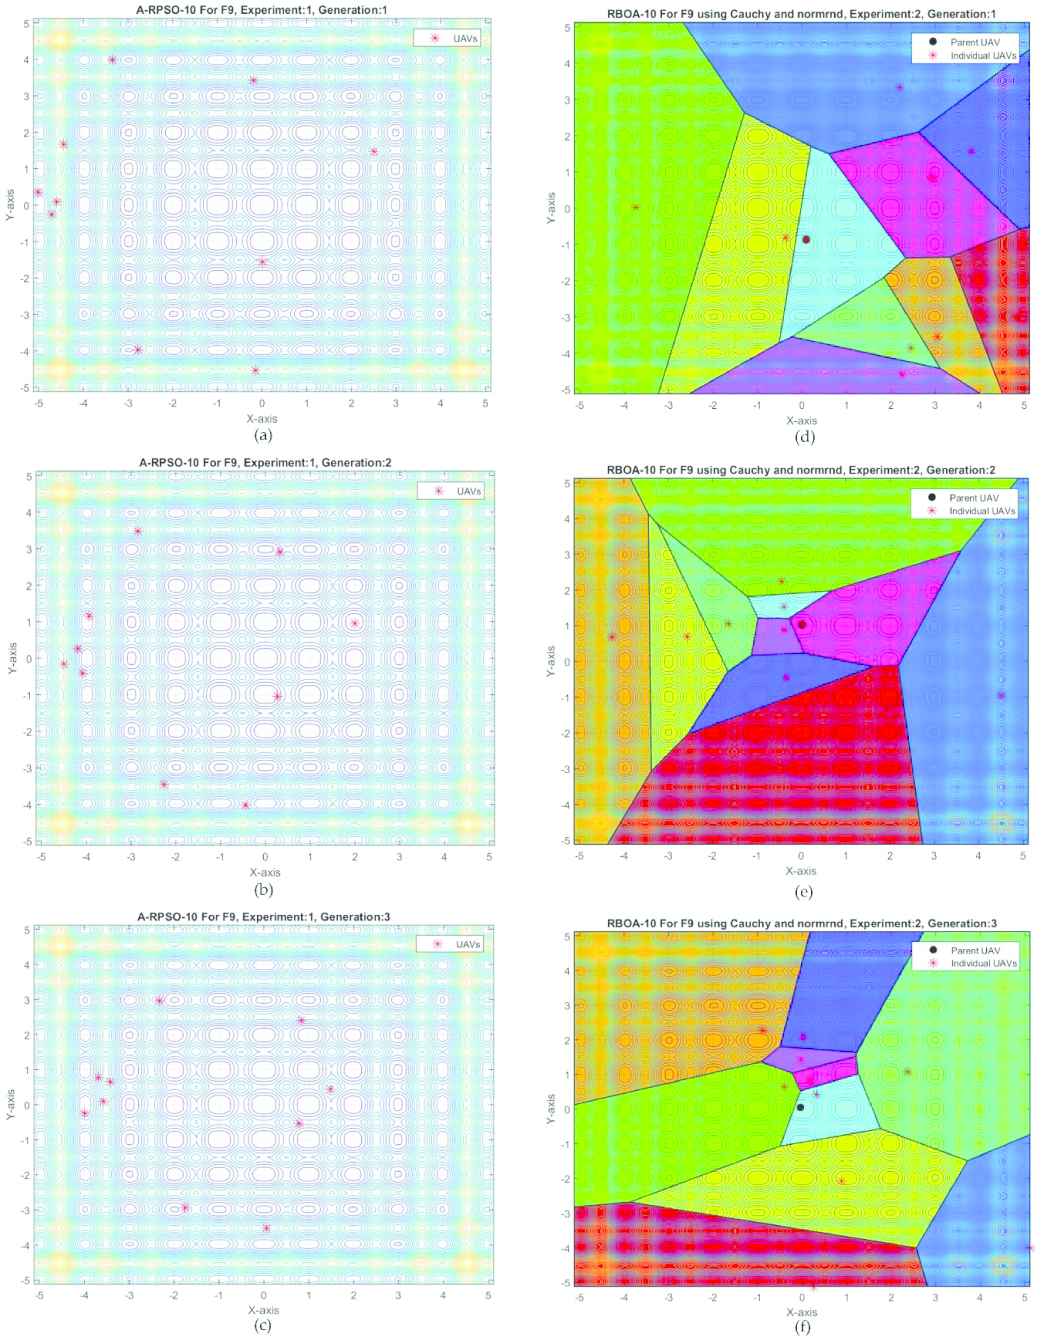
Screenshot of search effect comparison between Cauchy distribution and normal distribution (CRBOA) and adaptive robotic particle swarm optimization (A-RPSO) of the first three generations.
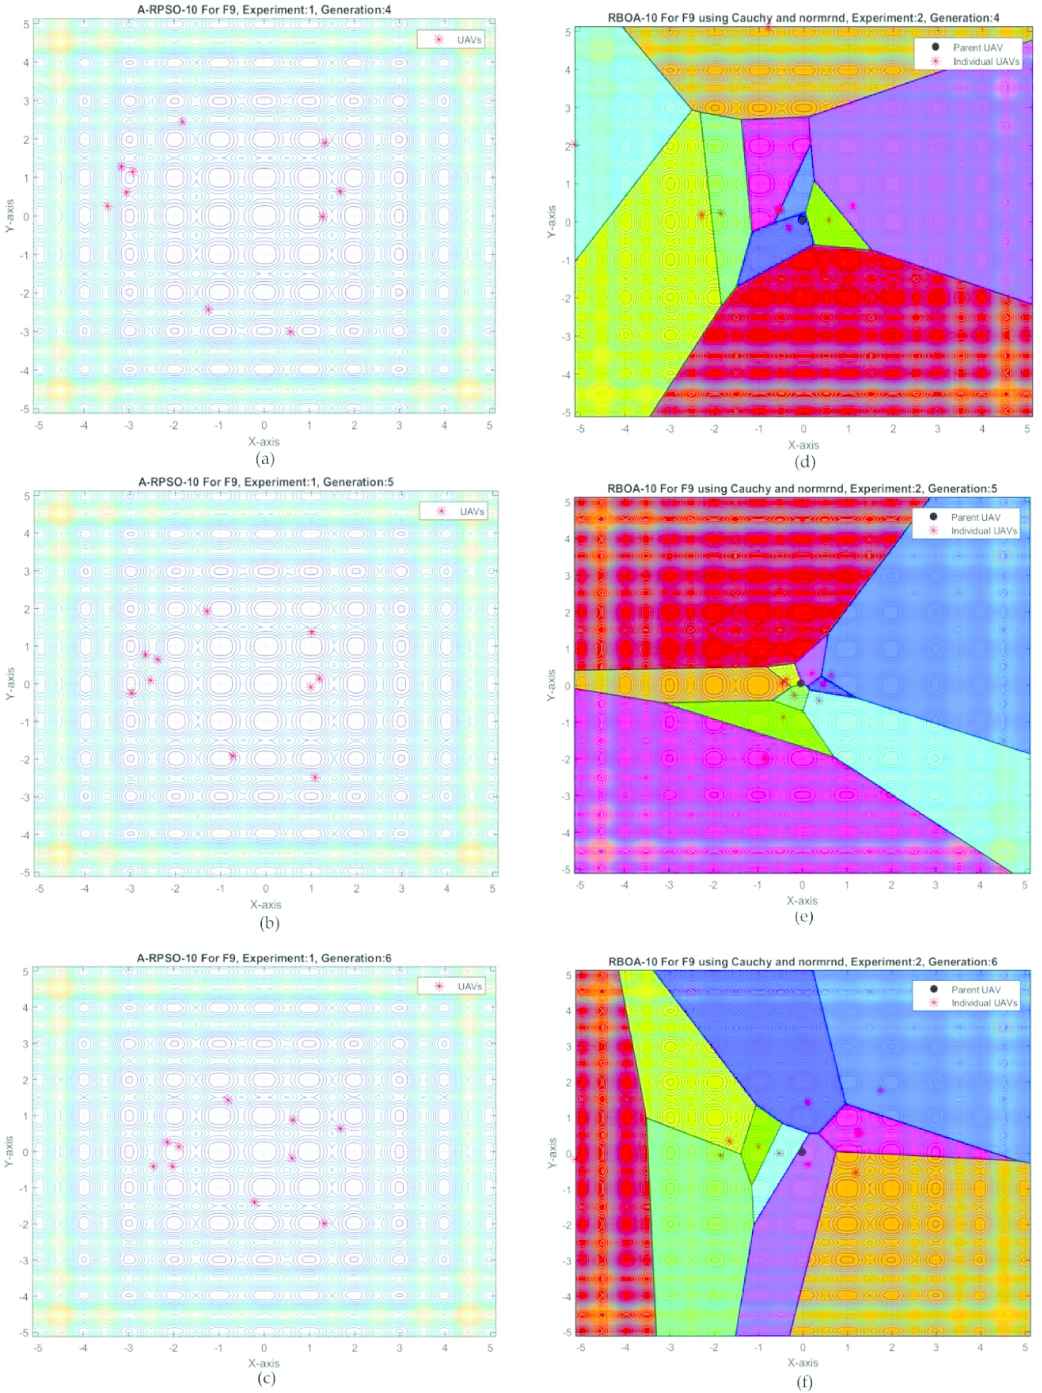
Screenshot of search effect comparison between Cauchy distribution and normal distribution (CRBOA) and adaptive robotic particle swarm optimization (A-RPSO) of the following three generations.
The A-RPSO-10 represents A-RPSO algorithm with population size of 10. The CRBOA-10 represents CRBOA algorithm with population size of 10. “Experiment: x” represents that it is the xth experiment. “Generation: y” represents that it is the yth generation.
In Figure 5, the subfigures (a), (b), and (c) are the search states of the first generation, the second generation, and the third generation of A-RPSO-10, respectively. The subfigures (d), (e), and (f) are the search states of the first generation, the second generation, and the third generation of CRBOA-10, respectively.
In Figure 6, the subfigures (a), (b), and (c) are the search states of the fourth generation, the fifth generation, and the sixth generation of A-RPSO-10, respectively. The subfigures (d), (e), and (f) are the search states of the fourth generation, the fifth generation, and the sixth generation of CRBOA-10, respectively.
4.3. Analysis and Discussions
4.3.1. Analysis of experimental results
From the experimental results, the following analysis results can be found.
The CRBOA obtained relatively optimal values related with average results. The RBOA got better average results than A-RPSO.
The CRBOA obtained smaller values of Stdev in F7, F8, F9, and F10, while RBOA achieved smaller Stdev in F6. A-RPSO did not perform well.
The CRBOA got better values of Min in F6, F7, F8, and F9, while RBOA obtained better values of Min in F10. A-RPSO did not perform well.
The CRBOA obtained better values in functions F6, F8, F9, and F10, while RBOA achieved better values in functions F7. A-RPSO did not perform well.
In terms of the average generations, under the same experimental conditions, the average number of evolutionary generations of CRBOA is relatively minimum, RBOA is next, and A-RPSO is the largest.
In terms of the success rate, it can be seen that CRBOA obtained the highest success rate in F6, F8, F9, and F10, while RBOA got the highest success rate in functions F7, F9, and F10. It is worth mentioning that for functions F9 and F10, CRBOA and RBOA have achieved the highest success rate of 100%. A-RPSO did not perform well.
As can be seen from Figure 5, CRBOA quickly found the suspected target area in the third generation. But the search efficiency of A-RPSO is low. As can be seen from Figure 6, in the next three generations, most individuals in the CRBOA were arranged to search for suspected target areas, but did not give up searching for other areas. In the sixth generation, CRBOA identified the target area. Also, in the sixth generation, A-RPSO has not entered the large-scale circle of the target area.
4.3.2. Discussions
Cauchy distribution can better balance the contradiction between local search and global search. Compared with normal distribution, Cauchy distribution takes more global information into account and improves the global search ability of the algorithm. It is combined with the free motion space mechanism to further improve the performance of CRBOA. Therefore, CRBOA is superior to the other two algorithms in almost all aspects of the experiments.
With the same population size, RBOA and CRBOA can perform target search better than A-RPSO mainly because of the free motion space partitioning and free exploration mechanism as described in reference [11]. So RBOA and CRBOA can generally find the target area more accurately and quickly than A-RPSO.
The refine searching mechanism of CRBOA and RBOA is effective. This mechanism allows them to find the target point faster in the target area. However, the negative binomial distribution model of RBOA requires model transformation, which increases the complexity of the model. The normal distribution model of CRBOA has achieved the same excellent refine searching effect on the premise that it is easier to use than negative binomial distribution.
Although both CRBOA and RBOA can theoretically find the optimal target in a complex environment, they also caused trapping in a local optimal region occasionally in the experiments because the time of searching in the free motion space is not long enough. Therefore, increasing the time of such actions will reduce or even eliminate local traps.
The mechanism of free motion space fully considers the feasibility of real swarm robotics experiments. This mechanism, in combination with scheduling control strategy, can reduce the distance between theoretical simulation experiments and real swarm robotics experiments. Some swarm algorithms, like PSO, often appears the state of individual high-density aggregation or even overlapping, which is conducive to local search, but cannot be realized in real robot experiments.
From the experimental results, the performance of CRBOA is similar to that of RBOA, and the performance of CRBOA is slightly better. From the characteristics of Cauchy distribution, CRBOA is more suitable for the situation of more complex search environment and less time requirement.
5. CONCLUSIONS
Aiming at the problem of swarm UAVs target searching in complex and unknown environments, this paper explores more search models suitable for swarm robotics by investigating the spatial distribution patterns of plant populations. The target searching model based on Cauchy distribution is mainly constructed to replace the normal distribution model, which improves the global search ability and search efficiency of the swarm robots. At the same time, in order to solve the problem of poor usability of the negative binomial distribution during the refine search phase in the target region, the algorithm replaces the negative binomial distribution with the normal distribution, which improves the usability of the model while ensuring the performance of refine searching. Comparative experiments with RBOA and A-RPSO show that CRBOA algorithm can give a better performance to the exploration and searching. The search performance and efficiency of CRBOA were improved, and the effectiveness of CRBOA was verified. The CRBOA can also be applied in the problem of swarm Autonomous Underwater Vehicles (AUVs) target searching.
For future work, we will continue to explore excellent spatial patterns and abundance patterns of plant populations, and build more population distribution patterns suitable for swarm robotics. At the same time, we will continue to carry out various swarm robotics target search experiments, including multi-target search and real swarm robotics experiments. We hope that the CRBOA and RBOA algorithms can be extended to more swarm robotics fields.
CONFLICTS OF INTEREST
The authors declare no conflict of interest.
AUTHORS' CONTRIBUTIONS
All authors contributed to the work. All authors read and approved the final manuscript.
ACKNOWLEDGMENTS
This research was funded by Qinghai Science Foundation under grant number 2020-ZJ-913, Qinghai Key Research and Development project under grant number 2020-QY-213, Qinghai Science and Technology Basic Condition Platform under grant number 2019-ZJ-T01, and Qinghai Enterprise Technology Innovation Fund Plan under grant number 2019-SF-172.
SUPPLEMENTARY MATERIALS
The videos of simulation experiment are available online at https://share.weiyun.com/5VEJy2u.
REFERENCES
Cite this article
TY  - JOUR
AU  - Xiaoming Zhang
AU  - Yongqiang Hu
AU  - Tingjuan Li
PY  - 2020
DA  - 2020/11/17
TI  - A Novel Target Searching Algorithm for Swarm UAVs Inspired From Spatial Distribution Patterns of Plant Population
JO  - International Journal of Computational Intelligence Systems
SP  - 159
EP  - 167
VL  - 14
IS  - 1
SN  - 1875-6883
UR  - https://doi.org/10.2991/ijcis.d.201109.001
DO  - 10.2991/ijcis.d.201109.001
ID  - Zhang2020
ER  -