
Research on Customer Satisfaction Based on Multidimensional Analysis

- DOI
- 10.2991/ijcis.d.210114.001How to use a DOI?
- Keywords
- Online reviews; Sentiment analysis; Customer satisfaction; Kano model; Multidimensional analysis
- Abstract
Sentiment analysis has been extensively studied recently for developing methodologies to automatically extract information from online reviews, which is important for manufacturers to improve their products or services. Unfortunately, most of current studies don’t take several key factors (e.g., sentiment strength, background of customer) into account. In this study, after building feature, sentiment, and degree vocabulary from online reviews using part-of-speech and word similarity analysis, a review-feature sentiment value (R-FSV) matrix is developed and classified by a model combining the long short-term memory and gated recurrent unit ensemble. The R-FSV matrix and online rating associated with the review are analyzed by a multivariate linear regression model to derive customer satisfaction. Since the sentiment values for each feature of the product are calculated with consideration of sentiment strength, more accurate sentiment orientation is obtained for each review, which is used to develop a set of rules to identify customer requirements based on the Kano model. By taking into account of both product perspective (e.g., product upgrade) and customer perspective (e.g., background of customers), a multidimensional analysis model is proposed to further analyze customer requirements. This sheds light on the dynamic and diversity of customer satisfaction, which help manufacturers to gain insight on not only how the customer satisfaction correlates with product improvements, but also how to develop products for particular group of customers. The proposed method is deployed to study the online reviews of mobile phones from one of the main e-commerce companies in China (i.e., JD.com). The results show that our method is capable to identify the change of customer requirements over time and the preferences of different types of users (i.e., iOS or Android). Hence, the proposed method is more effective in extracting information from the online reviews for manufacturer to improve customer satisfaction efficiently.
- Copyright
- © 2021 The Authors. Published by Atlantis Press B.V.
- Open Access
- This is an open access article distributed under the CC BY-NC 4.0 license (http://creativecommons.org/licenses/by-nc/4.0/).
1. INTRODUCTION
With the rapid development of e-commerce, online shopping has gradually become the preferred shopping method for most people. Therefore, online customer reviews have become a very important part of each e-commerce website, which not only helps customers to choose products, but also helps manufacturers to improve products based on customer feedbacks in a timely manner. However, it is rather difficult to extract sufficient information from a large number of online reviews in a short period of time using manual methods. Therefore, methodologies that can automatically extract information from the online reviews are urgently needed. Since sentiment analysis is a key step to achieve automatic inquiry of information from text, including online reviews, the research of sentiment analysis especially for online reviews has attracted great attention, recently. Various methods have been developed for sentiment analysis, such as methods based on sentiment dictionary [1], machine learning methods [2–4], and deep learning methods [5,6].
Furthermore, some scholars proposed to use sentiment orientation of customers, obtained by the sentiment analysis, to model customer satisfaction, and derive customer requirements for a product or service [7–9]. Decker and Trusov [10] calculated the impact of customer sentiment orientation about product features for customer satisfaction analysis using Possion regression model, negative binomial regression model, as well as latent class Poisson regression model, and discovered that the negative binomial regression model was better than the other two models. Qi et al. [11] proposed a method to extract customer requirements from online reviews for product improvements. This method firstly analyzes the helpfulness of reviews, which identifies the reviews that are helpful for product improvements, secondly uses the latent dirichlet allocation (LDA) method to obtain the features of the product, thirdly applies the dictionary-based sentiment classification method to obtain the sentiment orientation of each feature, fourthly deploys a method based on conjoint analysis to determine the weight of each feature of the product, and finally uses a multivariate linear regression (MLR) model to calculate the customer sentiment orientation of product features in the perspective of customer satisfaction. Xiao et al. [12] determined the customer sentiment preference for each product feature based on semi-structured data, then obtained the customer preference for each product feature from online reviews according to the modified ordered choice model (MOCM), and finally deployed a marginal effect-based Kano model (MEKM) to classify the customer sentiment preferences. Bi et al. [13] proposed a model based on ensemble neural network model (ENNM) to measure the impact of customer sentiment orientation of each product feature on customer satisfaction analysis, and an effect-based Kano model (EKM) to classify each factors that influence the customer satisfaction.
However, most studies for the sentiment orientation only focus on identifying positive and negative sentiments of online reviews, without consideration of the sentiment strengths. Furthermore, most studies only investigate customer satisfaction from one dimension (e.g., without considering the difference background of customers), and fail to take into account that changes induced by product’s upgrade, which is likely to change the classification of product feature. This reduces the effectiveness of sentiment analysis in capturing the sentiment orientation of customers. In addition, most sentiment orientation studies do not take into account the background of customers. However, it is well known that different customers (e.g., users of android or iOS system) possess quite different taste or expectation for each feature of the product. If treating all customer reviews undifferentiatedly, it is hard to obtain useful information from the reviews for manufacturer to cost-effectively design or improve products.
In this study, we propose a method to analyze customer satisfaction and requirements from multiple dimensions, based on the sentiment analysis with consideration of the strengths of sentiment. Comparing to the prior studies, the main contributions of this study are (1) the degree words that representing the strength of sentiment are added in our model to calculate customer sentiment value. By analyzing specific sentiment value and developing a customer satisfaction model, we can extract more information from the online reviews, which will help manufacturers to make more effective improvements for products or services. (2) The customer satisfaction is analyzed from both product and customer perspective. The proposed multidimensional analysis is mainly based on the following two considerations: the dynamic and diversified characteristics of customer satisfaction. On one hand, the customer satisfaction changes over time (e.g., emerging of new products). By studying the online reviews of two generations of products, it is capable to grasp the dynamic properties of customer satisfaction, especially how the product improvements (e.g., change of appearance, adding new features) correlate with customer satisfaction, and gain further insight on the classification of customer requirements, which is helpful for manufactures to prioritize product improvements. On the other hand, the customer satisfaction is quite dissimilar for different customers. By analyzing the online views with consideration of the segmentation of customers, we can better understand the requirements of specific groups of customers, and help manufacturers to tailor products for particular customers, thereby more effectively improve customer satisfaction.
This paper is organized as follows: Section 2 introduces the general framework of this study. Section 3 presents the theoretical methods used in this study and Section 4 verifies the effectiveness of the proposed method by a case study. Finally, Section 5 summarizes the significance and limitations of this study.
2. RESEARCH FRAMEWORK
The research framework of this paper is shown in the Figure 1. This research mainly includes four parts: sentiment analysis, customer satisfaction modeling, customer requirement identification, and multidimensional analysis of customer requirements. The content of each part is described below.
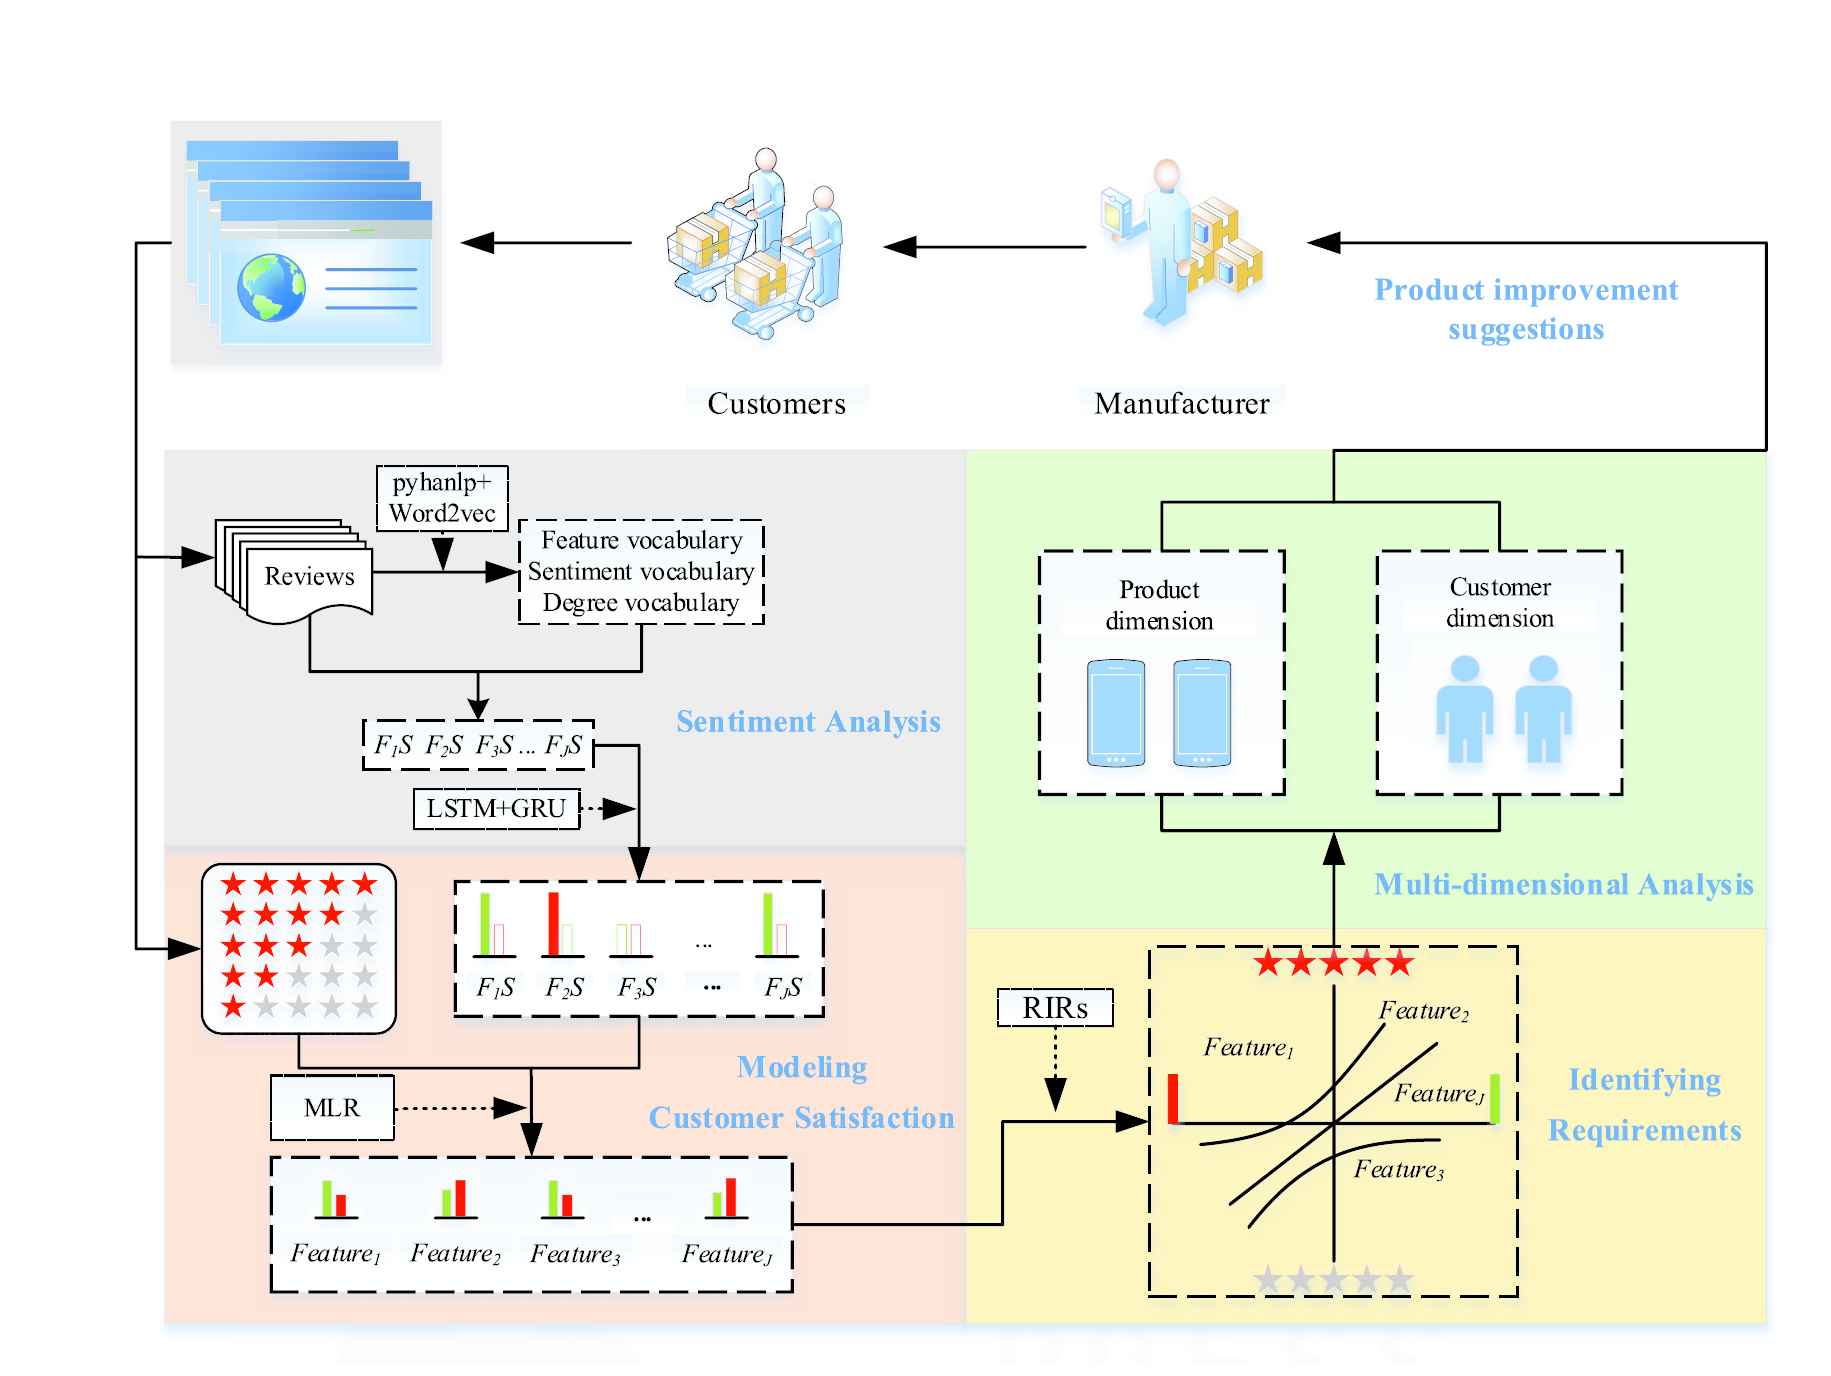
A framework for this study that includes four parts, namely sentiment analysis, customer satisfaction modeling, customer requirements identifying, and multidimensional analysis, for providing suggestions for product or service improvements.
In the first part, sentiment analysis is performed after preprocessing of reviews and feature extraction. To be more specific, the first step is to extract feature words, sentiment words, and degree words from the reviews to construct corresponding vocabularies, based on part-of-speech and word similarity analysis. In order to improve the accuracy of the extraction, the general HowNet dictionary is used to supplement the sentiment vocabulary and the degree vocabulary. The second step is to extract the <feature, (degree word), sentiment word> (FS) pairs from the reviews based on the constructed vocabulary, and develop a review-feature sentiment word (R-FSW) matrix. The third step is to calculate the sentiment value using the long short-term memory (LSTM) [14] and gated recurrent unit (GRU) ensemble sentiment classifier, and build a review-feature sentiment value (R-FSV) matrix.
In the second part, a customer satisfaction model is proposed, based on a MLR model, in which the R-FSV matrix is used as the explanatory variable and the review ratings is used as the response variable. The results shed light on the relationship between the sentiment values and the customer satisfaction.
In the third part, a set of requirement identification rules (RIRs) is proposed, based on the Kano model. Then, the type and priority of each feature obtained in the second part is identified.
A multidimensional analysis method is proposed in the fourth part to analyze the requirements from the customer and product perspective, which factors in both dynamic and diversified characteristics of customer satisfaction. The results offer direction for product improvement, which is of great importance for manufacturers.
Overall, the proposed framework provides a comprehensive method to obtain customer sentiment from online reviews with consideration of the degree vocabulary (i.e., strength of sentiment), therefore, result in a better characterization of customer requirement by taking into account of both background of customers and evolution of their satisfaction. The guidance for product or service improvements provided by this framework allows manufacturers to design, improve, and upgrade products or services more effectively, which lead to better customer satisfaction.
3. METHOD
3.1. Feature-Sentiment Word Pair Extraction
Generally, features, sentiment, and degree words are extracted according to the extraction rules based on part-of-speech, syntactic structure, and the results of dependency syntax analysis [15,16]. In this study, the feature vocabulary, sentiment vocabulary, and degree vocabulary are supplemented by the general HowNet dictionary. Then, the <feature, (degree word), sentiment word> (FS) is developed, while the classification of sentiment words is performed by a deep learning method.
3.2. Sentiment Analysis
The current methods for sentiment analysis can be divided into three categories: methods based on sentiment dictionaries; machine learning methods, such as Naive Bayes classifier (NBC) [17] and support vector machines (SVMs) [18]; deep learning methods, such as LSTM and GRU. Since deep learning methods have advantages in dealing with complex problems and text classification, this study develops a LSTM + GRU ensemble classifier for the sentiment analysis, which has better overall performance than NBC, SVM, LSTM, and GRU. Note that NBC and SVM show better performance in some aspects as will be further discussed in Section 4 [19,20]. The comparison of each method is shown in Table 1.
| Methods | Advantages | Disadvantages |
|---|---|---|
| Based on sentiment dictionaries | The model is simple and easy to understand. | The semantic environment of the context is ignored. For different fields, the dictionary of related fields needs to be expanded, which requires more time and resources. |
| NBC | The model is simple and the classification accuracy is high. | The conditions of independent assumptions must be satisfied. |
| SVM | It overcomes the problems of “dimension disaster” and “overfitting.” | If the number of inputs is too big, the amount of calculation is significantly increase, resulting in an increase of training time. |
| LSTM | It can handle long-term-dependent problems, effectively avoids problems such as gradient disappearance or gradient explosion, and is suitable for processing long text data. | As the number of neural network layers increases, the model becomes more complex. |
| GRU | While maintaining the effectiveness of LSTM, the model structure is simplified, which decreases resources needed in the calculation process, and boosts the training speed and the expressive ability of the model. | As the number of neural network layers increases, the model becomes more complex. |
NBC, Naive Bayes classifier; SVM, support vector machines; LSTM, long short-term memory; GRU, gated recurrent unit.
Comparison of sentiment analysis methods.
The goal of sentiment analysis is to obtain the sentiment orientation of customers for each feature of a product, therefore discover the deficiencies of the product. For example, the sentiment analysis of the online reviews for a hotel can reveal factors that affect the customer experience, which is of great significance for improving the hotel services [21]. The sentiment analysis of online reviews posted in an e-commerce sites (e.g., Amazon.com) helps to predict consumer requirements and improve the products and services [22]. However, it is generally ineffective to extract the needed information from online reviews using solely the sentiment analysis. Therefore, this study further analyzes the relationship between customer sentiment orientation and customer satisfaction (e.g., online ratings for the product).
3.3. Analysis of the Influence of Customer Sentiment Orientation on Customer Satisfaction
3.3.1. Introduction to the related matrix
By combining the rules of forward search and backward search, we extracted the relevant features and corresponding sentiment words from each review, and obtained the R-FSW matrix. The
In order to further analyze the impact of customer’s positive and negative sentiments on their satisfaction, the R-FSV matrix is divided in more details, according to rules shown in Table 2, where Smj, Pmj, and Nmj denotes the overall, positive, and negative sentiment value of the jth feature of the mth review, respectively. This leads to a R-FSV matrix as shown in Table 3.
| Rules |
|---|
| if Smj> 0, then Pmj= Smj, Nmj= 0 |
| if Smj< 0, then Pmj= 0, Nmj= |Smj| |
| if Smj is missing, then Pmj= 0, Nmj= 0 |
The segmentation rules for sentiment values.
| Review/Feature | f1 |
f2 |
… |
fJ |
||||
|---|---|---|---|---|---|---|---|---|
| P1 | N1 | P2 | N2 | … | … | PJ | NJ | |
| R1 | P11 | N11 | P12 | N12 | … | … | P1J | N1J |
| R2 | P21 | N21 | P22 | N22 | … | … | P2J | N2J |
| … | … | … | … | … | … | … | … | … |
| RM | PM1 | NM1 | PM2 | NM2 | … | … | PMJ | NMJ |
The review-feature sentiment value (R-FSV) matrix.
3.3.2. Customer satisfaction modeling
The MLR model is commonly used to describe the random linear relationship between the response and explanatory variable, due to its good interpretability for the results. Hence, this study uses MLR to analyze the influence of customer sentiment on customer satisfaction, the regression equation of the model is
| Feature | f1 |
f2 |
… |
fJ |
||||
|---|---|---|---|---|---|---|---|---|
| P1 | N1 | P2 | N2 | … | … | PJ | NJ | |
| W | wP1 | wN1 | wP2 | wN2 | … | … | wPJ | wNJ |
The influence of sentiment orientation on customer satisfaction.
Because the sentiment value of each feature might have different ranges, in order to make the result more comparable, the raw data is standardized using Z-score, before being processed by the regression model. Note that the standardized data conforms to the standard normal distribution with mean value of 0 and a standard deviation of 1.
3.4. Customer Requirement Identification
Through the MLR model, the impact of customer’s positive and negative sentiments on customer satisfaction values
| Impact | Description |
|---|---|
| If the customer requirements are met, the customer satisfaction will increase. | |
| Even if the customer requirements are met, it does not improve customer satisfaction. | |
| Representing that the customer’s negative sentiments will not reduce customer satisfaction. | |
| If the customer requirements are not met, the customer satisfaction will decrease. |
Description of the influence of sentiment orientation on satisfaction.
Kano et al. [23] divides customer requirements into five categories according to the relationship between customer requirements and customer satisfaction: must-be, performance, excitement, reverse, and indifferent requirements. This study allocates each requirement into appropriate category using a method that combines Kano model with multivariate regression (MRKM). The boundary conditions for each requirement category in MRKM model are shown in Table 6.
| Details | Requirement Category |
|---|---|
| if |
Must-be requirements |
| if |
Reverse requirements |
| if |
Performance requirements |
| if |
Excitement requirements |
| If |
Indifferent requirements |
Recognition method for classifying the customer requirements.
The normalization of absolute difference of
3.5. Multidimensional Analysis of Customer Requirements
In order to further understand customer requirements, this study extracts customer requirements from both product and customer perspectives, based on a multidimensional analysis. The perspective of product mainly refers to the dynamic behavior of the customer requirements, which change over time, especially after product update/upgrade or emerging of new competitive products. The perspective of customer mainly refers to the diversified requirements for different groups of customers, which develops more and more subtle in the era of e-commerce. By analyzing the online reviews from both the product and customer perspectives, more comprehensive knowledge about customer requirements can be obtained. Hence, through multidimensional analysis, manufacturers not only understand the deficiencies of products or services, but also comprehend the specific requirements of particular group of customers. This offers a better guidance for product improvement and design, thereby enhances customer satisfaction more effectively.
4. CASE STUDY
4.1. Collecting Data
In this study, we chose the online reviews of mobile phones as the research object. To be more specific, the reviews of Nova 5 Pro and Nova 6 in Huawei Nova series from one of the largest e-commerce platforms: Jindong Mall (https://jd.com) are investigated. The crawled content includes 11 aspects for each review: name of reviewer (e.g., whether it is anonymous), membership (e.g., whether it is a Plus member), devices used to post reviews (e.g., iOS or Android), information about the product (e.g., color, size of memory, etc.), content of the review, rating (e.g., customers score), number of responses, preference of the review (i.e., usefulness of the review), date of posting the review, number of pictures included in the review, and whether the review is accompanied by video. After prescreening (e.g., removing duplicated reviews), 10387 reviews were obtained for the following investigation.
4.2. Word Extraction
Firstly, based on the method introduced in Section 3.1, we constructed the feature vocabulary, sentiment vocabulary, and degree vocabulary. The results of 10 categories of feature words are shown in Table 7, while the sentiment vocabulary and degree vocabulary are in Table 8. Secondly, the <feature, (degree word), sentiment word> (FS) pairs extraction is performed.
| Features | Subordinate Feature Words | Descriptions |
|---|---|---|
| Performance | Operating speed, system, processor, Kirin 980, response time, memory, etc. | Words relating to the performance of the phone, such as the fluency of use and the configuration of the phone, etc. |
| Camera | Camera, pixel, rear camera, photo, lens, front camera, image, quality, etc. | Words relating to functions and description of photography. |
| Appearance | Appearance, shape, color, body design, size, style, weight, etc. | Words relating to the appearance of the phone. |
| Battery | Battery, fast charging, standby time, charging time, charger, battery lifetime, power consumption, etc. | Words related to performance of battery, such as the standby time and battery lifetime. |
| Screen | Screen, resolution, saturation, graininess, etc. | Words relating to the screen of phone. |
| Sound | Sound effects, sound quality, sound, headphones, stereo, etc. | Words relating to the sound quality. |
| Unlocking | Fingerprint, fingerprint unlocking, face recognition, unlocking, sensitivity, facial recognition, etc. | Words relating to how the phone is unlocked. |
| Overall | Mobile phones, commodities, things, products, new machines, etc. | Words relating to the overall feeling of the phone. |
| Price | Cost-effective, price, etc. | Words relating to the price of the phone. |
| Service | Logistics, packaging, express delivery, service attitude, customer service, etc. | Words relating to third-party services, such as shipping and customer service. |
The feature words of mobile phones and corresponding descriptions
| Sentiment Words | Degree Words |
|---|---|
| Beautiful, good, comfortable, adequate, good-looking, sensitive, durable, satisfied, disappointed, like, fit, perfect, fast, slow, poor, bulky, easy to use, agile, hot, slim, etc. | Percentage, most, extreme, extremely, very, real, too, super, especially, quite, more, relatively, general, full, slightly, somewhat, a little, etc. |
The sentiment words and degree words for mobile phone.
4.3. Sentiment Analysis
4.3.1. Sentiment classifiers
Part of the extracted feature-sentiment word pairs, including 1000 pairs of positive sentiment words and 1000 pairs of negative sentiment words, was manually labeled. Afterward, the word pairs were analyzed using the LSTM + GRU model. A set of classifiers (i.e., NBC, SVM, LSTM, and GRU) were employed to compare their performance. As reported by other literatures, the grid search and cross-validation [24–27] was applied to optimize the parameters for each classifier. The general idea is to first setup a list of all possible combinations of the parameters, then use grid search to iterate over all combination, finally derive the best combination using cross-validation (e.g., comparing performance of the classifier with different parameters). The relevant parameters and performance indicators of each classifier are shown in Tables 9 and 10, respectively.
| Methods | Parameters |
|---|---|
| NBC | Smoothing factor: Laplace smoothing |
| Prior probability: 1/N, N is the number of samples | |
| SVM | Penalty coefficient: 1, Kernel function: radial basis kernel function (RBF), gamma = 1 |
| LSTM | Input: embedding |
| Layer_2: Bi-LSTM, units = 32 | |
| Layer_3: LSTM, units = 16 | |
| Output: dense, units = 1 | |
| Activation function: sigmoid, optimizer: RMSprop, epoch: 20, batch size: 128 | |
| GRU | Input: embedding |
| Layer_2: GRU, units = 32 | |
| Layer_3: GRU, units = 16 | |
| Layer_4: GRU, units = 4 | |
| Output: dense, units = 1 | |
| Activation function: sigmoid, optimizer: Adam, epoch: 20, batch size: 128 | |
| LSTM + GRU | Input: embedding |
| Layer_2: Bi-LSTM, units = 32 | |
| Layer_3: GRU, units = 16 | |
| Layer_4: GRU, units = 4 | |
| Output: Dense, units = 1 | |
| Activation function: sigmoid, optimizer: Adam, epoch: 20, batch size: 128 |
NBC, Naive Bayes classifier; SVM, support vector machines; LSTM, long short-term memory; GRU, gated recurrent unit.
Parameters for the classifiers.
| Classifier | Accuracy (%) | Precision (%) | Recall (%) | |
|---|---|---|---|---|
| Naive Bayes | 89.4 | 91.5 | 88.0 | 89.7 |
| SVM | 88.5 | 91.7 | 84.0 | 87.7 |
| LSTM | 91.5 | 90.1 | 92.9 | 91.5 |
| GRU | 93.0 | 93.3 | 92.3 | 92.8 |
| LSTM + GRU | 93.8 | 91.7 | 95.9 | 93.8 |
SVM, support vector machines; LSTM, long short-term memory; GRU, gated recurrent unit.
Performance index of each classifier.
According to the data in Table 10, we can intuitively see that the accuracy, recall and F1 of NBC and SVM are lower than the other three deep learning methods. However, the precision of NBC and SVM exceeds that of LSTM, indicating that the ability of NBC and SVM to identify negative samples is relatively strong. Secondly, it can be seen from the table that the recall of LSTM is slightly higher than that of GRU, but the other indicators of GRU are better than LSTM. More importantly, the LSTM + GRU ensemble model outperforms the other models in most indices, except the precision, which is only slightly lower than that of GRU. Especially, the learning ability of the LSTM + GRU model is much better, as indicated by the recall index. Meanwhile, the F1 of LSTM + GRU model reaches 93.8%, which suggests that the model possesses good stability.
Therefore, the R-FSW matrix is analyzed by the LSTM + GRU ensemble classifier to classify positive and negative sentiment. This is used to develop the sentiment orientation for the 10 categories of features. Note that the sentiment orientation is a qualitative analysis without consideration of the impact of degree words. As shown in Figure 2, the positive sentiments of the features are significantly more than the negative sentiments, which indicates that most customers have positive sentiment for these features. In following section, the sentiment values are calculated according to the sentiment classification.
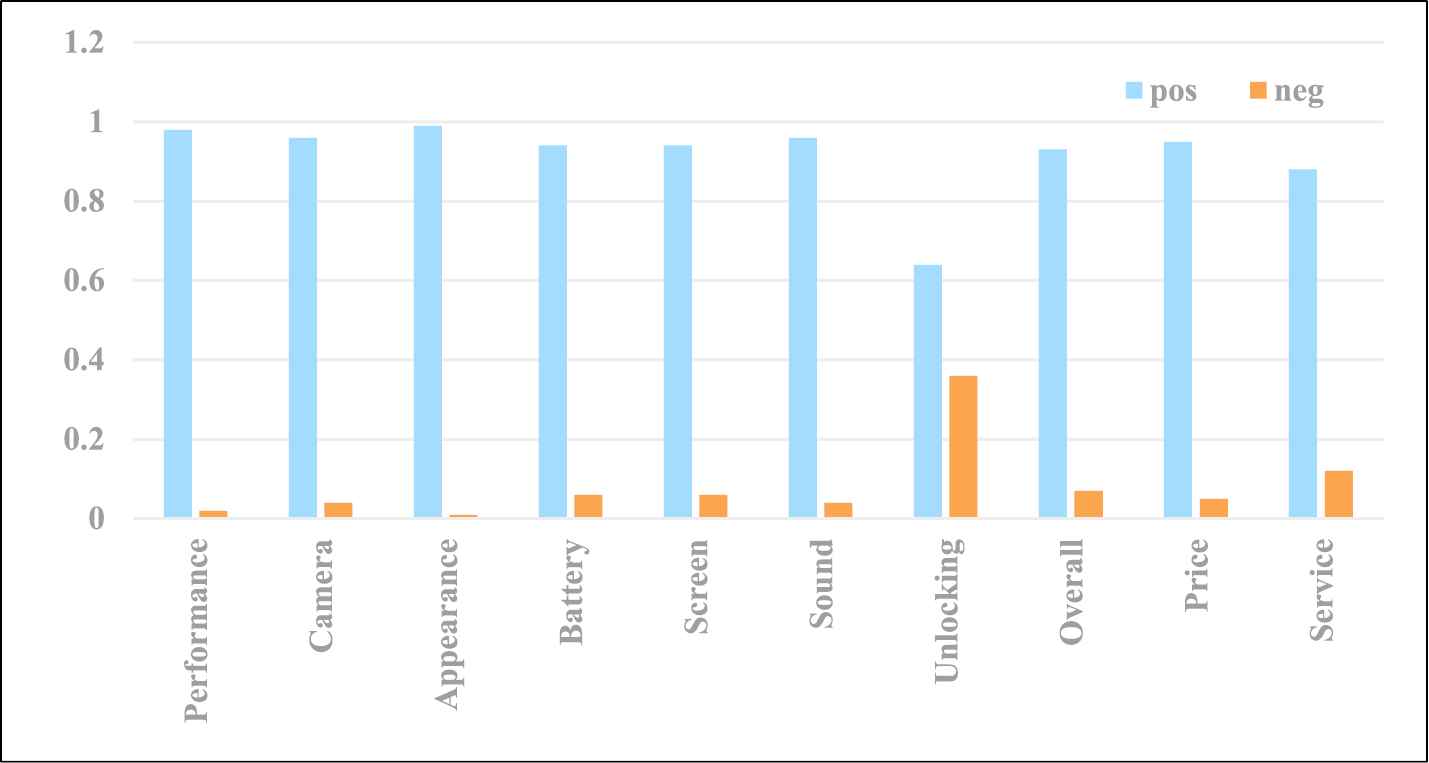
The sentiment for each category of features. Note that pos and neg indicate the value of positive and negative sentiment, respectively.
4.3.2. Sentiment calculation
Based on the sentiment orientation of each feature-sentiment word pair, the sentiment value is derived with combination of the sentiment and degree words for quantitative analysis [28]:
| Score | Degree |
|---|---|
| 2 | Extreme, absolute, quite, real, especially, special, most, super… |
| 1.5 | Very, more, so, extra, true… |
| 0.5 | Comparative, still, relatively, slightly, pretty, a little, fair… |
Degree word score table.
The relevant statistical values of the sentiment value for each feature, such as the mean, standard deviation, 50% quantile (median), and 75% quantile are calculated for the 10 categories of features, as shown in Table 12. Note that at this stage all of the online reviews (e.g., including both Nova 5 Pro and Nova 6) are taken into account. Among them, the standard deviation represents the degree of dispersion of the data, while the value of quartile represents the characteristic of data distribution.
| Feature | Mean | Standard Deviation | Median | 75% |
|---|---|---|---|---|
| Performance | 1.79 | 1.26 | 1.5 | 2 |
| Camera | 1.44 | 1.04 | 1 | 2 |
| Appearance | 1.94 | 1.03 | 2 | 2 |
| Battery | 1.31 | 0.98 | 1 | 2 |
| Screen | 1.09 | 0.75 | 1 | 1 |
| Sound | 1.29 | 0.83 | 1 | 2 |
| Unlocking | 0.63 | 1.46 | 1 | 1.5 |
| Overall | 1.23 | 0.95 | 1 | 1.5 |
| Price | 1.1 | 0.62 | 1 | 1 |
| Service | 1.09 | 1.07 | 1 | 1.5 |
Sentiment value statistics for the 10 categories of features.
The average values ranking the top three are appearance, performance, and camera. The unlocking possesses the lowest average value (only 0.63), which is significantly smaller than those of other features. Furthermore, the standard deviation of the unlocking is the largest, which indicates that the sentiment values are rather scattered. Meanwhile, the 75% quantile values of screen and price are 1, same as the median value, indicating that the sentiment value of screen and price is greatly concentrated near 1. This suggests that most customers’ sentiment values for these two features are the same. It is worthy notice that, if the sentiment value is simply divided into two categories, without considering the modification of the degree words, it is rather difficult to measure the sentiment strength of a review for each feature. Such oversimplified model might overlooks great amount of details in the reviews. Moreover, it is impossible to prioritize all 10 categories of features, if their sentiment values are classified only into two groups. Therefore, our model is more effective in providing guidance for manufacturers (e.g., prioritizing the product improvement strategy).
4.4. Customer Satisfaction Modeling and Customer Requirement Category Identification
As discussed in Section 3.3, customer satisfaction is modeled, based on the MLR. The relationship between the customer’s positive and negative sentiments and customer satisfaction is shown in Table 13. Meanwhile, the type of each feature is identified, according to the rules proposed in Section 3.4. Clearly, performance, camera, appearance, overall, price, and service are identified as the performance requirements; the must-be requirements include battery, screen, sound, and unlocking; no feature is identified as the excitement requirements. Generally, the must-be requirements represent the features/functions that a product (e.g., mobile phone) must provide. Satisfy these requirements will not significantly increase customer satisfaction. However, if they are not fulfilled, customers will be extremely disappointed. Therefore, manufacturers normally start product design with focus on the must-be requirements to ensure the products meet the most basic requirements. Afterward, the manufacturers would focus on the performance requirements. This category of requirements is directly proportional to customer satisfaction (i.e., the more a product satisfies these requirements, the higher customer satisfaction). Unfortunately, in this study for the two mobile phones, none of the features is identified as the excitement requirements. It should be noted that absence of the excitement requirements do not cause customer dissatisfaction. However, if a product satisfies such requirements, the customer satisfaction will be greatly enhanced. Therefore, after satisfying the must-be requirements, manufacturers should explore and strike to fulfill the excitement requirements in designing and improving products. In summary, the priority in product design and improvement is (1) the must-be requirements, (2) the performance requirements, and (3) the excitement requirements.
| Feature | Category | |||
|---|---|---|---|---|
| Performance | 0.095 | −0.097 | 0.134 | Performance |
| Camera | 0.05 | −0.157 | 0.145 | Performance |
| Appearance | 0.122 | −0.001 | 0.087 | Performance |
| Battery | −0.009 | −0.075 | 0.046 | Must-be |
| Screen | −0.008 | −0.084 | 0.054 | Must-be |
| Sound | −0.009 | −0.125 | 0.082 | Must-be |
| Unlocking | −0.048 | −0.179 | 0.092 | Must-be |
| Overall | 0.063 | −0.146 | 0.147 | Performance |
| Price | 0.046 | −0.053 | 0.07 | Performance |
| Service | 0.051 | −0.154 | 0.144 | Performance |
The impact of features on customer satisfaction and corresponding category of requirement.
4.5. Comparison of Results
The results obtained by our method are compared with other literatures, especially the research of Bi et al. [13]. The main features of the two methods are compared and shown in Tables 14 and 15. Bi et al. [13] first extracted the customer satisfaction dimension (CSD) from online reviews using a LDA model, then identify the sentiment orientation by SVM method. Taking the complex relationship between different CSDs and customer satisfaction into account, Bi further proposed a model based on ENNM to measure the impact of customer sentiment for different CSDs, and eventually developed an EKM to identify the category of each CSD.
| Bi et al. [13] | This Study | |
|---|---|---|
| Input data | Sentiment orientation (1 or 0), online ratings | Specific sentiment value, online ratings |
| Main considerations | The complex relationships between different CSDs and customer satisfaction are considered. | Consider the influence of sentiment strength, as well as the dynamic and diversified characteristics of customer satisfaction and customer requirements |
| Model type | Nonlinear method (ENNM) | Linear method (multivariate linear regression model) |
Main characteristics of the two methods.
| Feature | Bi et al. | This study | Feature | Bi et al. | This Study |
|---|---|---|---|---|---|
| Screen | Performance | Must-be | Easy to use | Must-be | – |
| Price | Excitement | Performance | App | Must-be | – |
| Battery | Performance | Must-be | CPU | Must-be | – |
| Appearance | Performance | Performance | Feeling | Excitement | – |
| Sound | Performance | Must-be | Unlocking | Excitement | Must-be |
| Service | Must-be | Performance | Game | Excitement | – |
| Camera | Performance | Performance | Material | Excitement | – |
| Performance | – | Performance | Memory | Must-be | – |
| Overall | – | Performance | Communication | Must-be | – |
| System | Excitement | – | Keyboard | Must-be | – |
The comparison of our results and those of Bi et al.’s [13].
It can be seen from Table 15 that although the features extracted by the two methods are different, the main features of the mobile phone, such as screen, price, battery, appearance, sound, camera, etc., are the same. Note that CPU, memory, and system is merged into performance features in this study. In Bi’s research, most of the features were classified into requirement categories with higher tier than this study. Some have changed from the performance requirements to the must-be requirements (such as battery), while some features have changed from the excitement requirements to the must-be requirements (such as unlocking). However, service is upgraded from the must-be to performance requirements. The reasons for these changes may be (1) the dataset used in the two studies are different; (2) the two studies used different methods to investigate the relationship between customer’s sentiment orientation and customer satisfaction; (3) customer requirements change over time, due to upgrade/update of the products. Since semiconductor and information technologies have progressed rapidly in the past decades, the mobile phones is no longer considered as a high-end consumer product nowadays. This leads to a great change of expectation for a mobile phone. For example, a high-resolution screen, which might greatly improves customer satisfaction several years ago, becomes a basic requirement today. The capability to unlock a phone by finger print or facial recognition used to be a privilege for a flagship product, but is a common feature now. However, due to ever competing market and demanding customers, other factors, such as customer service and shopping experience, become more and more important. Hence, it is not surprise that service become a performance requirement.
Nevertheless, the main merits of this study are elaborated here. First, this study considers the degree words in sentiment analysis, and provides more details about customer sentiment than the traditional two-category method (i.e., only positive and negative sentiment). This allows a more comprehensive modeling of sentiment values and customer satisfaction. Hence, the method proposed in this study is likely to offer additional information that allows manufacturers to optimize products and improve customer satisfaction more efficiently. Second, this study uses MLR to model customer satisfaction, which is suitable to study the relationship between a response variable and multiple explanatory variables. Furthermore, the model is simple to implement and easy to interpret, which is more suitable for studying large dataset than the nonlinear methods, such as ENNM.
4.6. MultiDimensional Analysis
The most significant difference between this study and the prior studies is that this study conducts a multidimensional analysis that offers more comprehensive understanding the characteristics of customer requirements. The first dimension is the product perspective, which refers to the comparison of reviews for two successive products (Nova 5 Pro and Nova 6); the second dimension is the customer perspective, which refers to further subdividing of customers (e.g., users of Android and iOS devices).
4.6.1. Product dimension analysis
Both Nova 5 Pro and Nova 6 belong to the same series, but were released at different time. From the product perspective, by analyzing the changes of customer satisfaction toward the two products, we can further understand the changes in the customer requirements for each feature. This sheds light on the satisfaction degree of customer requirements for each feature, which help to find the customer requirements that are the most critical. Therefore, manufacturers are able to improve their products and customer satisfaction in cost-effective manner.
Table 16 shows the statistics of sentiment values of the 10 features for the two mobile phones.
The performance and appearance of the two mobile phones have relatively high sentiment values (e.g., the mean value exceeds 1.5 points), while that of camera is ranked as 3rd (e.g., the mean value is close to 1.5).
Comparing to Nova 5 Pro, the sentiment values of each feature for Nova 6 have been improved, except appearance. Among them, the unlocking has been improved to the greatest extent (from 0.38 to 1.23). Meanwhile, the decrease of the sentiment value of appearance is rather small (i.e., merely 0.02 points).
The standard deviation of sentiment values for Nova 6 is generally lower than those of Nova 5 Pro. This suggests that the sentiment values for Nova 6 are more consensus, while those of Nova 5 Pro are rather diversified.
| Feature | Nova 5 Pro |
Nova 6 |
||||||
|---|---|---|---|---|---|---|---|---|
| Mean | Standard Deviation | Median | 75% | Mean | Standard Deviation | Median | 75% | |
| Performance | 1.73 | 1.3 | 1.5 | 2 | 1.82 | 1.25 | 1.5 | 2 |
| Camera | 1.40 | 1.26 | 1 | 2 | 1.46 | 0.91 | 1 | 2 |
| Appearance | 1.95 | 1.15 | 2 | 3 | 1.93 | 0.97 | 2 | 2 |
| Battery | 1.28 | 1.09 | 1 | 2 | 1.32 | 0.91 | 1 | 1.5 |
| Screen | 0.98 | 0.85 | 1 | 1 | 1.16 | 0.67 | 1 | 1 |
| Sound | 1.20 | 1.02 | 1 | 2 | 1.33 | 0.73 | 1 | 2 |
| Unlocking | 0.38 | 1.57 | 1 | 1.5 | 1.23 | 0.9 | 1 | 1.5 |
| Overall | 1.19 | 1.16 | 1 | 1.5 | 1.25 | 0.81 | 1 | 1.5 |
| Price | 1.07 | 0.71 | 1 | 1.5 | 1.11 | 0.56 | 1 | 1 |
| Service | 0.96 | 1.29 | 1 | 1.5 | 1.17 | 0.92 | 1 | 1.5 |
The statistics for sentiment values of the 10 features for Nova 5 Pro and Nova 6.
We further explore underlying mechanism for the observed differences by considering the influence of the customer’s sentiment orientation of each feature on customer satisfaction as well as the changes of customer requirements, as shown in Tables 17 and 18 for Nova 5 Pro and Nova 6.
| Feature | Nova 5 Pro |
Nova 6 |
||||
|---|---|---|---|---|---|---|
| wPj | wNj | FWj | wPj | wNj | FWj | |
| Performance | 0.149 | −0.095 | 0.153 | 0.045 | −0.046 | 0.109 |
| Camera | 0.09 | −0.149 | 0.150 | 0.021 | −0.018 | 0.047 |
| Appearance | 0.213 | 0.026 | 0.117 | 0.036 | −0.063 | 0.118 |
| Battery | −0.022 | −0.08 | 0.036 | 0 | −0.071 | 0.085 |
| Screen | 0.009 | −0.074 | 0.052 | 0 | −0.059 | 0.070 |
| Sound | −0.036 | −0.13 | 0.059 | −0.002 | −0.06 | 0.069 |
| Unlocking | −0.029 | −0.146 | 0.073 | 0.007 | 0.008 | 0.001 |
| Overall | 0.115 | −0.142 | 0.161 | 0.026 | −0.033 | 0.070 |
| Price | 0.065 | −0.045 | 0.069 | 0.026 | −0.056 | 0.098 |
| Service | 0.091 | −0.114 | 0.129 | 0.009 | −0.269 | 0.332 |
The impact of sentiment values on customer satisfaction for Nova 5 Pro and Nova 6.
| Feature | Nova 5 Pro |
Nova 6 |
|---|---|---|
| Category | Category | |
| Performance | Performance | Performance |
| Camera | Performance | Performance |
| Appearance | Excitement | Performance |
| Battery | Must-be | Must-be |
| Screen | Performance | Must-be |
| Sound | Must-be | Must-be |
| Unlocking | Must-be | Excitement |
| Overall | Performance | Performance |
| Price | Performance | Performance |
| Service | Performance | Performance |
Requirement categories of various features for Nova 5 Pro and Nova 6.
In the perspective of changes in requirement categories, from Nova 5 Pro to Nova 6, only three features change their requirement categories: appearance, screen, and unlocking. The requirement category of appearance changes from the excitement requirement to the performance requirement. As discussed above, the excitement requirements are something that customers do not expect, which greatly improve customer satisfaction. However, in the next-generation product, Nova 6, the sentiment value of appearance drops about 0.02, and the requirement category become a performance requirement. This is likely due to only subtle change in appearance between the two products, while customers expect more. The requirement category of screen changes from a performance requirement to a must-be requirement, whereas the sentiment value has increased from 0.98 to 1.16. This suggests that the improvement of screen is acknowledged by customers, but not sufficient to promote a leap of customer satisfaction. Meanwhile, with more and more products offering screen that is adequate to satisfy requirements for most customers, it is expected that the requirement for screen is downgraded. On the other hand, the requirement category of unlocking changes from the must-be requirement to the excitement requirement, and the sentiment value greatly improves from 0.38 to 1.23. Such significant change is likely due to the improvement of unlocking mechanism (e.g., more sensitive and reliable).
For further improving product (i.e., Nova 6), the manufacturer should first take care of the must-be requirements (e.g., battery, screen, and sound), then the performance requirements, such as appearance and performance, and finally the excitement requirement (i.e., unlocking).
4.6.2. Customer dimension analysis
Currently, the mobile phones can be divided into two categories, according to the operation systems: iOS and Android. Note that only Apple products use iOS system, while Android system is supported by more manufacturers. Furthermore, the prices of products using iOS system are relatively higher than those of Android. The users of two types of devices are likely to possess different requirements for a mobile phone. Therefore, the online reviews published by two types of systems are analyzed separately. In this study, it is assumed that users of iOS system used to operate an Apple device and are not familiar with Android system, while users of Android system already get used to features in an Android phones. By comparing the requirements of the two types of customers, on one hand, we can further understand how to attract iOS users to switch to Android system, which provide useful insight for manufacturers to design products for cross-platform customers; on the other hand, we can learn more from Android users who are quiet experiencing with the Android system. The results would help manufacturers to develop versatile products that meet the requirements of various customers.
Table 19 shows the statistics for sentiment value of the iOS and Android users for each feature. The sentiment values of iOS users for each feature is generally higher than those of Android users, except the feature of performance. This indicates that the performance of this phone is slightly worse than iOS devices (e.g., iPhone), but the other features are better than iOS devices. From the perspective of Android users, the sentiment values of performance and appearance is higher than those of other features, while the value of unlocking is rather low. As discussed in the Section 4.6.1, this provide hints for manufacturers to properly arrange the order of improvement for the products (e.g., targeting the features/functions related to unlocking would gain much more improvement in customer satisfaction).
| Feature | iOS |
Android |
||||||
|---|---|---|---|---|---|---|---|---|
| Mean | Standard Deviation | Median | 75% | Mean | Standard Deviation | Median | 75% | |
| Performance | 1.77 | 1.14 | 1.5 | 2 | 1.82 | 1.25 | 1.5 | 2 |
| Camera | 1.52 | 0.97 | 1 | 2 | 1.44 | 0.93 | 1 | 2 |
| Appearance | 2.05 | 1.07 | 2 | 3 | 1.97 | 1.01 | 2 | 2 |
| Battery | 1.38 | 0.87 | 1 | 2 | 1.30 | 0.89 | 1 | 1.5 |
| Screen | 1.25 | 0.47 | 1 | 1.5 | 1.10 | 0.65 | 1 | 1 |
| Sound | 1.33 | 0.71 | 1 | 2 | 1.32 | 0.76 | 1 | 2 |
| Unlocking | 1.36 | 1.13 | 1 | 2 | 0.79 | 1.36 | 1 | 1.5 |
| Overall | 1.33 | 0.83 | 1 | 1.5 | 1.25 | 0.86 | 1 | 1.5 |
| Price | 1.17 | 0.47 | 1 | 1.13 | 1.14 | 0.54 | 1 | 1 |
| Service | 1.25 | 0.85 | 1 | 1.5 | 1.16 | 0.90 | 1 | 1.5 |
The sentiment value of iOS and Android users.
Table 20 shows the influence of the sentiment orientation of the iOS and Android users for each feature on customer satisfaction, whereas Table 21 shows the requirement categories of the two types of customers for each feature. Obviously, the requirements of the two types of customers for each feature are quite different. Android users expect battery and unlocking to be the must-be requirements, while iOS users take sound as the must-be requirements. There is no excitement requirement according to the reviews of Android users, which means that the functions or features of current product have not yet reached the threshold of Android users. However, performance, appearance, and price are the exciting requirements for iOS users, which indicates a high level of satisfaction for these three features. This also implies that these features might be the key factors for iOS users to switch to Android. For example, the prices of iOS devices are generally higher than that of Nova 5 Pro or Nova 6. This clearly indicates that the emphasis in designing products should be adjusted according to the targeted customers.
| Feature | Android |
iOS |
||||
|---|---|---|---|---|---|---|
| wPj | wNj | FWj | wPj | wNj | FWj | |
| Performance | 0.091 | −0.028 | 0.116 | 0.194 | 0.005 | 0.152 |
| Camera | 0.057 | −0.079 | 0.133 | 0.118 | −0.1 | 0.175 |
| Appearance | 0.127 | −0.025 | 0.148 | 0.26 | 0.014 | 0.198 |
| Battery | −0.001 | −0.053 | 0.051 | 0.025 | −0.035 | 0.048 |
| Screen | 0.005 | −0.037 | 0.041 | 0.092 | −0.022 | 0.092 |
| Sound | 0.008 | −0.052 | 0.059 | −0.029 | −0.055 | 0.021 |
| Unlocking | −0.035 | −0.095 | 0.059 | 0.001 | −0.056 | 0.046 |
| Overall | 0.086 | −0.061 | 0.143 | 0.21 | −0.038 | 0.199 |
| Price | 0.05 | −0.014 | 0.062 | 0.049 | 0.03 | 0.015 |
| Service | 0.051 | −0.142 | 0.188 | 0.052 | −0.015 | 0.054 |
The impact of sentiment values on customer satisfaction for Android and iOS users.
| Feature | Android |
iOS |
|---|---|---|
| Category | Category | |
| Performance | Performance | Excitement |
| Camera | Performance | Performance |
| Appearance | Performance | Excitement |
| Battery | Must-be | Performance |
| Screen | Performance | Performance |
| Sound | Performance | Must-be |
| Unlocking | Must-be | Performance |
| Overall | Performance | Performance |
| Price | Performance | Excitement |
| Service | Performance | Performance |
The requirement categories for Android and iOS users.
5. CONCLUSIONS
This study proposes a framework to analyze the online reviews, which offers a comprehensive investigation of the sentiment value, customer satisfaction, and customer requirement, in order to extract useful guidance for product/service improvements, especially with consideration of the dynamic and diversified properties of customer requirements. The main contributions of this study are elaborated as follows.
First, the degree words are taking into account in calculating sentiment values, which provide results that are more in line with the actual sentiment of customers. This builds a solid foundation for following analysis (e.g., customer satisfaction modeling).
Second, the sentiment value and customer satisfaction are analyzed by MLR method for 10 categories of features. A set of rules based on Kano model is proposed to designate each feature as a proper type of customer requirement.
Third, the customer requirements are comprehensively analyzed using multidimensional analysis, which includes the perspective of both products and customers. The product dimension represents the dynamic properties of customer requirements, which change over time (e.g., update/upgrade of products), while the customer dimension represents the diversity of customer requirements (e.g., the deviation between iOS and Android users). By contrast to the traditional single-dimensional analysis, the proposed multidimensional analysis is capable to gain a deeper insight for the relationship between customer requirements and customer satisfaction.
Overall, more useful information could be extracted from online reviews by applying the proposed framework. The results (e.g., ranking of features and categories of customer requirements) offer a guidance for manufacturers to improve their products/services in a cost-effective manner. Especially, this allows manufacturers to target different group of customers with versatile products and efficiently improve customer satisfaction.
This study also has some limitations. First, the feature vocabulary, sentiment vocabulary, and degree vocabulary are constructed based on limited number of reviews. Even though general HowNet dictionary is used as complementary, unintentional omissions might still exist. Study is underway to expand the number of reviews (e.g., including reviews for other type of mobile phone) to further supplement the three vocabularies. Second, in the product dimension analysis, only two generations of products are considered, which might not be able to grasp the full picture of the dynamic properties of customer requirements. Further study is underway to compare multiple generations of products, in order to better understand changes in customer requirements. Third, due to increasing competition in market and demanding customers, manufacturers might need to optimize product design for customers with different background. Therefore, it is necessary to further subdivide customer groups (e.g., education, career, location) for more careful analysis. This would give manufacturers sufficient knowledge of customer requirements, which is helpful for developing product that targets specific customers.
CONFLICTS OF INTEREST
The authors declare no conflicts of interest.
AUTHORS' CONTRIBUTIONS
The study was conceived and designed by Rui Mu and Yufeng Zhang, the modeling work and data analysis were performed by Yujie Zheng and Kairui Zhang, the manuscript was drafted by Yujie Zheng and Rui Mu, and critically revised by Yufeng Zhang. All authors gave final approval for publication.
ACKNOWLEDGMENTS
This study has been financially supported by the Natural Science Foundation of Fujian Province of China (No. 2017R0098), and the Ministry of Science and Technology of China (No. 2020IM010100).
REFERENCES
Cite this article
TY  - JOUR
AU  - Rui Mu
AU  - Yujie Zheng
AU  - Kairui Zhang
AU  - Yufeng Zhang
PY  - 2021
DA  - 2021/01/19
TI  - Research on Customer Satisfaction Based on Multidimensional Analysis
JO  - International Journal of Computational Intelligence Systems
SP  - 605
EP  - 616
VL  - 14
IS  - 1
SN  - 1875-6883
UR  - https://doi.org/10.2991/ijcis.d.210114.001
DO  - 10.2991/ijcis.d.210114.001
ID  - Mu2021
ER  -