
Statistical and Machine Learning Approaches for Clinical Decision on Drug Usage in Diabetes with Reference to Competence and Safeness
 , K. R. Saranya2, , S. Sasikala3, , G. Chinthana4,
 - DOI
- 10.2991/ijcis.d.210212.002How to use a DOI?
- Keywords
- Diabetes; Clinical decision-making; Machine learning; Statistical approach; Drug usage; Drug recommendation system
- Abstract
Diabetes is a chronic disease that requires patient-centered treatment. The physician strategy for treatment of diabetes varies from one patient to another. Using the clinical parameters and the evidence of diabetes at various group of people are to be treated with the drugs that provide significant changes over period of time. In this work, safety and efficiency of drug that is used for diabetes and to provide justification using statistical approach is proposed. The benefits and harm of various drugs are represented as null hypothesis and alternate hypothesis using two-tailed t test (unpaired hypothesis testing). The drugs specified are given periodically at various weeks so that the effect of each drug is identified with clinical parameters and it is summarized. The various medications that are to be imposed on various groups of people and respected hypothesis values are calculated. The post hoc power, evaluation of p value that specify the significant change in the clinical parameters are observed. With the help of this p value and the hypothesis testing, it recommends the correct specification of drugs. The drug combination such as sulfonyl urea (glibenclamide 5 mg), sulfonyl urea + sitagliptin, sulfonyl urea + vildagliptin, metformin, metformin + sitagliptin, metformin + vildagliptin were used in this study. The above drugs are given to various groups to find out the effectiveness of drug usage in diabetes. The idea is implemented with both manual and automated approach of handling patient report and to find their significant approach and thereby to provide conclusion of the drug usage for diabetes.
- Copyright
- © 2021 The Authors. Published by Atlantis Press B.V.
- Open Access
- This is an open access article distributed under the CC BY-NC 4.0 license (http://creativecommons.org/licenses/by-nc/4.0/).
1. INTRODUCTION
With growing concerns about evidence-based guidelines, medical societies require evidence that supports a range of interventions to improve diabetes treatment outcomes. Regression are functions that are used to determine the relationship between the dependent variable (target field) and one or more independent variables. The dependent variable is a result aspect on which an independent (“experimental” or “controlled”) variable is hypothesized and observed to have a particular measurable effect and independent variable is a phenomenon that is viewed as influencing the behavior of some other (dependent) variable.
The statistical method includes mathematical concepts, formulas, models and techniques used for statistical analysis of random data. Regression is a data mining function that can predict a number such as age, weight, distance, temperature, income or sales by using various regression technique. In comparison, deterministic methods are used where the data is easily reproducible or where its behavior is determined entirely by its initial stage and inputs. In statistics, hypotheses suggested by a given dataset are tested with the same dataset is likely to be accepted even when they are not true. This is because circular reasoning (double dipping) would be involved: something seems true in the limited data set, therefore we hypothesize that it is true in general, therefore we (wrongly) test it on the same limited data set, which seems to confirm that it is true. Generating hypotheses based on data already observed, in the absence of testing them on new data, is referred to as post hoc theorizing.
A two-tailed test is a statistical test in which the important area of a distribution is two-sided and also examinations whether a sample is above or less than a certain range of values. If the example being checked comes under either of the essential areas, the alternative hypothesis is accepted as opposed to the null hypothesis. The two-tailed test gets its name from evaluating the area under both of the tails of a normal distribution, although the test can be made use of in various other non-normal distributions.
1.1. Aim and Objectives
The aim of this work is to deal with the diabetic drugs in a statistical way in order to provide the proper drug in a periodical manner.
The objectives are
Data collection.
To identify the drug specification.
To calculate the mean for each drug.
To calculate the standard deviation for each drug.
To calculate P value using hypothesis testing.
To response of each group with their P values for various clinical parameters.
To response of drugs for various clinical parameters.
To automate the report.
1.2. Problem Statement
Statement: 1
It reveals the short-term clinical outcomes.
Statement: 2
Response of drugs in monotherapy (treatment of disease with a single drug) in same group of people.
Statement: 3
Increased risk for hypoglycemia (low blood sugar)
1.3. Existing Approaches
Given the increase in medications for type 2 diabetes mellitus, clinicians and patients need information about their effectiveness and safety to make informed choices. Evidence on long-term clinical outcomes (all-cause mortality, cardiovascular disease (CVD), nephropathy, and neuropathy) were of low strength or insufficient. Most medications decreased the hemoglobin A1c (HBA1c) level by about 1 percentage point and most 2-drug combinations produced similar reductions. Metformin was more efficacious than the DPP-4 inhibitors, and compared with thiazolidinediones or sulfonylureas, the mean differences in body weight were about 2.5 kg. Metformin decreased low-density lipoprotein (LDL) cholesterol levels compared with pioglitazone, sulfonylureas, and DPP-4 inhibitors. Sulfonylureas had a 4-fold higher risk for mild or moderate hypoglycemia than metformin alone and, in combination with metformin, had more than a 5-fold increased risk compared with metformin plus thiazolidinediones. Thiazolidinediones increased risk for congestive heart failure compared with sulfonylureas and increased risk for bone fractures compared with metformin. Diarrhea occurred more often with metformin than with thiazolidinediones.
1.4. Proposed Solution
Solution: 1
To find out the efficiency and safety of drugs used in diabetes using machine learning and statistical approach.
Solution: 2
To find out the response of drugs in various group of people using hypothesis testing.
Solution 3:
The given response is made into automated for the accurate statistical report.
2. LITERATURE REVIEW
Data mining based disease learning analysis for processing a structured data have been highlighted in numerous literatures. These methodologies were not effective in handling huge volume of data which actually is required for more accurate and reliable diagnosis and prediction.
Data mining model could assist healthcare providers to make better clinical decisions in identifying diabetic patients. But the most of models are used conventional learner for classification so there was no better accuracy. Various factors are mining the singleton rather than the item reveals the actual medicine combination, this leads to no various reconstructed set of medication for analysis. The methodology of the possibility of utilizing the Big data techniques for evidence based healthcare support to improve the reliability of medical treatment but there is no exact solution for the disease.
The further survey reveals that predicting the dose response curve and generating the curve features instead of directly predicting the curve characteristics can increase prediction accuracy. This cause limited correlations between various characteristics of the dose response curves and thus reasoned for the prediction of the dose response curve rather than relying on predicting single feature of the dose response curve as is usually considered in current approaches.
Appavu alias Balamurugan and Salomi developed a predictive risk level classification of diabetic patients using deep learning modified neural network [1]. Beloufa and Chikh [2] created a fuzzy classifier integrating with artificial bee colony algorithm for developing the decision rule. Artificial honey bee algorithm is an optimization algorithm based on the natural behavior.
Chinthana [3] evaluated the efficacy and safety of Myoinositol (MI) versus Metformin in women with PCOS. It is found that MI seems to be more effective than metformin in improving the hormonal profile, reproductive axis functioning with subsequent frequency of ovulation and pregnancy outcomes.
Ganji and Abadeh [4] developed the fuzzy ant colony optimization for diagnosis of diabetes disease. Guo et al. [5] developed a DBD diagnosis system using Bayes network and obtained 72.3% accuracy. It is a probabilistic graphical model which uses Bayesian inference for the probability computation. Humar Kahramanli and Novruz Allahverdi [6] developed a hybrid neural network diagnosis system. This system is hybridized using artificial neural network and fuzzy neural network for the diagnosis of DBD.
Polat et al. [7] created a cascade learning system which dependent on generalization discrimination analysis (GDA) and least square support vector machine (LS-SVM) for predicting diabetes. GDA applied general linear model to the discriminant function analysis. LV- SVM has a set of supervised learning methods that will analyze the data and recognize patterns which is used for classification purpose. Khotimah et al. [8] studied about Revealing oral medication patterns from reconstructed long-term medication history of type 2 diabetes.
Mokdad et al. [9] discussed about the Cost of Diabetes in the Kingdom of Saudi Arabia. This work estimated the direct cost of diabetes in KSA and the future cost accounting for currently undiagnosed as well as borderline diabetics. Nirmala Devi et al. [10] developed the amalgam model for classifying Pima Indian diabetic database (PIDD). This amalgam model combines k-means with k-nearest neighbor (KNN) with multi-sep preprocessing. Nirmala Devi et al. [11] established a customized logistic regression model for diabetes m Mellitus as well as Identifying the vital variables of type II DM.
Pasupathi and Kalavakonda [12] proposed the evidence Based health care system using Big Data for disease diagnosis. Patil et al. [13] proposed a DBD diagnosis system which uses K-mean clustering algorithm. The K-mean algorithm group similar data points together and discover the underlying patterns. It identifies k number of centroids and then allocates every data point to the nearest cluster.
Rahman and Pal [14] analyzed the drug sensitivity prediction based on dose response curve characteristics. Tahani Daghistani and Riyad Alshammari [15] studied about Diagnosis of Diabetes by applying data mining classification techniques. Uma and Appavu [16] proposed C5. 0 Decision Tree Model Using Tsallis Entropy and Association Function for General and Medical Dataset. The proposed classifier model provides more accuracy and smaller tree for general and Medical dataset.
Wettayaprasit and Sangket [17] proposed a two stage rule generated system. The first stage includes the pruning of the neural network nodes and analyzing its weight. Later linguistic rules were created using the frequency interval data representation. Pima Indians diabetes dataset was used to prove the performance of the derived model. Small number of rules and less training time was obtained. This method achieved 74% accuracy.
3. PROPOSED METHOD
With the help of clinical parameters the comparative study on effectiveness of each of the drug combination in diabetic individuals by using statistical and machine learning approaches is proposed in this work.
The research study with duration of 12 weeks is carried out to compare the efficacy of six drugs namely sulfonyl urea (glibenclamide 5 mg), sulfonyl urea + sitagliptin, sulfonyl urea + vildagliptin, metformin, metformin + sitagliptin and metformin + vildagliptin in diabetic individuals. According to the inclusion as well as exclusion criteria's total of 300 people were screened for this research study after obtaining consent.
3.1. Materials and Methods
Firstly the clinical parameters are assigned for each and every drug and their mean variation is observed with the periodical weeks.
Materials: 6 types of drugs and 10 clinical parameters were used in this study.
As part of experimentation the following drug specification are taken into consideration.
Drug 1: sulfonyl urea (glibenclamide 5 mg),
Drug 2: sulfonyl urea + sitagliptin,
Drug 3: sulfonyl urea + vildagliptin,
Drug 4: metformin,
Drug 5: metformin + sitagliptin,
Drug 6: metformin + Vildagliptin
The following clinical parameters were used in this empirical study.
Clinical Parameter 1: Fasting blood sugar (FBS)
Clinical Parameter 2: Postprandial glucose test (PPBS)
Clinical Parameter 3: Hemoglobin A1c (HBA1C)
Clinical Parameter 4: Blood Urea
Clinical Parameter 5: Serum creatinine
Clinical Parameter 6: Total cholesterol (TC)
Clinical Parameter 7: Triglycerides (TG)
Clinical Parameter 8: Low-density lipoprotein (LDL)
Clinical Parameter 9: High-density lipoprotein (HDL)
Clinical Parameter 10: Serum amylase
Classification of Study Population: For study purpose, the population is divided in to 6 groups namely Group 1, Group 2, Group 3, Group 4, Group 5 and Group 6.
Method Used: Each clinical parameter is defined with mean and variation of each attribute and their respective p-value is also calculated.
3.2. Study Period
Drug is given to different group of people from 0th week to 12th week and the changes in each of the clinical parameter with each group of drug between 0th week to 4th week then 4th week to 8th week then 8th week to 12th week is observed.
3.3. Clinical Assessment
3.3.1. Fasting Blood Sugar
FBS determines the blood glucose level that the subject have not taken food for at least 8 hours. It is typically the very first examination done to check for prediabetes and diabetes mellitus. After FBS, a carbohydrate metabolism test is performed which again determines the blood sugar levels.
As a result when blood glucose levels are checked, people with diabetic issues will have blood glucose degrees substantially more than individuals who do not have diabetes mellitus. The FBS test is additionally made use of to test the effectiveness of different drug or dietary changes on people currently identified as diabetic person.
3.3.2. Postprandial glucose test
A PPBS is a blood glucose test that identifies the amount of a kind of sugar, called glucose, in the blood after a dish. Glucose is mostly made from carbohydrate foods. It is the main source of energy used by the body.
A 2-hour postprandial blood glucose test measures blood sugar precisely 2 hours after consuming a dish timed from the start of the meal. By this factor blood sugar level has normally gone back down in healthy and balanced individuals, however it might still be elevated in people with diabetes mellitus. Therefore, it works as a test for whether an individual might have diabetic issues or a person that has diabetes is efficiently managing their blood sugar.
3.3.3. Hemoglobin A1c
The red blood cell in the blood stream are made from a molecule called hemoglobin. Glucose sticks to the hemoglobin to make a “glycosylated hemoglobin” molecule, called hemoglobin A1C or HbA1C. The much more glucose in the blood, the a lot more hemoglobin A1C or HbA1C will absolutely exist in the blood.
This is also supported by data from clinical practice showing that HbA1c levels improved significantly after 20 days from start or intensification of glucose-lowering treatment.
3.3.4. Blood urea
Blood tests for blood urea nitrogen (BUN) and creatinine are the simplest way to monitor the kidney function. These substances are normal metabolic waste products that are excreted by the kidneys. Urea is a byproduct of protein breakdown. A test can be done to measure the amount of urea nitrogen in the blood. In kidney disease, these substances (as well as numerous others) are not excreted normally, and so they accumulate in the body thus causing an increase in blood levels of urea. The normal level of BUN is 7–20 mg/dL.
3.3.5. Serum creatinine
It is a by-product of normal muscle breakdown. Measuring the levels of creatinine in the bloodstream and in the urine can be helpful for tracking the progression of diabetic kidney disease. Serum creatinine (a blood measurement) is an important indicator of renal health because it is an easily measured by product of muscle metabolism that is excreted unchanged by the kidneys. Creatinine itself is produced via a biological system involving creatine, phosphocreatine (also known as creatine phosphate), and adenosine triphosphate (ATP, the body's immediate energy supply).
3.3.6. Lipid profile
A lipid profile is a direct measure of three blood components: cholesterol, triglycerides (TG) and HDLs. Cholesterol is a vital substance that the body uses to produce such things as digestion-aiding material, hormones and cell membranes. It is both produced by the body and absorbed from some of the foods that are consumed. Cholesterol and TG are transported in the blood by combinations of lipids and proteins called lipoproteins. HDLs, the so-called “good” or “healthy” cholesterol, are lipoproteins made mostly of protein and little amount of cholesterol. HDLs can help to clear cholesterol deposits in blood vessels left by another blood component called LDLs.
3.3.7. Total cholesterol (TC)
Cholesterol is a waxy substance that is made by the body and found in some animal-based foods. Blood cholesterol levels describe a group of fats also known as lipoprotein which includes HDL-C (high-density lipoprotein or good cholesterol) and LDL-C (low-density lipoprotein or bad cholesterol). Cholesterol is important to overall health, but when levels are too high, cholesterol can be harmful by contributing to narrowed or blocked arteries. Unfortunately, people with diabetes are more prone to have unhealthy high cholesterol level, which contributes to CVD. By taking steps to manage cholesterol, individuals can reduce their chance of CVD and premature death.
3.3.8. Triglycerides
TG are lipid compounds composed of a glycerol esterified to 3 fatty acid chains of varying length and composition. These fatty acid chains can be saturated or unsaturated, and the chemical composition of each chain is different. Each chain consists of carbon and hydrogen atoms with varying single or double-bonded chains, depending on the degree of saturation or unsaturation. TG are formed of mixed chains, and the structural comparison between the chains is heterogeneous in nature.
3.3.9. Low-density lipoprotein (LDL)
A high LDL-C level is associated with a higher risk for CVD. However, LDL number should no longer be the main factor in guiding treatment to prevent heart attack and stroke, according to the latest guidelines from the American Heart Association. For patients on statins, it's important to seek the advice of the physician to manage the LDL level appropriately. A diet high in saturated and trans fats can raise the LDL cholesterol.
3.3.10. High-density lipoprotein (HDL)
With HDL-C, higher levels are associated with a lower risk for CVD. Low HDL cholesterol will lead to higher risk for heart disease. People with high blood TG usually also have lower HDL cholesterol. Genetic factors, type 2 diabetes, and certain drugs, such as beta-blockers and anabolic steroids, also lower HDL cholesterol levels. Smoking, being overweight and being sedentary can all contribute to lower HDL cholesterol.
3.3.11. Serum amylase
Amylase is an enzyme that helps digest carbohydrates. It is made in the pancreas and the glands that make saliva. When the pancreas is diseased or inflamed, amylase releases into the blood. A test can be done to measure the level of this enzyme in the blood.
3.4. Computational Procedure
Initially the experimental data is collected from study population and the mean as well as standard deviation of each clinical parameter is calculated. Further the P value and their variation for each clinical parameters with respective week is calculated through statistical approach.
3.4.1. Arithmetic mean
The arithmetic mean of a set of values is the ratio of their sum to the total number of values in the set. Thus, if there are a total of n numbers in a data set whose values are given by a group of x values, then the arithmetic mean of these values, represented by “m,” can be found using this formula.
3.4.2. Standard deviation
A measure of how close the numbers are to the mean is known as standard deviation. If the standard deviation is big, then the data is more “dispersed” or “diverse.” The amount of variation or dispersion of a set of clinical values used in this study is measured by the use of standard deviation formula given below.
3.4.3. P value
Post hoc statistical power is the probability that leads to the rejection of the null hypothesis and it indicates the power of a statistical test. P value was used to prove the effectiveness/significance of each drug with reference to each and every clinical parameter in this study. The clinical trial results of this empirical study have been judged by using this standard.
4. RESULTS AND DISCUSSION
4.1. Statistical Analysis
In the context of business intelligence (BI), statistical analysis involves collecting and scrutinizing every data sample in a set of items from which samples can be drawn. A sample in statistics is a representative selection drawn from a total population.
Statistical analysis can be broken down into five discrete steps, as follows:
Explore the relation of the data to the underlying population.
Create a model to summarize understanding of how the data relates to the underlying population.
Prove (or disprove) the validity of the model.
Employ predictive analytics to run scenarios that will help guide future actions.
SPSS predictive analytics software offers advanced techniques in an easy-to-use package to find new opportunities, improve efficiency and minimize risk. It is a widely used tool for statistical analysis in social science, market research, healthcare, education and others. This powerful tool provides a wide range of techniques, including predictive analytics, ad hoc analysis, hypothesis testing and reporting which enables the user to make faster data-driven decisions.
Statistics included in the base software are:
Bivariate statistics: It includes various tests like means, t test, ANOVA, correlation (bivariate, partial, distances) and nonparametric tests.
Prediction for identifying groups: It includes factor analysis, cluster analysis (two-step, K-means, hierarchical) and discriminant.
In this work, SPSS Statistics is used to perform the data-driven clinical decision on drug usage in diabetes. Experimental data were examined by SPSS statistical tool before and also after treatment. The results were arranged as well as values existed as mean (+ or −) and SD. Trainees' paired “t” test P value of <0.05 was thought about to be statistically significant.
4.2. Analysis of Hypothesis
A statistical hypothesis, in some cases called confirmatory data evaluation. It is a hypothesis that can be checked on the basis of observing a procedure that is designed by means of a set of random variables. An analytical hypothesis test is an approach of analytical inference. Frequently, two statistical information collections are contrasted, or a data collection gotten by sampling is contrasted versus a synthetic information established from an idealized version. A hypothesis is suggested for the analytical relationship in between the two information sets, and this is contrasted as an option to an idyllic null hypothesis that proposes no relationship in between the two data sets. The contrast is regarded statistically significant, if the relationship between the data sets would be an unlikely awareness of the null hypothesis according to a limit likelihood of the significance level. Hypothesis tests are made use of in figuring out the results of a research study that would lead to a being rejected of the null hypothesis for a pre-specified degree of importance. The procedure of distinguishing the null hypothesis as well as the alternate hypothesis (AH) is aided by identifying two conceptual sorts of errors (type 1 & type 2), and also by defining the parametric limits like how much type 1 error will be allowed.
An alternate framework for statistical hypothesis testing is to define a collection of statistical models, one for each candidate hypothesis, and then make use of model option strategies to pick one of the most proper model. One of the most typical model selection strategies are based on either Akaike information requirement or Bayes variable.
The null hypothesis as well as the AH are the terms utilized in statistical tests, which are official approaches of inferring or making decisions on the basis of data. The hypotheses are conjectures regarding an analytical model of the population, which are based on an example of the population. The examinations are core aspects of statistical inference, heavily used in the interpretation of clinical experimental information, to separate clinical claims from statistical noise.
The term null hypothesis is a basic statement or default setting that there is no relationship in between two determined phenomena, or no association among groups. Rejecting or disproving the null hypothesis and also thus wrapping up that there are grounds for believing that there is a relationship between two phenomena (e.g. that a prospective treatment has a measurable effect) is a central task in the modern-day method of scientific research; the field of statistics offers precise requirements for rejecting a null hypothesis. The null hypothesis theory is usually assumed to be true until the proof indicates or else. The strength of the evidence against the null hypothesis is assessed through test of importance. A statement of “no effect” or “no distinction” is usually called as null hypothesis. It is typically represented as H0 (read “H-nought,” “H-null” or “H-zero”).
The alternative hypothesis is the statement that is wished or expected to be true instead of the null hypothesis which is stood for as H1 and Ha.
Statistical significance test: Take a random sample from the populace. If the sample data follow the null hypothesis, after that do not turn down the null hypothesis; if the example data are irregular with the null hypothesis, after that deny the null hypothesis as well as conclude that the alternate theory holds true.
4.3. Implementation
The clinical data set is collected and they are changed into the. xls format.
In their specified sheet each of their mean and standard deviation of each attribute is calculated.
SPSS statistics is used as the statistical tool for calculating the desired P value and their variation of each week.
This result shows the overall increase or decrease of their significance p value from the affected range to the normal range.
This process is carried out for all the chosen drugs to treat for diabetes.
From this, overall P value is generated in each of the attribute and their significance value is found.
The given patient record is made into excel file to automate each of the specific attribute.
4.4. Research Findings
The diabetes is a chronic life-threatening disease which can be cured by proper medication. The proposed model helps the medical practitioners by giving recommendation of drugs, for treating the diabetes. From this we could solve the problem of using the drug that is accurate for the patient from the given history of patient's condition. The following research findings are observed.
From Tables 1–6, it is inferred that the result of p value after two tailed t tests with Drug 1, Drug 2, Drug 3, Drug 4 and Drug 6 for the clinical parameter 'Serum Creatinine' is not statistically significant because p values are not less than 0.05. So, the response of Drug 1, Drug 2, Drug 3, Drug 4 and Drug 6 not shows profound effect on reduction of Serum Creatinine value. Hence the null hypothesis (NH) is proved. But Drug 5 only shows profound effect on reduction of serum creatinine value. Therefore the alternate hypothesis is only proved for Drug 5.
Drugs with their p values for various clinical parameters is shown from Tables 1–6. All of these results show that result of p value for Drug 5 after two tailed t-tests for the clinical parameters FBS, PPBS, HBA1C, serum creatinine, TC, TG, LDL, HDL and serum amylase discovered to be statistically significant with p value less than 0.05. So, the Drug 5 shows most positive action in mostly all the clinical parameters such as FBS, PPBS, HBA1C, serum creatinine, TC, TG, LDL, HDL and serum amylase. Hence the alternate hypothesis is proved.
It is inferred from Tables 1–6 that the Drug 1 and Drug 6 did not show any positive action in controlling the TC value because findings are statistically not significant. It is found that the result of p value after two tailed t tests for both Drug 1 and Drug 6 with clinical parameter “TC” are greater than 0.05. Hence the NH is proved. Table 7 represents the format of hypothesis analysis.
| Clinical Parameters/Weeks | 4th Week | 8th Week | 12th Week |
|---|---|---|---|
| FBS | 0.0001 | 0.0001 | 0.0001 |
| PPBS | 0.0001 | 0.0001 | 0.0001 |
| HBA1C | 1.0000 | 1.0000 | 0.0001 |
| Blood urea | 1.0000 | 1.0000 | 0.0001 |
| Serum creatinine | 1.0000 | 1.0000 | 1.0000 |
| TC | 1.0000 | 1.0000 | 1.0000 |
| TG | 1.0000 | 1.0000 | 0.0001 |
| LDL | 1.0000 | 1.0000 | 0.0001 |
| HDL | 1.0000 | 1.0000 | 0.0001 |
| Serum amylase | 1.0000 | 1.0000 | 0.0001 |
Response of Drug 1 with their p values for various clinical parameters.
| Clinical Parameters/Weeks | 4th Week | 8th Week | 12th Week |
|---|---|---|---|
| FBS | 0.0001 | 0.0001 | 0.0001 |
| PPBS | 0.0001 | 0.0001 | 0.0001 |
| HBA1C | 1.0000 | 1.0000 | 0.0001 |
| Blood urea | 1.0000 | 1.0000 | 1.0000 |
| Serum creatinine | 1.0000 | 1.0000 | 1.0000 |
| TC | 1.0000 | 1.0000 | 0.0001 |
| TG | 1.0000 | 1.0000 | 0.0001 |
| LDL | 1.0000 | 1.0000 | 0.0001 |
| HDL | 1.0000 | 1.0000 | 0.0001 |
| Serum amylase | 1.0000 | 1.0000 | 0.0001 |
Response of Drug 2 with their p values for various clinical parameters.
| Clinical Parameters/Weeks | 4th Week | 8th Week | 12th Week |
|---|---|---|---|
| FBS | 0.0001 | 0.0001 | 0.0001 |
| PPBS | 0.0001 | 0.0001 | 0.0001 |
| HBA1C | 1.0000 | 1.0000 | 0.0001 |
| Blood urea | 1.0000 | 1.0000 | 1.0000 |
| Serum creatinine | 1.0000 | 1.0000 | 1.0000 |
| TC | 1.0000 | 1.0000 | 0.0001 |
| TG | 1.0000 | 1.0000 | 0.0001 |
| LDL | 1.0000 | 1.0000 | 0.0001 |
| HDL | 1.0000 | 1.0000 | 0.0001 |
| Serum amylase | 1.0000 | 1.0000 | 0.0001 |
Response of Drug 3 with their p values for various clinical parameters.
| Clinical Parameters/Weeks | 4th Week | 8th Week | 12th Week |
|---|---|---|---|
| FBS | 0.0001 | 0.0001 | 0.0001 |
| PPBS | 0.0001 | 0.0001 | 0.0001 |
| HBA1C | 1.0000 | 1.0000 | 0.0001 |
| Blood urea | 1.0000 | 1.0000 | 1.0000 |
| Serum creatinine | 1.0000 | 1.0000 | 1.0000 |
| TC | 1.0000 | 1.0000 | 0.0001 |
| TG | 1.0000 | 1.0000 | 0.0001 |
| LDL | 1.0000 | 1.0000 | 0.0001 |
| HDL | 1.0000 | 1.0000 | 0.0001 |
| Serum amylase | 1.0000 | 1.0000 | 0.0001 |
Response of Drug 4 with their p values for various clinical parameters.
| Clinical Parameters/Weeks | 4th Week | 8th Week | 12th Week |
|---|---|---|---|
| FBS | 0.0001 | 0.0001 | 0.0001 |
| PPBS | 0.0001 | 0.0001 | 0.0001 |
| HBA1C | 1.0000 | 1.0000 | 0.0001 |
| Blood urea | 1.0000 | 1.0000 | 1.0000 |
| Serum creatinine | 1.0000 | 1.0000 | 0.0326 |
| TC | 1.0000 | 1.0000 | 0.0001 |
| TG | 1.0000 | 1.0000 | 0.0001 |
| LDL | 1.0000 | 1.0000 | 0.0001 |
| HDL | 1.0000 | 1.0000 | 0.0001 |
| Serum amylase | 1.0000 | 1.0000 | 0.0040 |
Response of Drug 5 with their p values for various clinical parameters.
| Clinical Parameters/Weeks | 4th Week | 8th Week | 12th Week |
|---|---|---|---|
| FBS | 0.0001 | 0.0001 | 1.0000 |
| PPBS | 0.0001 | 0.0001 | 0.0001 |
| HBA1C | 1.0000 | 1.0000 | 0.0001 |
| Blood urea | 1.0000 | 1.0000 | 0.0001 |
| Serum creatinine | 1.0000 | 1.0000 | 1.0000 |
| TC | 1.0000 | 1.0000 | 1.0000 |
| TG | 1.0000 | 1.0000 | 0.0001 |
| LDL | 1.0000 | 1.0000 | 0.0001 |
| HDL | 1.0000 | 1.0000 | 0.0001 |
| Serum amylase | 1.0000 | 1.0000 | 0.0001 |
Response of Drug 6 with their p values for various clinical parameters.
| Hypothesis/drug | Drug 1 |
Drug 2 |
Drug 3 |
Drug 4 |
Drug 5 |
Drug 6 |
||||||
| NH | AH | NH | AH | NH | AH | NH | AH | NH | AH | NH | AH | |
Where NH- Null hypothesis; AH- Alternative hypothesis.
Format of hypothesis analysis.
From the Table 8 and Figures 1 and 2, it is being presumed that, for Drug 5 more variety of clinical criteria reveals relevance action for various populations. The p values for the clinical parameters FBS, PPBS, HBA1C, serum creatinine, TC, TG, LDL, HDL, and serum amylase are statistically significant (p < 0.05) for Drug 5 than Drug 1, Drug 2, Drug 3, Drug 4 and Drug 6.
| Parameters/Drugs | Drug 1 |
Drug 2 |
Drug 3 |
Drug 4 |
Drug 5 |
Drug 6 |
||||||
|---|---|---|---|---|---|---|---|---|---|---|---|---|
| NH | AH | NH | AH | NH | AH | NH | AH | NH | AH | NH | AH | |
| FBS | ✓ | ✓ | ✓ | ✓ | ✓ | ✓ | ||||||
| PPBS | ✓ | ✓ | ✓ | ✓ | ✓ | ✓ | ||||||
| HBA1C | ✓ | ✓ | ✓ | ✓ | ✓ | ✓ | ||||||
| Blood Urea | ✓ | ✓ | ✓ | ✓ | ✓ | ✓ | ||||||
| Serum Creatinine | ✓ | ✓ | ✓ | ✓ | ✓ | ✓ | ||||||
| TC | ✓ | ✓ | ✓ | ✓ | ✓ | ✓ | ||||||
| TG | ✓ | ✓ | ✓ | ✓ | ✓ | ✓ | ||||||
| LDL | ✓ | ✓ | ✓ | ✓ | ✓ | ✓ | ||||||
| HDL | ✓ | ✓ | ✓ | ✓ | ✓ | ✓ | ||||||
| Serum Amylase | ✓ | ✓ | ✓ | ✓ | ✓ | ✓ | ||||||
Response of Drug for various clinical parameters over a period of 12 weeks.
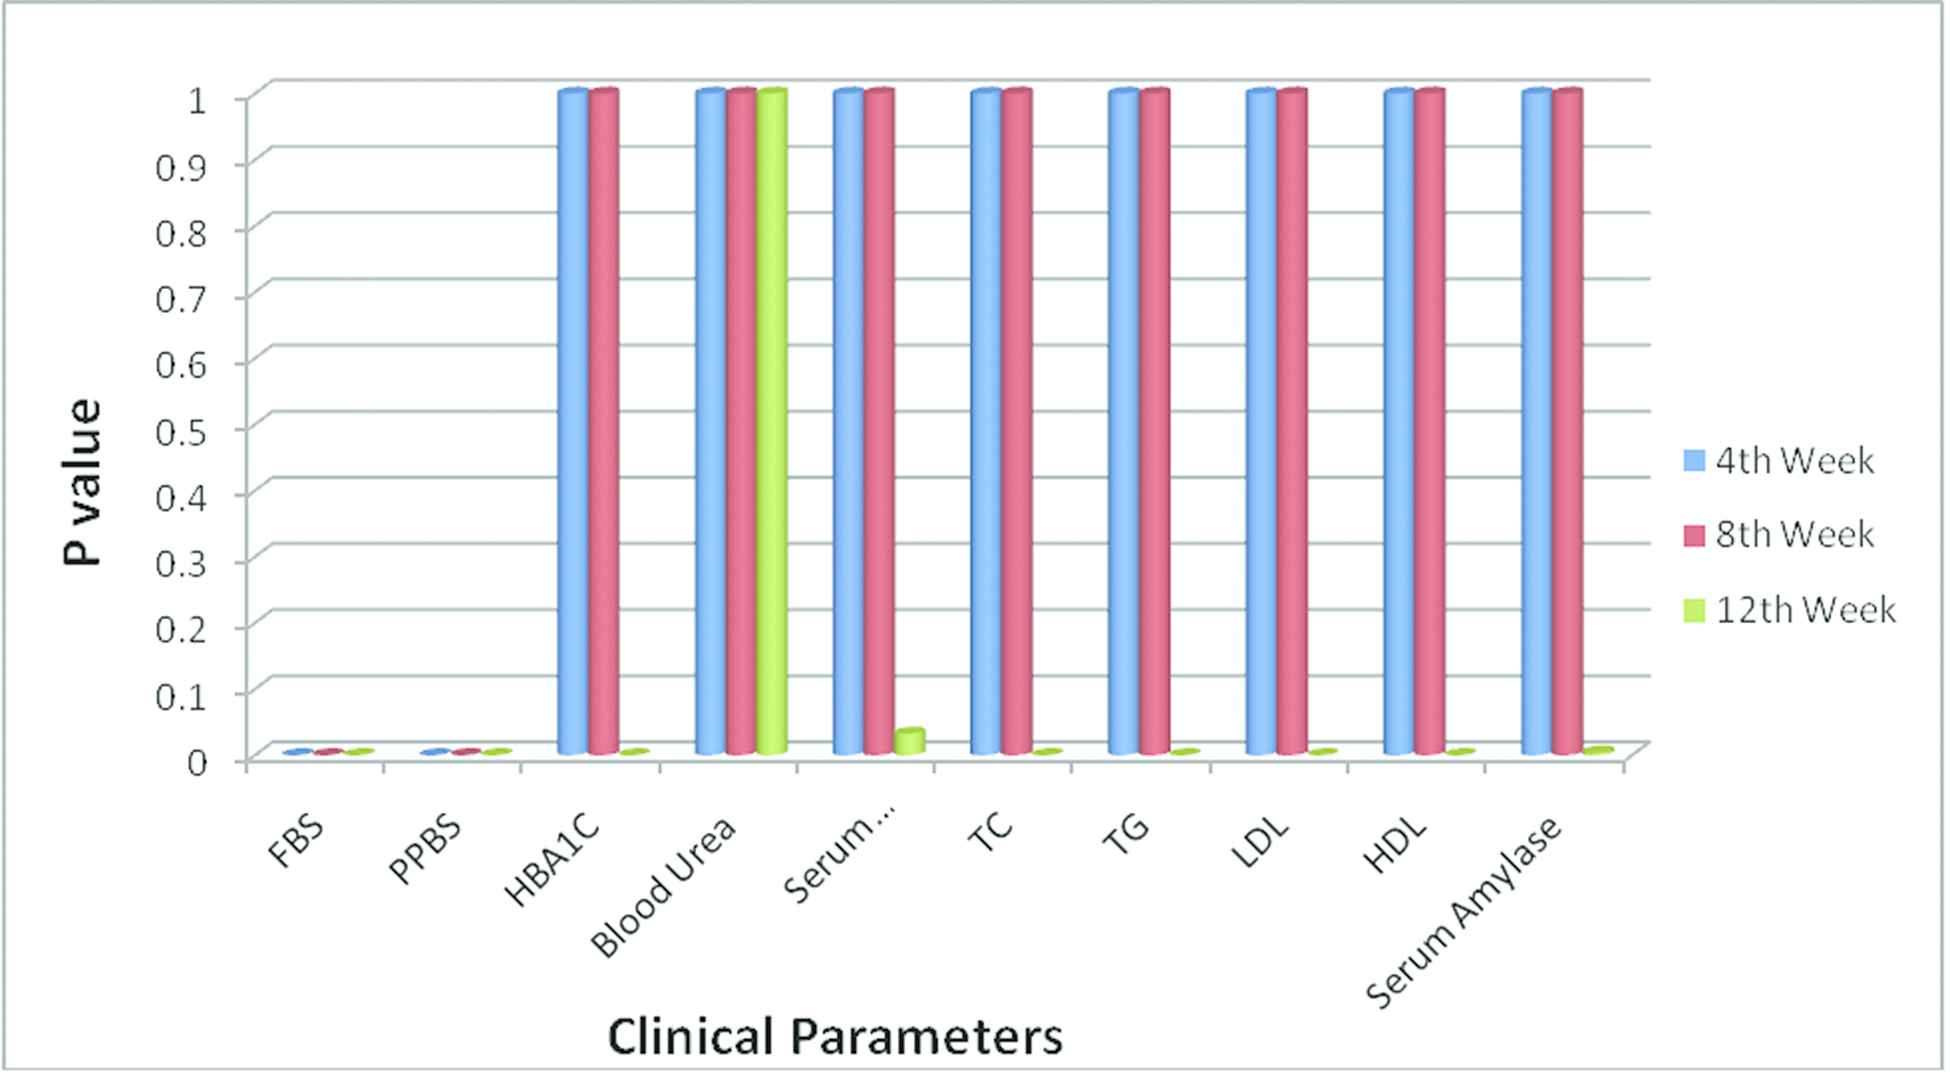
Response of Drug 5 with their p values for various clinical parameters.
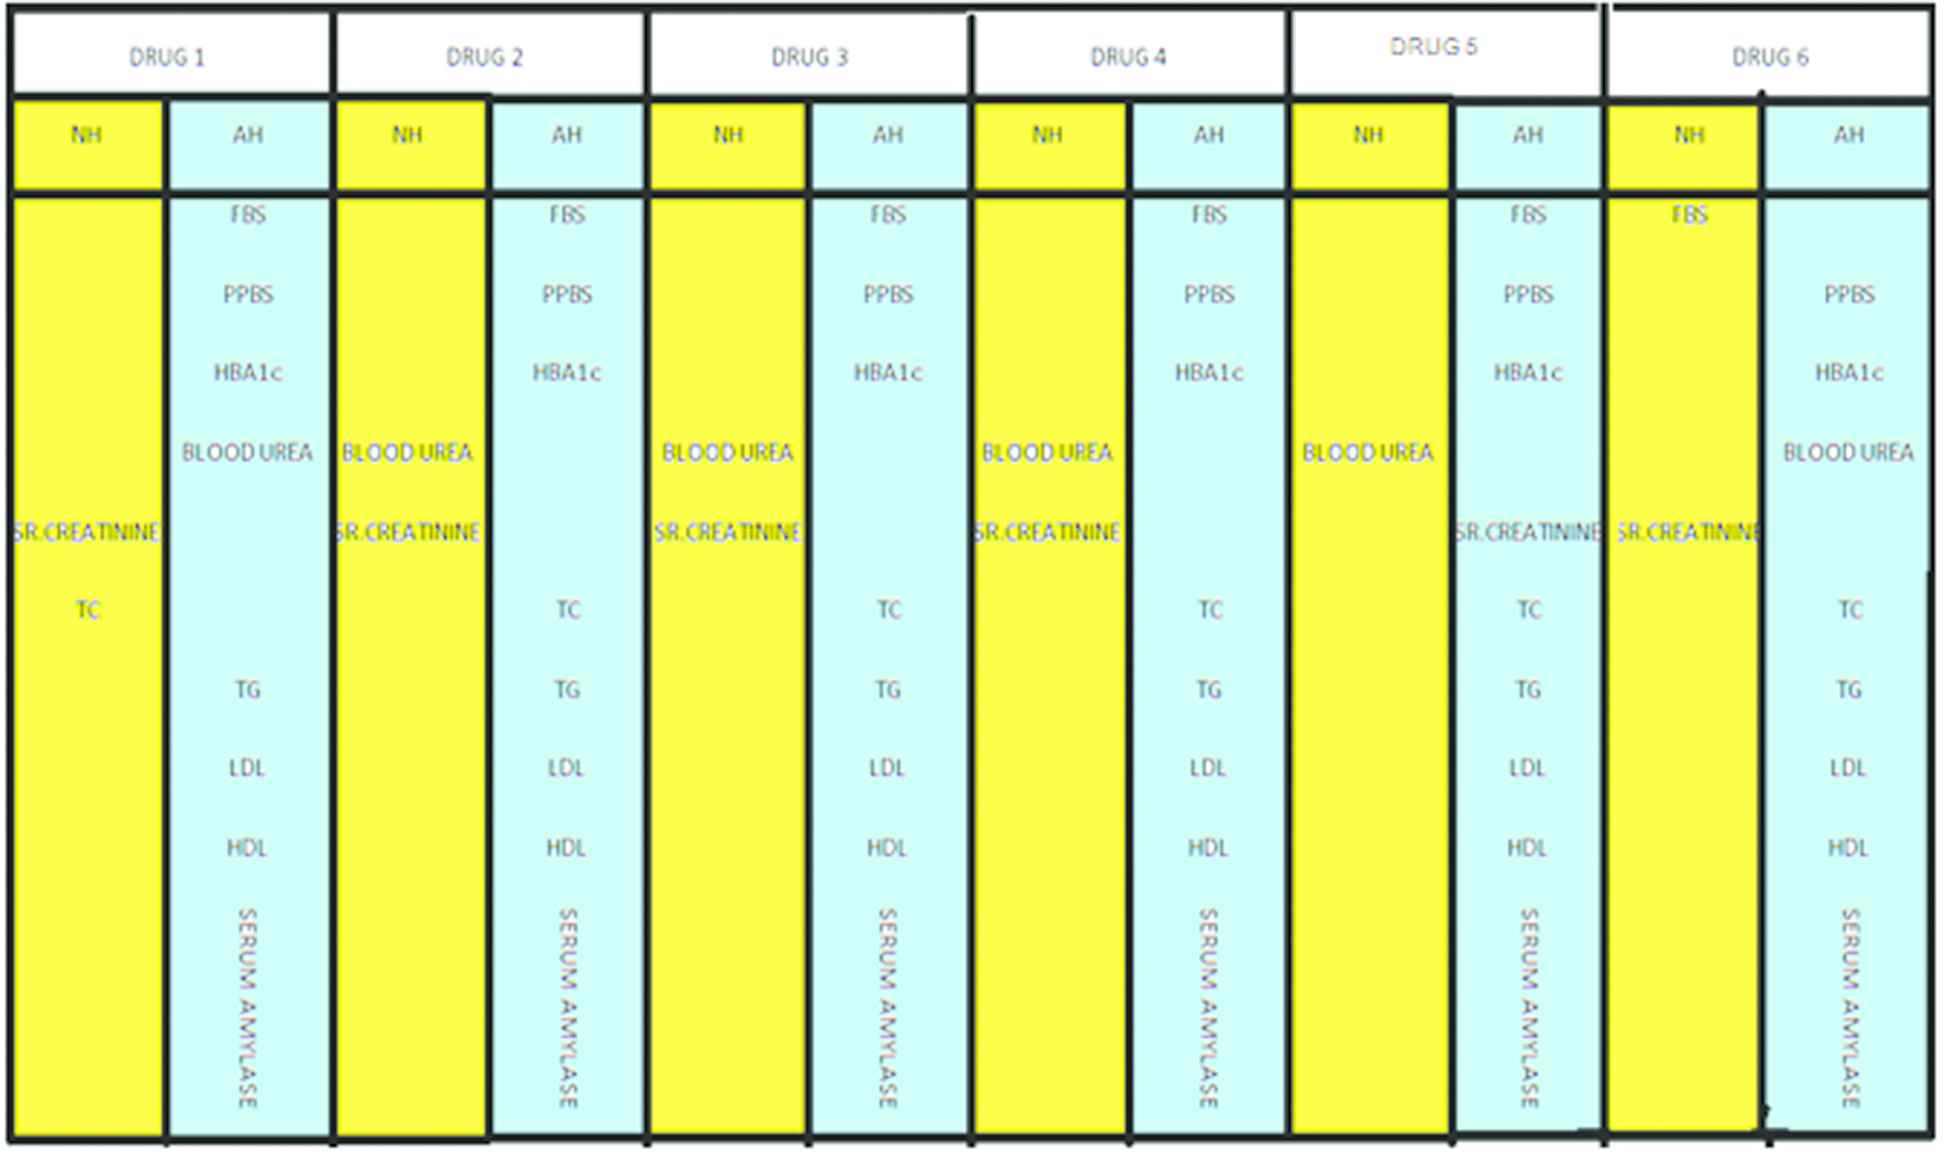
Response of Drug for various clinical parameters over a period of 12 weeks.
Figure 3 shows the hypothesis of the drugs for the respective clinical parameters. Here the value 0 in the graph represents NH and value 1 represents AH. For instance, clinical parameter FBS shows AH for all the drugs except Drug 6. Similarly clinical parameter Blood Urea shows AH for only Drug1 and Drug 6, whereas the remaining drugs it shows NH. Clinical parameter Sr. Creatinine shows AH only for Drug 5 and the remaining drugs it shows NH. Thus the graph represents the relationship between the clinical parameters and the hypothesis of drugs.
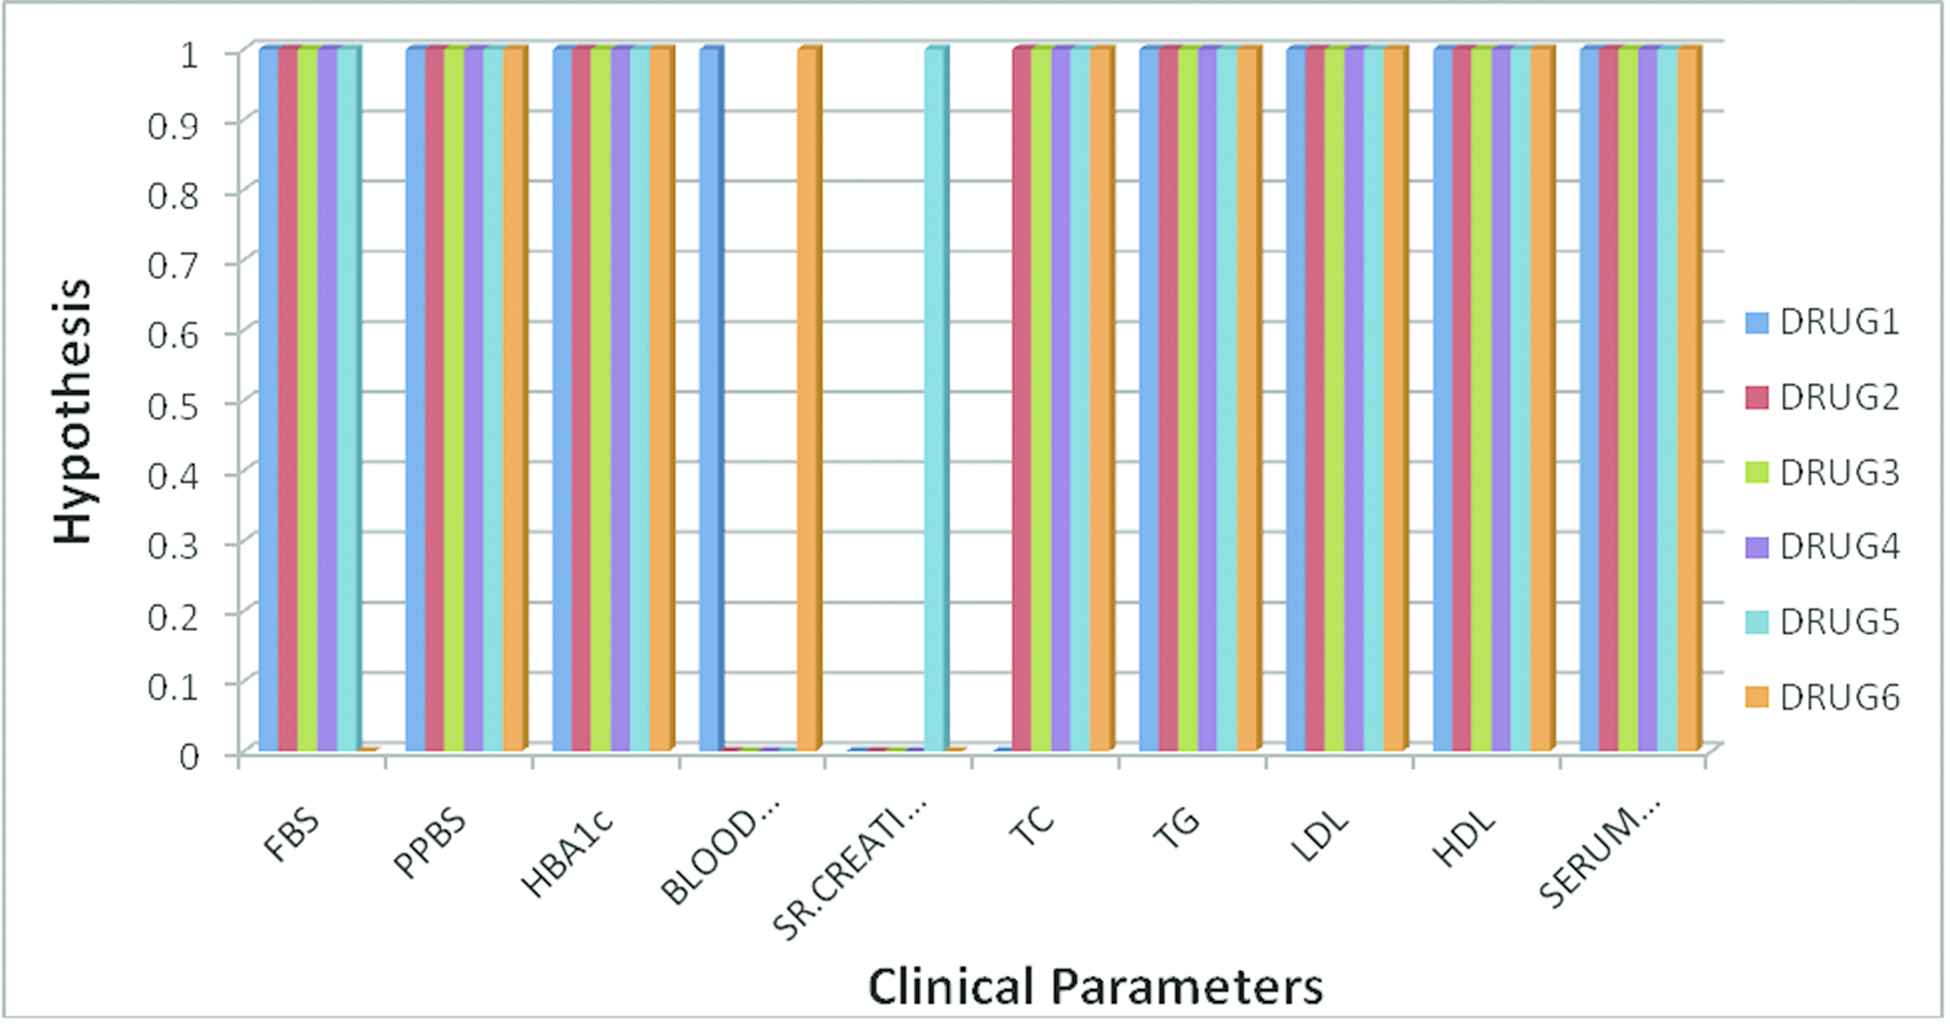
Clinical parameters and its statistical significance for various drugs.
5. CONCLUSION
Accurate diagnosis of disease is a challenging task and is often delayed due to many factors which complicate the disease diagnosis and also the patient's life can be saved by precise diagnosis of the disease.
In this work, the drugs specified with various combinations are given periodically to the patients and then variation in clinical parameters is computed using the statistical and machine learning approach which results in the null hypothesis or AH. The null hypothesis, denoted by H0, is usually the hypothesis that sample observations result purely from chance. The alternative hypothesis denoted by H1 or Ha, is the hypothesis with sample observations and influenced by some nonrandom cause. When this system is made automated it results in providing the significant value p < 0.05 with the patient's clinical report and it is recommended for the various levels of people.
Compared to that of other Drugs, the combination of metformin + sitagliptin drug after treatment showed most positive response in the clinical parameters FBS, PPBS, HBA1C, serum creatinine, TC, TG, LDL, HDL and serum amylase in earlier weeks.
It is concluded from the present study that metformin + sitagliptin was effective in the therapy of diabetes mellitus in regard to competence as well as safeness. It was a safe and effective medicine in terms of really marginal or absence of side results compared to various other drugs. The monitoring made from this research validate using metformin + sitagliptin combination for the treatment of diabetic issues. Thus may be included in the treatment procedure of diabetes in the future.
As an extension to this work, the success rate of the drug recommendation can be improved by considering the feedback score given by the patients for identifying the more suitable drug.
CONFLICTS OF INTEREST
The authors declare they have no conflicts of interest.
AUTHORS'S CONTRIBUTIONS
S.Appavu alias Balamurugan, K.R.Saranya, S.Sasikala and G.Chinthana conceived and worked together to achieve this work. S.Appavu alias Balamurugan was responsible for Methodology, Validation and Project Administration. K.R.Saranya was responsible for analysis, investigation, data curation and writing-original draft preparation. S.Sasikala was responsible for writing-review, editing and supervision. G.Chinthana was responsible for experimental investigation, visualization and Evaluation. All the authors wrote, edited and revised the article.
Funding Statement
This research received no external funding.
ACKNOWLEDGMENTS
Authors thank the editors and the anonymous reviewers for their insightful comments which improved the quality of the paper.
REFERENCES
Cite this article
TY  - JOUR
AU  - S. Appavu Alias Balamurugan
AU  - K. R. Saranya
AU  - S. Sasikala
AU  - G. Chinthana
PY  - 2021
DA  - 2021/02/19
TI  - Statistical and Machine Learning Approaches for Clinical Decision on Drug Usage in Diabetes with Reference to Competence and Safeness
JO  - International Journal of Computational Intelligence Systems
SP  - 859
EP  - 868
VL  - 14
IS  - 1
SN  - 1875-6883
UR  - https://doi.org/10.2991/ijcis.d.210212.002
DO  - 10.2991/ijcis.d.210212.002
ID  - AppavuAliasBalamurugan2021
ER  -