
An Intelligent Hybrid System for Forecasting Stock and Forex Trading Signals using Optimized Recurrent FLANN and Case-Based Reasoning
- DOI
- 10.2991/ijcis.d.210601.001How to use a DOI?
- Keywords
- Stock forecasting; Dynamic time window; Recurrent FLANN; Firefly algorithm
- Abstract
An accurate prediction of future stock market trends is a bit challenging as it requires a profound understanding of stock technical indicators, including market-dominant factors and inherent process mechanism. However, the significance of better trading decisions for a successful trader inspires researchers to conceptualize superior model employing the novel set of techniques. In light of this, an intelligent stock trading system utilizing dynamic time windows with case-based reasoning (CBR), and recurrent function link artificial neural network (FLANN) optimized with Firefly algorithm is designed. The idea of using CBR module is to offer a dynamic window search to assist the recurrent FLANN architecture for superior fine-tuning the trading operations. This integrated stock trading system is intended to pick the buy/sell window of target stock to maximize the profit. To demonstrate the applicability of the projected system, the time-series stock data from IBM, Oracle and in currency Euro to INR and USD to INR exchange data on daily closing stock prices are used for simulation. The performance of the proposed model is assessed using error measures such as mean absolute error and mean absolute percent error. Furthermore, the experimental results obtained with/without using CBR is exhibited for different stock and Forex trading data.
- Copyright
- © 2021 The Authors. Published by Atlantis Press B.V.
- Open Access
- This is an open access article distributed under the CC BY-NC 4.0 license (http://creativecommons.org/licenses/by-nc/4.0/).
1. INTRODUCTION
A significant portion of gross domestic product (GDP) is sourced from the corporate sector in the developed countries since the USA accounts for 70% of GDP from earnings of corporate revenue. Even the corporate in developing countries like India contribute a chunk of 15% toward its GDP. After globalization, majority of companies from the domicile have started expanding their businesses globally and referred to as multinational companies (MNCs). These companies raise funds by offering their shares to the general public through the open market. Consequently, financial market has been expanded and becomes a lucrative avenue for investment. People can buy the share, hold them, or sell them as per their convenience, and the difference in buying and selling price is the profit earned. To maximize the earning, every customer wait for the right time to buy/sell a particular portfolio. The trading opportunities are aggravating with an exponential increase in the number of companies listed under the ambit of stock exchange.
Further, the advancement of information technology, especially in the finance and securities domain, provided the growth impetus of the financial sector leap and bound. In the last two decades, most of the trading is done electronically. Trading can be executed from an electronic gadget with an Internet connection due to which a stockbroker has rendered on-line trading services. Currently, most of the subscribers buy-and-sell stocks online [1].
With the advent of stock markets, people have the option to have multiple avenues to make their asset grow by investing in several funds like mutual funds, hedge funds, and index funds according to their financial profile. However, returns from these funds bank on the stock market performance only. Additionally, the stock market is also preferred by the Governments for venturing a part of their provident funds, retirement funds, and citizens' saving to achieve attractive returns for their inhabitants. As a result, the financial markets have evolved rapidly expanding into an interconnected global marketplace.
The stock market is extremely volatile and continuously fluctuating. As a result, the stock price of a company is unsteady. Stock indices forecasting is a complex and challenging task as it involves analyzing many factors. Despite this, the inherent capability of artificial intelligence, soft computing, machine learning (ML), and data mining [2], the complicated task of future stock price prediction becomes somehow practicable. However, in the face of several techniques and one method claims their superiority over others in terms of prediction and efficiency, the task of buying/selling decisions for an individual becomes strenuous.
The stock market prediction system intends to analyze the stock-related financial data by utilizing a suitable prediction model, verifying the output, and conferring recommendation to users/investors to either invest or not. The stock prediction system helps to strategies the investment options and in return to achieve the goal. Generally, the analysis is of two types: i) The fundamental analysis which requires the factors such as states of economy, performance of the industry, political climate, government stability, consumer price index, and the value of the company [3] and ii) Technical analysis comprises of the genesis of the particular stocks, market sentiment, volume, and financial strength of the company. This kind of analysis can be further categorized into four classes—statistical analysis, pattern-based analysis, ML enabled analysis [4], and sentiment analysis [1]. Besides this, the hybrid approach signifies the combination of above two or more methods, e.g., blending statistical and ML approaches [5].
Statistical models commonly use traditional statistical techniques for prediction and classification, such as multiple regression, discriminate analysis, and logistic regression. The most practiced statistical models, which are also known as time series group of models [6] are autoregressive (AR) model, AR moving average (ARMA), and AR integrated moving average (ARIMA) [7,8]. These models fall under univariate analysis because they use time series as an input variable for the model building process. Apart from this, another group of statistical approaches that usually utilize multiple input variables has been studied, and they are linear discriminant analysis (LDA), quadratic discriminant analysis (QDA), and regression algorithms [9].
Pattern analysis in the context of financial data analysis deals with the unearthing of patterns and trends hidden in the data, such as charts, which is important for further technical analysis. Familiar chart patterns especially conformed from their shapes are gaps, spikes, flags, and many more [10]. Future growth of a stock can be accessed by studying visual patterns [11], such as perceptually important points (PIP).
A wide spectrum of ML strategies, such as decision tree, support vector machine (SVM), random forest, logistic regression, and naïve Bayes [12], have been employed for short and long term predictions of the various stock value in contemporary time. However, it has been instanced that in financial market analysis, artificial neural networks (ANNs) have become a leading one surpassing peers [13] in popularity. ANN technique has gained enough popularity because of its fundamental competencies in dealing with any nonlinear function efficiently with high precision. To increase the capability of capturing complex real-world problems, which exhibit nonlinear characteristics, ANNs have been implemented successfully in various applications [14,15]. Nevertheless, sentiment analysis, which is a recent stock analysis technique, has taken the center stage since last decade. Its main feature is to extract text from social network postings and microblogging sites automatically. Further, the extracted texts are classified into positive or negative trends by using ML or a dictionary-based approach.
The current research proposes an intelligent stock trading system integrating dynamic time windows (DTW) [16], with case-based reasoning (CBR) [17]. For optimization purpose [18], This study has utilized Firefly algorithm (FA) [19–23] in order to test and enhance the weight factor of CBR and recurrent function link artificial neural network (FLANN) [24]. The choice of meta-heuristic FA is attributed to widespread relevance of this particular technique in various computational intelligence systems.
This study of designing an intelligent decision system for predicting subsequent values of stocks/currency exchange has three significant contributions:
First, the study proposes developing a dynamic trading system by utilizing recurrent FLANN where the network parameters are subjected for optimization by using FA.
Second, this study substantiates the employability of FA by testing the system with contemporary stock and forex data and revealing fairly consistent forecasting results than the conventional back propagation (BP) algorithm using multilayer perceptron (MLP) models.
Third, and more important, in the wake of false alarm that may be ignited by FLANN system, this study put into force case-based dynamic window (CBDW) and CBR techniques in order to have an additional view of confirming the action of buying or selling.
The paper is structured as follows. Section 2 describes the techniques employed for research. Detailed methodologies along with experimental design are presented in Section 3. Experimental results and its analysis along with performance evaluation are carried out in Section 4. The paper is concluded in Section 5 highlighting its limitation and potential future improvement.
2. PRELIMINARIES
In this section, we recall the several techniques which will be employed for designing the proposed system to provide the investors with a better trading mechanism with more accurate predictions.
2.1. Contemporary Studies on Hybrid Intelligent Systems
Several investigations have been carried out in exploring entire gamuts of the stock trading system to assist the traders and stock brokers. However, we have outlined few of the contemporary literature those employed hybrid intelligent and soft computing techniques for discovering trading rules and to predict stock price swing in short and long term. Few systems incorporate Rough set for inducing trading rules and further genetic algorithm for optimizing those rules [25]. In contrary, Rough set is also being utilized for attribute reduction and wave-let neural network for system modelling [26]. Additionally, we have identified systems those employ customized techniques such as weighted multicategory generalized eigen value SVM [27], multikernel adaptive filters (MKAF) coupled with kernel canonical correlation analysis (KCCA) [28], variants of extreme learning machine, [29] and multiple regression [30] for intelligent data modeling and trade decision-making.
2.2. Recurrent Functional Link Artificial Neural Network
Unlike MLP, FLANN system doesn't have any hidden layer, which makes this kind of neural net simple to understand, since learning methods adopted for training this kind of model is not sophisticated. In FLANN, the dimension of the input space can be amplified by extending the input vector with intensifying impression of the input nodes [31]. The amplified input features from the input layer are being supplied to the network such that weighted sums of inputs are provisioned and the net input is computed. Further it serves as input to activation function and is transformed to corresponding output [32]. A typical FLANN structure is shown in Figure 1. The first order consists of the two input data x1 and x2, however the second order of the network is realized centering around the extension of input formulated on x1 and x2.
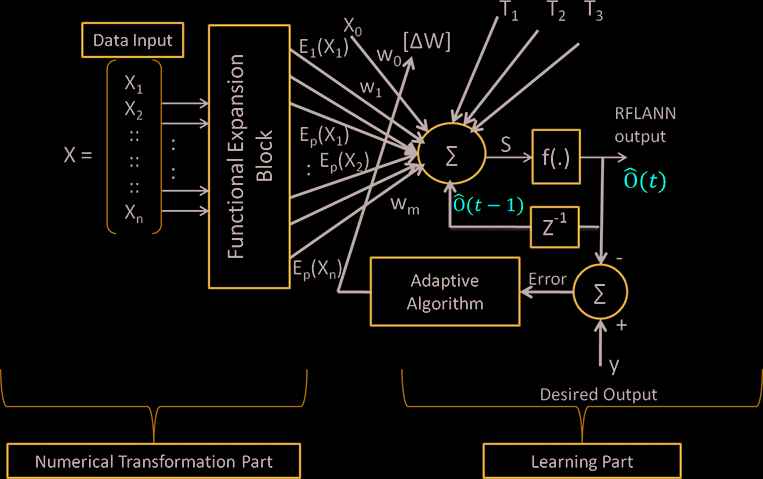
An abstract view of recurrent function link artificial neural network (FLANN) model depicting functional blocks as input and weight correction ∆W on employing back propagation learning algorithm.
The input to FLANN structure is X = [x1, x2, x3, …, xi, …, xn]. Functional expansion of elements [x1, x2, x3, …, xi, …, xn] increase the input dimensionality with the help of Nonlinear Functional Expansion Blocks (NFEBs) say the vector [E].
For our stock forecasting problem, [x1, x2, x3, …, xi, …, xn] represent daily closing price of the particular stock. For an example, say IBM stock, then [x1, x2, x3, …, xi, …, xn] represent Day1, Day2 …, Dayn closing price of IBM stock.
The set of the input and target vector is given below is used during training and testing the model.
Training data set is selected for input:
Testing data set is:
During training and testing the model, it takes a row of data as input to FEB and where the elements are functionally prolonged through a set of lower and higher order Chebyshev differential equations up to p = 5 using Chebyshev polynomials as given below.
The vector E is defined as:
The net input to the input layer is as represented in Eq. (1)
The estimated output of ith iteration of the proposed model is calculated using Eqs. (2) and (3).
Where W is the weight vector exhibited in Eq. (4)
Let there are K number of I/O pattern pairs to be learned by the Recurrent Functional Link Artificial Neural Network (RFLANN). Let the input pattern vector is passed through a FEB and producing a corresponding one-dimensional expanded vector E with dimension N × 1 and the weight matrix of dimension 1 × N represented in W = [w1w2…‥wN]. The linear weighted sum, si is passed through the activation function to produce the output.
Values between 0 and 1 are assigned to weight vector randomly to train the network. Further, it is updated in the perspective of the negative gradient of the performance function [33,34].
2.3. Learning Methods
We intend to employ the following learning methods for updating the FLANN weight vector.
The BP algorithm
Meta-Heuristic FA
2.3.1. BP learning
The learning process computes the deviation in terms of error and this error is subsequently minimized by updating the network weights as number of epochs progress and it is in accordance with. the following Eqs. (5) and (6).
Where wt+1 is the updated weight on correcting weight wt while training.
When the input pattern X from the training set is presented to the network, it produces an output O different from the target output, the variation between actual and target output is the error denoted as et. W is the set of weights.
2.3.2. Meta-heuristic firefly algorithm
A functioning system of interdependent parts resembles a living thing that so-called fireflies usually produce and secretion of light by their organs. Among numerous disparities, the idea behind blinking light in the firefly's life cycle is related to the mating time. The unique pattern of flashing light is to draw the attention of mating partners, and their willingness on mating and such correct luminous secretion method is to convey two fireflies of the same class for sex. The FA [35–37] is such motivated from the life cycle of the firefly, especially their movement behavior in copulating phase and it is briefed as follows:
The unisex fireflies are spellbound to each other.
The uniqueness of flashing light holds the key in their mating phase. That's why the beauty and intensity of unique pattern of flashing light is a salient factor i.e., the less intense firefly is mesmerized and moves toward the brighter one.
Flashing light affects the prettiness so that it is included into main objective function.
Accordingly, the intensity of flashing light is represented in Eq. (7) as given below.
Where, L0 = Initial light intensity, Li = Intensity of light at i th iteration, η = Light absorption coefficient, and d = distance between two fireflies.
The distance between two fireflies' fi and fj is calculated using Eq. (8).
Movement of firefly can be calculated as using Eq. (9).
The concerned weight matrix is adjusted using Eq. (10).
Initially a fixed value is assigned to the flashing light absorption parameter, afterward the parameters are updated in the optimization phase.
2.4. Legendre Polynomial Function
We make use of Legendre Polynomials in designated FLANN model to inflate the input pattern. Lower order Legendre Polynomials are given in Eq. (11) for an input value ‘x’.
Polynomials of desired order can be developed by using the recursive procedure as shown in Eq. (12).
2.5. Case-Based Reasoning
CBR is one among the promising techniques for modelling an intelligent structure. It guarantees the validity of intricate, shapeless reasoning and decision-making by implementing previously worked out solutions to related problems. Typically, a CBR system while addressing an issue passes through four steps, such as Retrieving, Reusing, Revising, and Retaining. In research, the software effort prediction system has been designed by blending CBR with ANN. While analyzing concerning factors such as accuracy, explanatory value, and configurability, it has been figured out that the prediction systems generated more accurate results than earlier approaches. Hence, the integration of CBR and ANN is a feasible and useful way to design a more precise forecasting system. Nevertheless, this research further proposes to replace with a low complexity FLANN instead of ANN-based architecture.
2.6. Case-based Dynamic Windows
This technique based on the principle of searching for an appropriate dynamic window that manifests the most similar environment in the last stock data and intends to predict the stock price for the next day based on an adaptation of the patterns identified in the window [16].
The weekly stock price fluctuation using a CBDW is formulated with a sample database indices as represented in Figure 2; the first window having data for five days 1, 2, 3, 4, and 5, Y1, Y2, Y3, Y4, and Y5 represent a variation in stock price with inputs as Xi where i = 1, 2, …, n. The shortest Euclidean distance between the current data pattern (i.e., five-day stock price variation) and the previous stock price swing in the past six months is computed, which signifies the closest case. Thus, the average stock price variation of the following day, Yk−a+1, can be instrumental in determining the value of Yk+1.
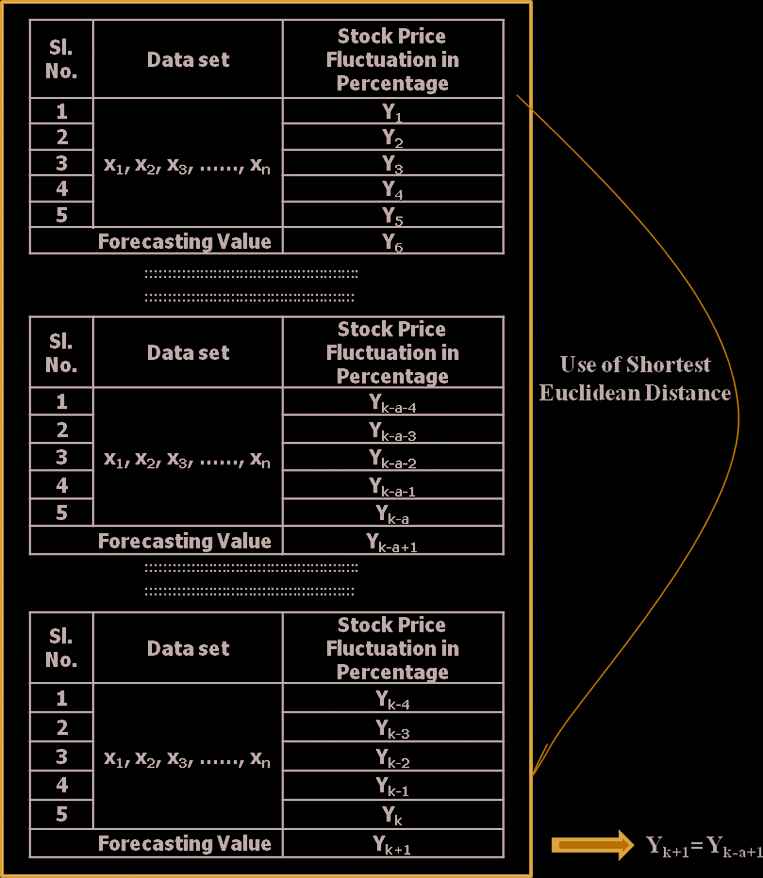
Stock price fluctuation by week using case-based dynamic windows.
Case retrieval:
With the time period is determined as three, if a trader happens to predict the stock price swing of the following day using the DTW search, it will be processed using above projected mapping, owing to this the most significant time window can be outlined as mentioned below:
Suppose today is 14th day
With time period as 5, the most similar window would be the 7th one i.e., days from 7 to 9
Then trader can use the value of day 10 as the forecasting index for the day 15.
The time period and its span are finalized in consultation with investors or experts. A short period (daily or weekly) forecasting model has a small length (value of n is low). For each case in the case base, the key is traced in the case, and similar cases are retrieved by using the DTW search. An analogous case is extracted from the stock data based on the similarity coefficient. A similarity test can be done by using the Euclidean distance. All these similar cases are being incorporated for simulating the price change of subsequent days. For a balanced approach, the weighted average of those outperformed cases determines stock price fluctuation of the following days. The searching for a similar case in CBDW is depicted in the form of a flowchart, as shown in Figure 3.
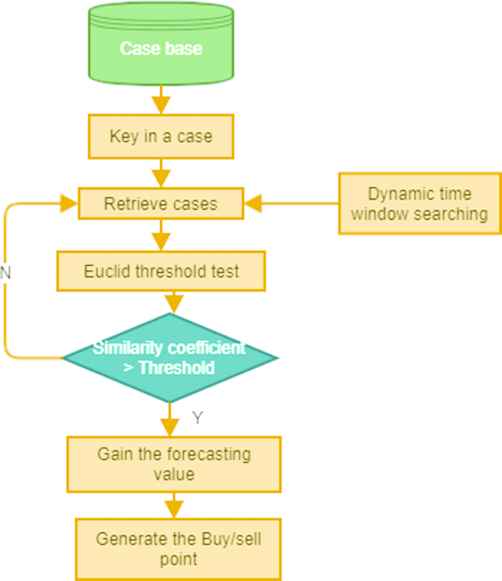
Flowchart for case-based dynamic window search.
We try to explain the generation of buy/sell points by integrating the FLANN and CBDW. Once the result of FLANN received and the buy/sell point is picked up, the next step CBDW technique is executed. CBDW scans the database consisting of the past six months of stock information. Consequently, similar patterns describing stock fluctuation trends are fetched, and by incorporating the tendency emanated, price fluctuation for the next day is projected. Incidentally, if the turning point searched by CBDW matches the prediction from FLANN, then the turning point is ensured. The buy/sell points are reduced after applying the CBDW to the results of FLANN. So as a result of this, some profit fewer turning points can be avoided.
3. METHODS
3.1. Experimental Set Up
The hybrid approach is put into practice by using MATLAB R2017 on a system accompanied by an Intel Core i5 processor, 8GB RAM and Microsoft Windows-2010 OS. Current study intends to develop a stock trading decision support system (DSS) known as FAFLANNCBDW, comprising of three stages technically. The target data is prepared and normalized using Eq. (13). Next, the normalized data is processed by the system in three stages, they are:
Using recurrent FLANN which adopt BP learning approach to predict the buy/sell price of a particular stock.
Employing FA to optimize the weights of the FLANN model so as to obtain the optimal parameter settings for training the network and to minimize the error rate.
Making use of CBDW for refining the outcome of FLANN. The detailed procedure of integrating these three modules for investigating DSS is exhibited in Figure 4.
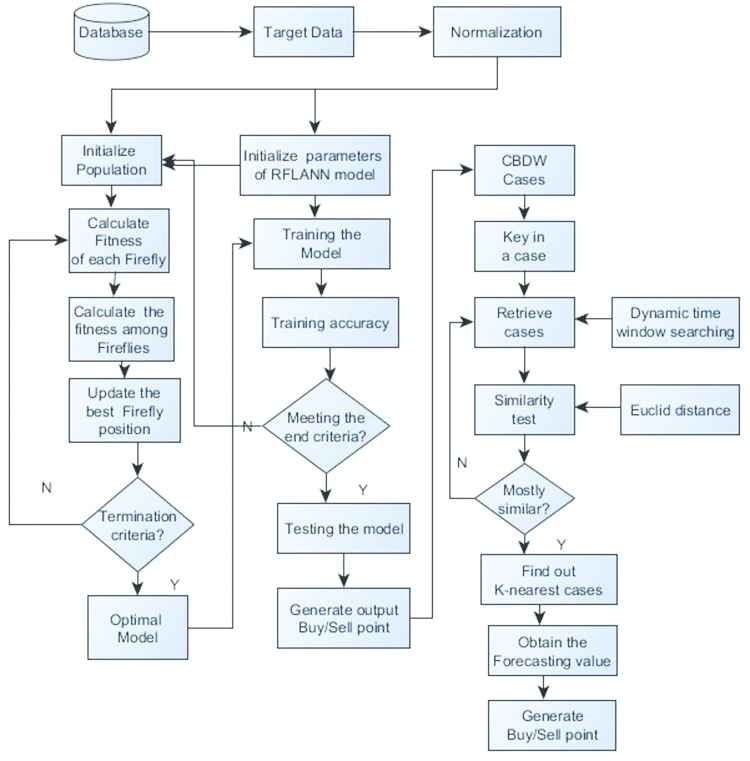
Detailed process of investigation by trading system.
We have utilized stock data such as IBM and Oracle and two currency exchange data EURO to INR and USD to INR for the current study. For the experimental investigation, historical data of 2000 trading days are collected, out of which the first 1750 days of data is utilized for training the model, and the remaining 250 days of trading data is exercised for testing and validating the model. The simulation of the proposed model is meant for obtaining daily forecast relying on the closing price of the index in different modes, as mentioned below:
The Recurrent FLANN Architecture with randomized parameter
The Recurrent FLANN Architecture with optimized parameter optimized with FA
The Recurrent FLANN Architecture integrated with CBDW with optimized parameter optimized with FA
3.2. Data Normalization
Prior to training the model, the collected data of 2000 days has to be processed to make it standardized. Afterward, the data has been normalized by employing the formula as given in Eq. (13),
3.3. Forecasting Analysis with Technical Indicators
The Technical indicators are expected to predict further by inspecting at past trends. Hence, those indicators, along with inputs to the network, have been useful for forecasting. Three indicators are considered in the study owing to their relevance, they are Relative Strength Indicator (RSI) (5), Price Volume Change Indicator (PVC) (5), and Moving Average Volume Indicator (MAVI) (5, 20) represented in Eqs. (14–16) have been identified as parameters for forecasting. The choice of picking these three variables is attributed to their focus on two prime aspects of stock data i.e., price, volume, and the combination of both price and volume. The selected three indicators are mentioned below:
TI-1: Relative Strength Indicator
TI-2: Price Volume Change Indicator
TI-3: Moving Average Volume Indicator
Where xi is the closing price on the ith day, ∆xi = xi − xi−1, ∆vi = vi − vi−1. For the trading volume, MV5 represents 5-day moving average while MV20 is 20-day moving average.
3.4. Assessment of Forecasting Results
The accuracy of the model is estimated in the function of actual financial data collected and performance measures of the proposed model is evaluated by mulling few criteria for error estimation. Among them, mean absolute error (MAE) is a standard measure of forecasting error in time series analysis.
The MAE is calculated using Eq. (17).
Second representation of assessment, mean absolute percentage error (MAPE) signifies the average prediction error between actual and forecasting figure which in turn signals the repulsive effect of very small prices.
MAPE method is defined in Eq. (18).
Where e = yt − y, yt and y represents the forecast and actual values; and N is the number of forecasting period.
4. EXPERIMENTAL RESULTS AND PERFORMANCE EVALUATION
The performance evaluation is carried out on proposed forecasting model using all the four datasets consisting of two stocks and two currency exchange data. The model is tested in two ways;
Using BP learning method i.e., with random use of learning parameters. Figures 5–8 represent the testing results of all the selected four datasets
Using BP learning method i.e., with optimized learning parameters with the use of FA. Figures 9–12 show the testing results of all selected four datasets
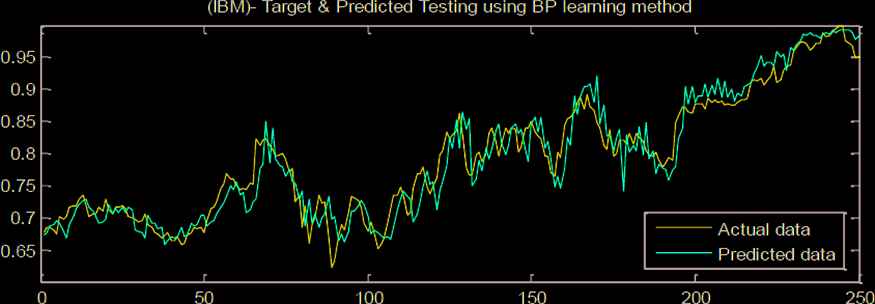
Testing results of IBM stock data using back propagation (BP) learning method.
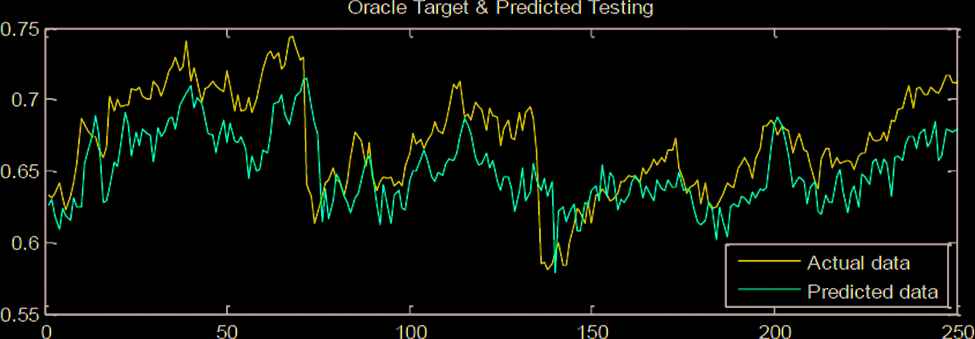
Testing results of Oracle Stock data using back propagation (BP) learning method.
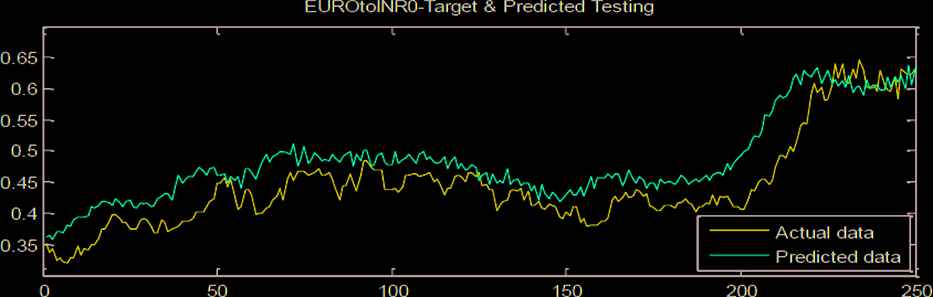
Testing results of EURO to INR currency exchange data by back propagation (BP) learning method.
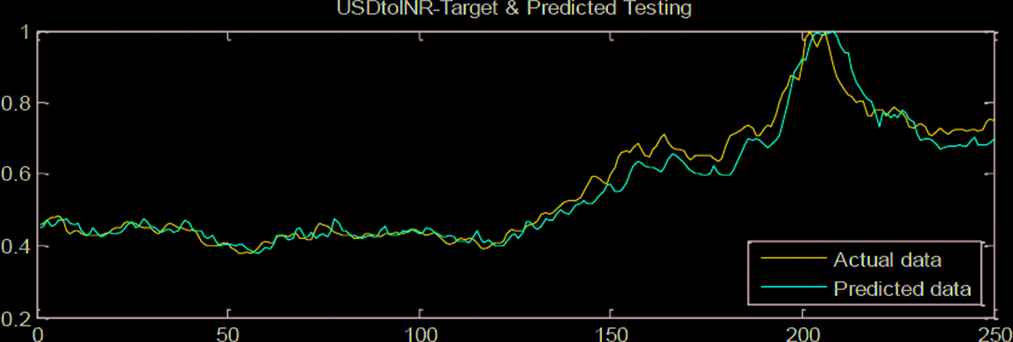
Testing results of USD to INR currency exchange data using back propagation (BP) learning method.
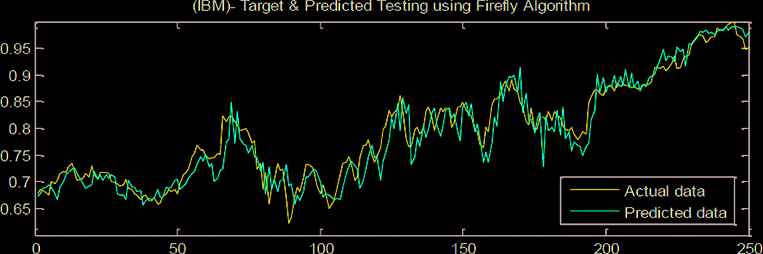
Testing results of IBM stock data using Firefly algorithm.
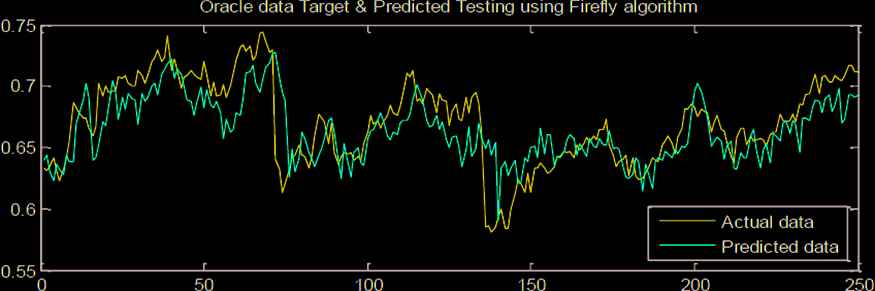
Testing results of Oracle stock data using Firefly algorithm.
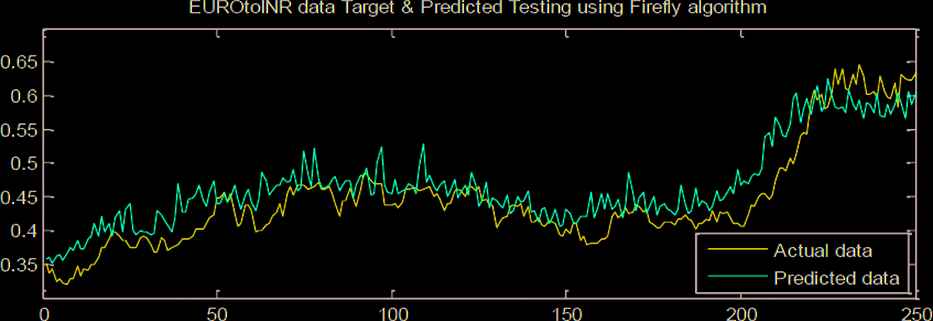
Testing results of EURO to INR currency exchange data using Firefly algorithm.
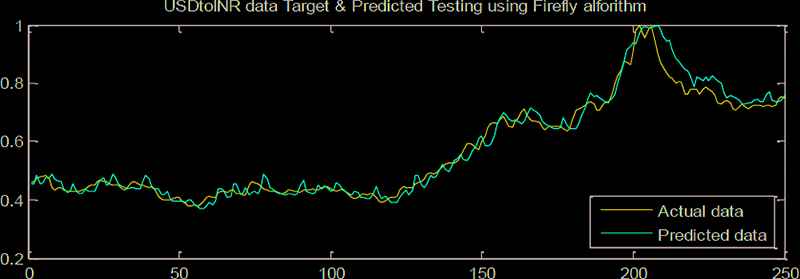
Testing results of USD to INR currency exchange data using Firefly algorithm.
4.1. Using BP Learning Method i.e., with Random Use of Learning Parameters
The following Figures 5–8 are showing the testing results of all the selected four datasets (IBM, Oracle, EURO to INR, and USD to INR) for illustrating the testing results of 250 days on normalized data. These 250 days are considered one day ahead of training data. The proposed model is tested on the various performance indices popularly known as MAPE, MAE and it is represented in Table 1 on all the selected datasets.
| Dataset | MAE |
MAPE |
||
|---|---|---|---|---|
| Stock/Currency data name | Using recurrent FLANN | Using recurrent FLANN with Firefly algorithm | Using recurrent FLANN | Using recurrent FLANN with algorithm Firefly |
| IBM | 0.6590 | 0.0240 | 2.7034 | 2.5419 |
| Oracle | 0.0247 | 0.0190 | 3.3675 | 2.5980 |
| EURO to INR | 0.0289 | 0.0203 | 4.2645 | 2.9994 |
| USD to INR | 0.0561 | 0.0325 | 5.9521 | 4.2426 |
Performance comparison on daily closed price of few stocks.
4.2. Using BP Learning Method with FA
The following Figures 9–12 are showing the testing results of all the selected four datasets (IBM, Oracle, EURO to INR, and USD to INR) for illustrating the testing results of 250 days on normalized data. These 250 days are considered one day ahead of training data and the same set of dataset used for validating without using FA. The analysis of the results is compared in Table 1 on all the selected datasets to demonstrate the improvement in performance of the model when used FA to optimize learning parameters instead of using random learning parameters.
Table 1 reveals that MAE is significantly lessened from 0.659 to 0.024 when Firefly optimization method is employed for IBM stock data. However, the change in value of MAE for Oracle stock data from 0.0247 to 0.019 mirrors a slight diminution. Further, for currency exchange Euro to INR, the deviation is least while USD to INR the reduction in value of MAE is noteworthy. Moreover, all the tested stock shown lowering in MAE as well as MAPE value contemplating the boosting of prediction accuracy.
The Table 1 is used for performance comparison of the model when tested on 250 days of testing data and the comparison clearly suggests both the performance measures used in our study gives better result when FA is used to optimize the learning parameters.
Two weeks of data (14 days) are considered and analyzed for trading of stocks to help traders to make the profit over buy-and-sell of each trading. Table 2 shows the effect of varying parameters upon buy/sell for trading stocks simultaneously and to compute the profit over buy-and-sell for each trading. The use of the CBDW search explained below.
Decide the length of the search window (a short/long period of forecasting model).
Retrieve the Case based on the time period is decided, the process of DTW will search by using the mapping process and produce similar time window.
More than one case will be reused based on the threshold test considered in our study i.e., if the similarity coefficient is over the threshold, then it will be set as Buy otherwise Sell.
| Date | Output FLANN | From Buy/Sell Point | Output of CBDW | Final Decision |
|---|---|---|---|---|
| Day-1 | 0.4588 | Buy | 3.4315 | Buy |
| Day-2 | 0.4638 | – | 3.7337 | – |
| Day-3 | 0.5174 | Sell | −3.1673 | Sell |
| Day-4 | 0.4812 | – | 1.6101 | – |
| Day-5 | 0.466 | Buy | 3.6691 | Buy |
| Day-6 | 0.522 | Sell | 5.2207 | – |
| Day-7 | 0.4761 | – | 1.8851 | – |
| Day-8 | 0.4625 | Buy | −1.7919 | – |
| Day-9 | 0.4633 | – | −0.427 | – |
| Day-10 | 0.4681 | Sell | −4.2754 | Sell |
| Day-11 | 0.4761 | – | 6.7959 | – |
| Day-12 | 0.4795 | – | 4.6777 | – |
| Day-13 | 0.46 | Buy | 0.7581 | Buy |
| Day-14 | 0.467 | Sell | −2.562 | Sell |
Two weeks of the buy/sell points from CBDW assisted with proposed model for IBM stocks.
Table 2 exhibits the generation of Buy/Sell point by optimizing FLANN with FA and further integrating with CBDW. First, if the Buy/Sell point turned out using FLANN, then CBDW is being employed to search the last six months IBM stock data in order to identify the pattern. Having realized that, it will fetch the tendency of stock movement and will predict the price fluctuation of the following day accordingly. If the result provided by CBDW respect to turning point matches to that of FLANN outcome, then turning point is reaffirmed. It's clear from Table 2, in Day 1 the turning point “Buy” generated by FLANN is corroborated by CBDW execution. However, in Day 6, the decision of “Sell” provided by FLANN is not being further validated by the result of CBDW indicating the wrong trading alarm. Correspondingly, the case in Day 7, indicate a False alarm also. Hence, utilisation of CBDW facilitates reaffirmation of Buy/Sell point along with evasion of profitless points.
4.3. Comparative Analysis with Existing Techniques
Data collection and techniques were adopted in previous literature published by the author Bebarta et al. [38] are given below. This proposed model also tested on same Spain electricity market data along with IBM data to compare the results and the assessment factor on MAPE which signifies the average prediction error between actual and forecasting and it is represented in Figure 13.
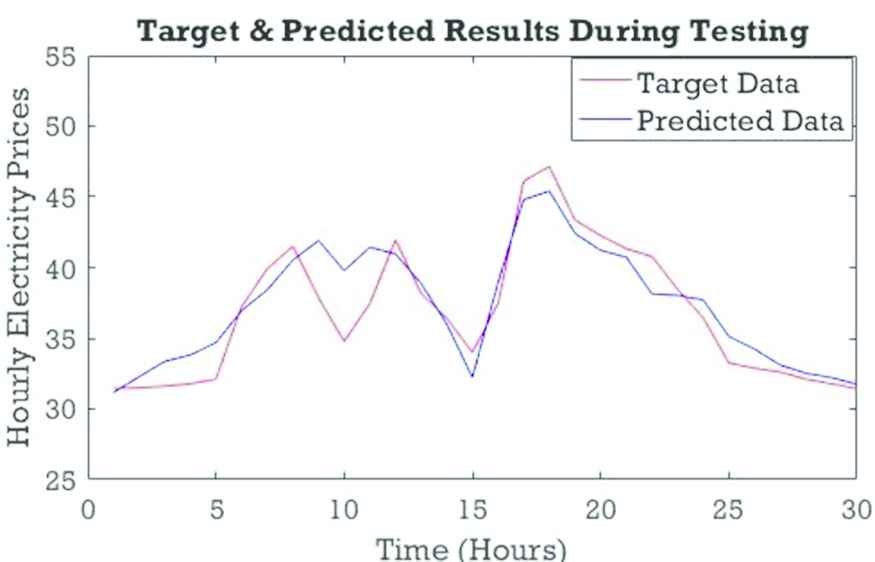
Testing result of by utilizing Spain electricity market data.
From Table 3, it is clear that our adopted model (RFLANN) has least MAPE value as compared to their peers indicating the proposed model outperformed other models.
| Sl. No. | Model Tested | MAPE (%) |
|---|---|---|
| 1 | ARIMA | 8.05 |
| 2 | WNN-ARIMA | 7.27 |
| 3 | NNWT | 6.95 |
| 4 | FNN | 7.32 |
| 5 | ARMAFLNN | 5.40 |
| 6 | RFLANN | 5.37 |
ARIMA: Auto Regressive Integrated Moving Average; WNN: Wavelet Neural Network; NNWT: Neural Network wavelet transform; FNN: Functional Link Neural Network; ARMAFLNN: Auto Regressive Moving Average Functional Link Neural Network.
Comparison of various models based on MAPE using Spain electricity market price during winter season.
5. CONCLUSION, LIMITATION, AND FUTURE SCOPE
In this study, an intelligent stock trading system by integrating DTW, CBR, and FLANN optimized with an evolutionary algorithm is developed. First an efficient forecasting model is developed using recurrent FLANN, next the FA is employed to optimize the network parameters. Finally, a CBDW and CBR are integrated to help our recurrent FLANN to eliminate the false alarm for a buy/sell point. The developed model is tested using four different stocks data (IBM, Oracle, EURO to INR, and USD to INR). Performance comparison based on the MAE and MAPE values reveals that employing the FA in lieu of Backpropagation learning decreases the error rate, thus attain higher performance. The empirical results show that the proposed model integrated with CBDW and CBR assisted by recurrent FLANN can also reduce the false alarm of buying or selling decisions. The designed system provides an effective solution for stock and Forex market trend prediction. However, the system suffers from a limitation as profit along with risk factors has not been accounted for when generating Buy/Sell decision. Hence, the work can be extended by calculating the risk-adjusted returns after transaction costs, and these returns may be compared with the returns provided by a benchmark such as buy-and-hold. A suitable risk major such as conditional value at risk (CVaR), modified value at risk (MVaR) can be incorporated to adjust return for risk.
CONFLICTS OF INTEREST
The authors declare no conflict of interest.
AUTHORS' CONTRIBUTIONS
Conceptualization, D.K.B.; methodology, D.K.B.; software, D.K.B.; validation, D.K.B.; formal analysis, T.K.D.; investigation, T.K.D.; writing—original draft preparation, T.K.D.; writing—review and editing, C.L.C.; visualization, C.L.C. and X.G.; supervision, T.K.D.; project administration, X.G.; funding, X.G. All authors have read and agreed to the published version of the manuscript.
ACKNOWLEDGMENTS
The authors would like to thank the editors of IJCIS and anonymous reviewers for their time and review of this manuscript.
REFERENCES
Cite this article
TY  - JOUR
AU  - D. K. Bebarta
AU  - T. K. Das
AU  - Chiranji Lal Chowdhary
AU  - Xiao-Zhi Gao
PY  - 2021
DA  - 2021/06/07
TI  - An Intelligent Hybrid System for Forecasting Stock and Forex Trading Signals using Optimized Recurrent FLANN and Case-Based Reasoning
JO  - International Journal of Computational Intelligence Systems
SP  - 1763
EP  - 1772
VL  - 14
IS  - 1
SN  - 1875-6883
UR  - https://doi.org/10.2991/ijcis.d.210601.001
DO  - 10.2991/ijcis.d.210601.001
ID  - Bebarta2021
ER  -