
An Outranking Approach for Gene Prioritization Using Multinetworks
- DOI
- 10.2991/ijcis.d.210608.003How to use a DOI?
- Keywords
- Disease gene prioritization; Multicriteria decision support; Fuzzy outranking; Multinetwork analysis; Topological analysis; Omic integration
- Abstract
High-throughput experimental techniques such as genome-wide association studies have been instrumental in the identification of disease-associated genes. These methods often produce large lists of disease candidate genes which are time-consuming and expensive to experimentally validate. Computational gene prioritization methods are required to identify relevant genes from a larger pool of candidates. Research has shown that the integration of diverse “omic” evidence can reduce the candidate-gene search space. In this paper we present a general framework that integrates “omic” data using a multinetwork approach and topological analysis to prioritize disease-candidate genes. Specifically, we propose a data integration method within a multicriteria decision analysis context using aggregation mechanisms based on decision rules identifying positive and negative criteria for judging gene-candidates ranks. The proposed multinetwork disease gene prioritization method is applied to the prioritization of disease genes in ovarian cancer progression. Using this approach we uncovered known ovarian cancer genes GSTA1, ERBB2, IL1A, MAGEB2, along with significantly enriched Kyoto Encyclopedia of Genes and Genomes (KEGG) pathways ErbB signaling and pathways in cancer. Relatively high predictive performance (area under Receiver Operating Characteristic [ROC] curve 0.704) was observed when classifying epithelial ovarian high-grade serous carcinoma cancer early and late stage RNA-Seq expression profiles from individuals using 10-fold cross-validation.
- Copyright
- © 2021 The Authors. Published by Atlantis Press B.V.
- Open Access
- This is an open access article distributed under the CC BY-NC 4.0 license (http://creativecommons.org/licenses/by-nc/4.0/).
1. INTRODUCTION
The identification of genes associated with disease development and progression is an important and complex challenge. Discovery of disease-associated genes has resulted in an improved understanding of gene functions, their interactions and pathways and application in medical treatments. However, diseases are rarely the result of an abnormality in a single gene. Instead they involve interactions between cellular and molecular processes [1]. Relationships between these processes can be encoded in a comprehensive network known as the interactome which is the collection of all physical interactions within a cell. These interactions include regulatory and metabolic interactions [2].
The advances in large-scale high-throughput technologies such as linkage analysis and Genomic-Wide Association Studies (GWAS) have aided in our understanding of genes and their roles in complex diseases [3]. Such approaches have been instrumental in the generation of candidate disease genes. A recent meta-analysis GWAS study on Parkinson’s disease by Nalls et al. [4] used a set of 7,893,274 variants across 13,708 cases and 95,282 controls and identified 6 new loci involved in Parkinson’s disease. Genome-wide linkage analysis for congenital heart defects was performed by Flaquer et al. [5] using MOD-score analysis resulting in the identification of 4 novel candidate genes. A common problem with these methods is the resulting large lists of disease-candidate genes. Due to limited resources, scientists can only select a subset of genes to investigate further in the preclinical setting. To address these limitations, computational gene prioritization methods need to be developed to aid in the identification of relevant genes from a larger pool of candidates.
Networks have been for gene prioritization [6,7] whereby a set of seed genes (such as known disease genes) are used by an algorithm to rank potential candidate genes in a network. This is based on the premise that genes in close proximity to seed genes in a network are more likely to be associated with a disease [8]. A number of methods to measure proximity include PageRank, HITS [9], random walk with restart [10] and diffusion [11]. A comprehensive comparison of state-of-the-art gene prioritization methods can be found in [12]. Gene prioritization tools include ENDEAVOUR [13] and ToppGene [14] which rank candidate genes by applying algorithms to a network based on annotation similarity scores calculated from enrichment values based on a training data set of seed genes. AlignPI proposed by Wu et al. [15] uses a network alignment approach to predict disease genes. GeneProspector [16] prioritizes potential disease candidates using a curated literature database of genetic association studies. A review of computational tools can be found in [17].
Use of biological networks such as Protein–Protein Interaction network (PPIN) and network analysis is a commonly used approach for the uncovering of disease genes [18]. The PPIN is an important biological network widely used in areas from drug target prediction, predication of protein complexes, functions, identification of essential genes and network motif discovery [19]. Studies such as [20] have applied graph centrality measures to PPINs integrating breast cancer signatures to understand the relationship between gene expression and clinical outcome of breast cancer. Li et al. [21] applied centrality measures to a weighted PPIN for essential gene prediction. Taylor et al. [22] indicated that the alterations in the physical interaction network may be an indicator of breast cancer prognosis [23]. A study by Lui et al. [24] used GWAS studies, genetic variants, gene coexpression data and PPIN to identify significant interaction among Alzheimer and Parkinson Disease susceptibility genes.
Data integration is another approach which collates “omic” data from different sources such as the Gene Ontology (GO) and tissue and pathway along with PPIN data for disease gene prioritization. For example, Chen et al. [25] proposed a prioritization approach that integrated multiple data sources such as gene coexpression and PPIN along with a unified graphic representation of information. The study by Li et al. [26] constructed a weighted tissue-specific network by integrating DNA methylation and PPIN data, a pagerank algorithm was applied to rank candidate disease genes. This approach outperformed the ranking on the original PPIN. The study by Cantini et al. [27] applied a community detection consensus clustering algorithm to a multinetwork of layers including mRNA cotargeting and gene coexpression to identify disease genes in cancers including lung and colorectal. Enrichment analysis confirmed candidate genes involvement in cancer related regulatory pathways. Bennett et al. [28] recently proposed a mixed integer nonlinear programming model, SimMod that optimizes modularity across layers of a multilayer network resulting in a single partition of composite communities. When applied to yeast networks of physical, genetic and coexpression interactions strongly enriched composite modules in terms of the GO were identified. Current multinetwork analysis methods consider the prioritized lists of disease-candidate genes obtained from different networks as a total ordered set of disease-candidate genes. In this paper we propose a novel outranking-based gene ranking method to prioritize disease-candidate genes. We present our generalized framework (Figure 1) which integrates multiple omic data sources including: (1) human PPIN, (2) RNA-Seq coexpression, (3) Transcription Factor (TF) CoTargeting and (4) tissue-specific data. We apply this framework to prioritize disease genes involved in high-grade serous carcinoma (HGSC) ovarian cancer progression. Ovarian HGSC is associated with substantial mortality and morbidity but, can be difficult to detect at its earliest stage due to its molecular complexity and clinical behavior [29]. Therefore, identification of key gene signatures at an early stage will be highly helpful. A list of significant disease-related genes derived from the integrative framework using RNA-Seq, protein interaction, tissue and TF cotargeting network data are ranked by our outranking method in decreasing order of preference. The method is based on ELECTRE III [30] to create a fuzzy outranking relation and then, it uses a multiobjective evolutionary algorithm [31] to exploit the outranking relation and to derive a prioritized list of candidate disease genes. The approach takes into consideration criteria including network centralities. The proposed framework is advantageous as data from diverse “omic” networks can be combined using the proposed fuzzy outranking and multiobjective evolutionary algorithm to produce a prioritized list of disease-candidate genes. Furthermore, this generalized framework can be applied to other diseases and multinetwork problem domains. The remainder of the paper is outlined as follows. In Section 2 the Methods are detailed including an overview of the framework and data sets applied. Section 3 highlights key results in terms of both classification predictive power and biological relevance. Conclusions and future work are presented in Section 4.
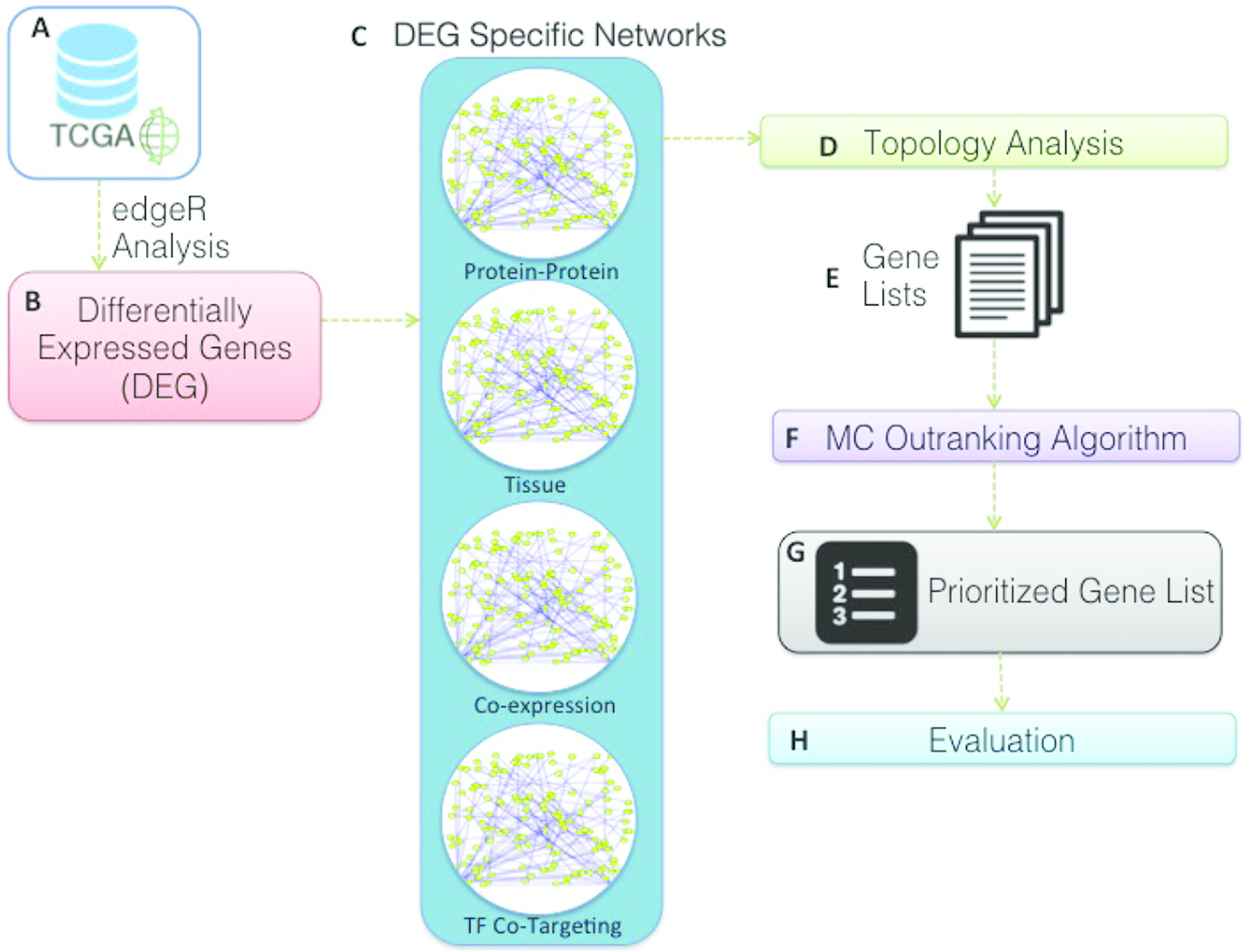
Proposed framework integrating diverse networks using novel outranking approach. This framework consists of a number of steps including data selection and preprocessing (stage A and B), diverse network construction (stage C) analysis and ranking (stage D, E and F) and evaluation of prioritized lists (stage G and H).
2. METHODS
To identify the key genes whose expression may discriminate between early and late stage ovarian HGSC (OV) samples, we developed the following methodology illustrated in Figure 1. This approach consists of a number of steps: (A) extracting RNA-Seq OV gene expression and clinical information, (B) identification of differentially expressed genes (DEG) between early stage and late stage tumor samples, (C) construction of DEG specific networks, (D) analysis of the DEG specific networks to identify stage associated hub genes and their interactors, (E) novel fuzzy outranking algorithm to combine lists of key hub genes across the networks providing a prioritized gene list, (F) evaluation of hub genes including the development of a hub gene-based classifier model to distinguish OV stages.
2.1. Datasets
Transcriptome and clinical ovarian OV data from the TCGA data portal (https://portal.gdc.cancer.gov/) were applied in this analysis. Batch corrected TCGA OV data was downloaded from the MD Anderson TCGA Batch Effects website (http://bioinformatics.mdanderson.org/tcgambatch/) using the category UNC (IlluminaHiSeqRNASeqV2) which we refer to as RNA-Seq in this paper, EB-parametric priors and the PCA assessment algorithm. The data set consists of 20,531 genes across 262 samples.
2.2. Differential Expression Analysis of Individual Genes
DEG analysis of individual genes from the RNA-Seq dataset was carried out using the edgeR Bioconductor package [32]. Construction of DEG specific networks was performed using each of the four networks described in the following section.
2.3. Networks
2.3.1. Protein–protein interaction network
High-quality human protein interactions were obtained from InWeb_IM [33]. PPIs were derived from eight sources including BioGRID [34] and IntAct [35]. This experimental interaction data came from human and model organisms and is scored against a gold standard [33]. PPI confidence scores of 0.10 and above were selected in this paper as they are considered highly reliable [33] resulting in 625,641 pairs.
2.3.2. Coexpression network
Using the TCGA OV dataset we calculate absolute correlation coefficients between 0 and 1 using the Spearman method for gene expression levels among genes. Binary pairs were filtered to include expression values
2.3.3. Tissue-specific functional interaction network
An ovarian tissue-specific functional interaction network was retrieved from the GIANT interface [37]. Greene et al. [37] constructed functional interaction networks of human tissues using a data-driven Bayesian approach. Integration of a large volume of experiments was performed using data from more than 14,000 publications. The tissue-specific network was filtered to only include edges with evidence supporting a tissue-specific functional interaction resulting in 64,594,988 pairs.
2.3.4. TF cotargeting network
The TF cotargeting network was obtained from the study by Cantini et al. [27]. A weighted network was constructed in this study using experimentally validated TF-target interactions using ChIP-seq from ENCODE [38]. The weight of the network links represent TFs shared by gene pairs. The weight of the link is the count of TFs targeting both the genes.
Construction of DEG specific networks was performed using each of the networks described. The set of DEG were mapped to the network nodes via NCBI gene IDs for each network. Each network was filtered based on these DEG and their interactors.
2.4. Topological Analysis
Studies including [39] and [40] have shown how network topological metrics can detect key biological processes. The study by Yu et al. [41] showed how nodes with high betweeness values control most of the information flow in a protein interaction network. Topology-based analysis of metabolic networks has been important in studying their impact on modularity [42] and function and regulation [43]. These networks are represented as an undirected graph,
2.4.1. PageRank
PageRank ranks genes according to importance, that is, connection to other genes. This metric was recently applied to associate gene connectivity with different subtypes of ovarian cancer tumors [45]. PageRank can be described as:
2.4.2. Bonacich power centrality
This metric is used to measure the power of the given node in the network. The Bonacich power of gene
2.5. Outranking Approach for Multinetwork Disease Gene Prioritization
Topological analysis for each of the four networks described in the Networks section was performed and genes from the networks were ranked in terms of their PageRank and their Bonacich Power Centrality values from high to low. This resulted in 8 lists of ranked genes across the four networks. These lists were combined to produce a final list of ranked genes using our proposed outranking algorithm described below.
2.5.1. Preliminaries
For ease of description, some basic multicriteria elements are first defined. Let
The Multinetwork Disease Gene Prioritization problem consists of finding a ranking function or procedure
We consider, in the following, cases in which only ordinal information is available and no other additional information is provided such as the relevance scores.
2.5.2. Specificities of the multinetwork disease gene prioritization problem
Limited Significance of the Prioritization List of Disease-Candidate Genes
The exact positions of genes in one prioritization list of disease-candidate genes have limited significance and should not be overemphasized. For instance, having three potential disease-candidate genes in the first three positions, any perturbation of these three pieces will have the same value. Indeed, in the disease gene prioritization context, the complete order provided by a gene prioritization method may hide ties. In this case, we call such rankings pre orders. Moreover, some genes
Genes with near positions in
Assuming that gene
Partial Priority Lists
Disease gene prioritized lists obtained from each of the “omic” networks are often partial lists. Integration of partial lists raises four major difficulties which we state hereafter, proposing for each of them various working assumptions:
Partial lists can have various lengths, which can favor long lists. We thus consider the following two working hypotheses:
Since there are different genes in the prioritization lists of disease-candidate genes, we must decide which genes should be kept in the consensus ranking. Two working hypotheses are therefore considered:
Hereafter, we call genes which will be retained in the consensus ranking, candidate genes, and genes that will be excluded from the consensus ranking, excluded genes. We also call a candidate gene which is missing in one or more rankings, a missing gene.
Some candidate genes are missing genes in some prioritized list. Main reasons for a missing gene are that it was not ranked or it was indexed but deemed irrelevant; usually this information is not available. We consider the following two working hypotheses:
When assumption
2.5.3. Outranking approach for multi-network disease gene prioritization
Positional methods like Borda count [46], linear combination methods [47], Footrule optimal aggregation [48,49] and Probabilistic methods [50], consider implicitly that the positions of the genes in the prioritized lists are scores giving thus a cardinal meaning to an ordinal information. This constitutes a strong assumption that is questionable, especially when the prioritized lists have different lengths. Moreover, for positional methods, assumptions
Majoritarian methods like Condorcet procedure [51], Kemeny optimal aggregation, and Markov chain methods [52] do not suffer from the above-mentioned drawbacks of the positional methods since they build consensus rankings exploiting only ordinal information contained in the gene prioritized lists. Nevertheless, they suppose that such rankings are complete orders, ignoring that they may hide ties or incompatibilities. Therefore, majoritarian methods base consensus rankings on illusory discriminant information rather than less discriminant but more robust information. Trying to overcome the limits of current integration methods, we found that outranking approaches, which were initially used for multicriteria aggregation problems [30], can also be used for the data integration purpose, where each prioritized list plays the role of a criterion. A representative method of the outranking approach is the ELECTRE III method [53,54]. The ELECTRE III method is based on a pairwise comparison of the genes, leading to fuzzy preference degrees. It is a variation of the Condorcet procedure. A comprehensive literature review on methodologies and applications on ELECTRE can be found in [55]. In this paper, we adapt the ELECTRE III method to the Multinetwork Disease Gene Prioritization problem.
ELECTRE III method starts by a pairwise comparison of each gene to the remaining ones with the aim of accepting, rejecting, or, more generally, assessing the credibility of the assertion gene
the indifference
the coefficients of importance attached to each gene prioritized list.
the possible difficulties of relative comparison of two genes when one is significantly better than the other on a subset of gene prioritized lists, but much worst on at least one gene prioritized list from a complementary subset (veto threshold
The ELECTRE III model allows, with the use of thresholds, to take into account the ill-determination, imprecision, and uncertainty that may affect positions. For instance:
a gene
a gene
a gene
The comparison of genes in the way that has just been described before leads to the construction of a concordance index for each ordered pair of genes
The three thresholds can be defined as follows [56]:
the indifference threshold
the preference threshold
the veto threshold
The choice of thresholds intimately affects whether a particular binary relation holds. While the choice of appropriate threshold is not easy, in disease gene prioritization decision-making situations, there are good reasons for choosing nonzero values for
Using thresholds, the ELECTRE method seeks to build an outranking relation
The test to accept assertion
A concordance principle, which requires that a majority of prioritized lists, after considering their relative importance, are in favor of the assertion (the majority principle), and
A nondiscordance principle, which requires that within the minority of prioritized lists, which do not support the assertion, none of them is strongly against the assertion (the respect of minorities’ principle).
The operational implementation of these two principles is now discussed. We first consider the outranking relation defined for each of the
The
The
With these concepts, it is now possible to measure the strength of assertion
In which
Thresholds and weights represent subjective input provided by the decision maker. Weights in ELECTRE are coefficients of importance and, as [56] notes, are like votes given to each of the gene prioritized list candidates. Criteria weights are crucial factors in any multicriteria decision analysis (MCDA) method as they affect the final solution derived from the aggregation procedure. In this proposal, we set the same importance to each of the eight lists, however, it could be used any MCDA method to set the relative importance for each list such as the one presented in [57].
In the concordance index, we have, in a manner of speaking, a measure of the extent to which we are in harmony with the assertion that
For each pair of genes
This formula assumes that if the strength of the concordance exceeds that of the discordance, then the concordance value should not be modified. Otherwise, we are forced to question the assertion that
Outranking relations are not necessarily transitive and do not necessarily correspond to rankings since directed cycles may exist. Therefore, we need specific procedures in order to derive a consensus ranking. We propose the procedure which finds its roots in [31,58,59]. Our approach for exploitation a fuzzy outranking relation to derive a ranking is to use a multiobjective evolutionary algorithm-based heuristic method. It consists in partitioning the set of genes into r classes. Each class contains genes with the same relevance. Then, based solely on the initially provided information, we elicit a reflexive and antisymmetric crisp outranking relation between the determined classes. After that, with the above as background, we propose a partial order of classes of genes as a recommendation for the Multinetwork Disease Gene Prioritization problem. This approach integrates partitions and relations between classes into the optimization process that the multiobjective evolutionary algorithm performs. Because of space limitations, we omitted the presentation of the ranking procedure. In order to address this gap, the reader can consult the paper [31].
3. RESULTS
In this section we present the results obtained from applying the generalized framework illustrated in Figure 1 to identify OV disease progression genes. We show how the proposed outranking approach was used to prioritize disease candidate genes obtained from multiple diverse networks. Enrichment analysis including GO, Pathway and literature analysis were then performed to demonstrate the effectiveness of the proposed approach. Furthermore, we performed ovarian cancer stage classification using the prioritized gene list obtained from our proposed integrative approach and compare with ToppNet [60].
3.1. RNA-Seq Differential Expression Analysis and Network Construction
We firstly performed differential expression gene (DEG) analysis using the OV RNA-Seq data to identify DEG genes in the data set. DEG analysis was conducted using edgeR [32]. The OV RNA-Seq samples described in the Methods section were divided into two phenotypic groups using the associated clinical data and labeled as either early stage (stage I and II) or late stage (stage III or IV). Raw counts were extracted for these samples and significantly DEG were identified using the paired data with the edgeR package in R using Fisher’s exact test, False Discovery Rate (FDR) adjusted p-value
These DEGs were selected for subsequent network analyses as their expression profiles between early and late state OV cancer indicated possible involvement in disease progression. Each of the four networks described in the Networks section were subsequently filtered to include only the identified DE genes a summary of the networks and their properties are described in Table 1.
| Nodes | 3286 | 242 | 229 | 315 |
| Edges | 4860 | 871 | 307 | 325 |
| Clustering coefficient | 0.114 | 0.223 | 0.196 | 0.022 |
| Centralization | 0.107 | 0.162 | 0.621 | 0.346 |
| Heterogeneity | 4.890 | 1.279 | 4.149 | 3.985 |
DE, Differential Expression; NPPI, protein–protein interaction network; NCOE, gene coexpression network; NTF, transcription factor network; NTissue, tissue-specific functional network.
Global properties of the DE networks.
3.2. Topological Analysis of DEG Networks
Topological analysis of the four different networks based on DEGs was performed. These are (i) protein–protein interaction network (
Each network was represented as a graph
A list of nodes from all four networks were extracted based the measures PageRank and Bonacich Power Centrality. Similar to the approach applied by Taylor et al. [22], for each of the four networks the top 150 were selected for ranking. This resulted in eight lists containing 1071 distinct genes to be prioritized using the proposed outranking algorithm detailed in Section 2.5.
3.3. Application of Outranking Approach
Using the eight lists of ranked genes as input, our outranking algorithm was applied to prioritize disease genes across the different networks. The outcome from the applied algorithm is the list of ranked prioritized genes described in Table 2. A total of 23 prioritized genes were identified from the 1071 distinct genes across the eight lists.
| Gene ID | Gene Symbol | Description |
|---|---|---|
| 84107 | ZIC4 | Zic family member 4 |
| 22839 | DLGAP4 | DLG associated protein 4 |
| 1410 | CRYAB | crystallin alpha B |
| 2938 | GSTA1 | glutathione S-transferase alpha |
| 12064 | ERBB2 | erb-b2 receptor tyrosine kinase 2 |
| 1264 | CNN1 | calponin 1 |
| 23704 | KCNE4 | potassium voltage-gated channel subfamily E |
| 2167 | FABP4 | fatty acid binding protein 4 |
| 5709 | PSMD3 | proteasome 26S subunit, non-ATPase 3 |
| 3552 | IL1A | interleukin 1 alpha |
| 727851 | RGPD8 | RANBP2-like and GRIP domain containing 8 |
| 4438 | MSH4 | mutS homolog 4 |
| 654 | BMP6 | bone morphogenetic protein 6 |
| 27295 | PDLIM3 | PDZ and LIM domain 3 |
| 7431 | VIM | vimentin |
| 6927 | HNF1A | HNF1 homeobox A |
| 4113 | MAGEB2 | MAGE family member B2 |
| 6876 | TAGLN | transgelin |
| 4958 | OMD | osteomodulin |
| 4060 | LUM | lumican |
| 11128 | POLR3A | RNA polymerase III subunit A |
| 1440 | CSF3 | colony stimulating factor 3 |
| 23314 | SATB2 | SATB homeobox 2 |
The list of the 23 prioritized genes identified across the eight lists using the proposed Outranking approach.
3.4. Functional Enrichment Analysis
GO, pathway, and disease analysis was applied to investigate the biological implications of the integrated prioritized disease gene-candidate list. Using the GO Biological Process, KEGG and OMIN using Enrichr [61] a statistical over representation test was performed using the prioritized genes (
| Pathway | P Value | Adjusted P-value |
|---|---|---|
| Epstein-Barr virus infection | 0.002 | 0.085 |
| Hematopoietic cell lineage | 0.005 | 0.125 |
| Proteoglycans in cancer | 0.023 | 0.155 |
| Cytokine–cytokine receptor interaction | 0.037 | 0.155 |
| Maturity onset diabetes of the young | 0.029 | 0.155 |
| RNA polymerase | 0.036 | 0.155 |
| MicroRNAs in cancer | 0.045 | 0.155 |
| Prion diseases | 0.040 | 0.155 |
| Bladder cancer | 0.046 | 0.155 |
| Graft-versus-host disease | 0.046 | 0.155 |
| Type I diabetes mellitus | 0.048 | 0.155 |
| Proteasome | 0.049 | 0.155 |
KEGG, Kyoto Encyclopedia of Genes and Genomes.
Significant KEGG pathways.
| Term | P Value | Adjusted P-value |
|---|---|---|
| Keratan sulfate catabolic process | 0.0001 | 0.0318 |
| Glandular epithelial cell development | 0.0080 | 0.0861 |
| Keratan sulfate metabolic process | 0.0007 | 0.0422 |
| Type B pancreatic cell development | 0.0080 | 0.0861 |
| Regulation of aldosterone biosynthetic | 0.0080 | 0.0861 |
| Sulfur compound catabolic process | 0.0008 | 0.0422 |
| Regulation of cellular amide metabolic | 0.0023 | 0.0678 |
| Regulation of epithelial cell proliferation | 0.0032 | 0.0857 |
| Keratan sulfate biosynthetic | 0.0005 | 0.0422 |
| Regulation of interleukin-2 biosynthetic | 0.0103 | 0.0861 |
GO, Gene Ontology.
Significant GO biological processes.
Table 3 highlights significant KEGG pathways such as the Epstein-Barr virus infection. Studies including [62] and [63] provide some support that Epstein-Barr virus may play a role in the etiology of ovarian cancer. A recent study in [64] indicated that an association between the expression of Hematopoietic lineage cell-specific protein 1 and an increased risk of poor overall survival in patients with ovarian carcinoma.
From GO enrichment analysis highlighted in Table 4, it was observed that processes including regulation of epithelial cell proliferation, keratan sulfate processes and regulation of ERBB signaling pathway where enriched. ErbB2 a major target of a number of FDA-approved compounds for solid tumors [65]. GO enrichment analysis for nontop prioritized genes using our integrative approach mainly lay within GO metabolic and cellular processes. Furthermore, OMIN analysis showed the enrichment of the ranked genes in ovarian cancer.
These results highlight the potential of applying our generalized framework in integrating prioritized lists disease genes for the prediction of ovarian cancer biomarkers.
3.5. Comparison to Gene Prioritization Network Tools Using Predictive Analysis
We compare our integrative approach for prioritization to the gene prioritization tool ToppNet in the ToppGene suite [60] a state- of-the-art gene prioritization approach. ToppNet uses an extension of the PageRank and HITS algorithms, and the K-Step Markov method [14]. In order to perform this comparison we undertake predictive analysis to determine if coexpression values of prioritized genes can predict sample stage (i.e., early or late stage).
3.5.1. ToppGene training and test sets
ToppGene [60] ranks candidate genes based on their similarity to known OV genes. We constructed a training set which is a list of genes known to be involved in OV from the Cancer Genetics Web [66]. This resulted in a list of 307 known OV genes. The test sets were constructed using the same approach we applied as input to the outranking algorithm. A total of eight lists were derived from the top 150 genes from each of the four networks obtained from the application of PageRank and Bonacich Power Centrality. Using the training and test sets, gene prioritization was performed using ToppGene. For each prioritization task, the top 23 prioritized genes were selected for comparison to the proposed outranking approach.
3.5.2. Feature vector construction
Using the prioritized gene-candidate lists obtained from the novel ranking approach, ToppGene’s feature vectors were constructed for the classification task of predicting OV stage (early or late). The vectors were constructed using the ranked genes along with their gene expression values from the TCGA Transcriptome and clinical ovarian serous carcinoma data set (referred to as OV). The vectors consisted of 23 features each with 260 instances containing the coexpression values of the prioritized genes across each sample in the dataset. The OV data set has a total of 262 individual samples consisting of 18 early stage and 242 late stage samples. These samples were used as labels when measuring the classification performance.
3.5.3. Predictive analysis
We used the naive Bayesian classifier in the WEKA toolbox [67] for the predictive task of sample stage classification. To evaluate the performance, 10-fold cross-validation was carried out. To compare the performance of the prioritized gene-candidate lists on predicting sample stage, we selected the top ranked 23 genes from ToppGene prioritized using the test sets developed from the network topology analysis described above. Comparison of the outranking approach to ToppGene was performed to determine if adding additional information from “omic” networks improves classification obtained using transcription alone.
To evaluate the performance of the outranking approach we used Receiver Operating Characteristic (ROC) curves which compares our outranking approach with ToppGene detailed in Figure 2.
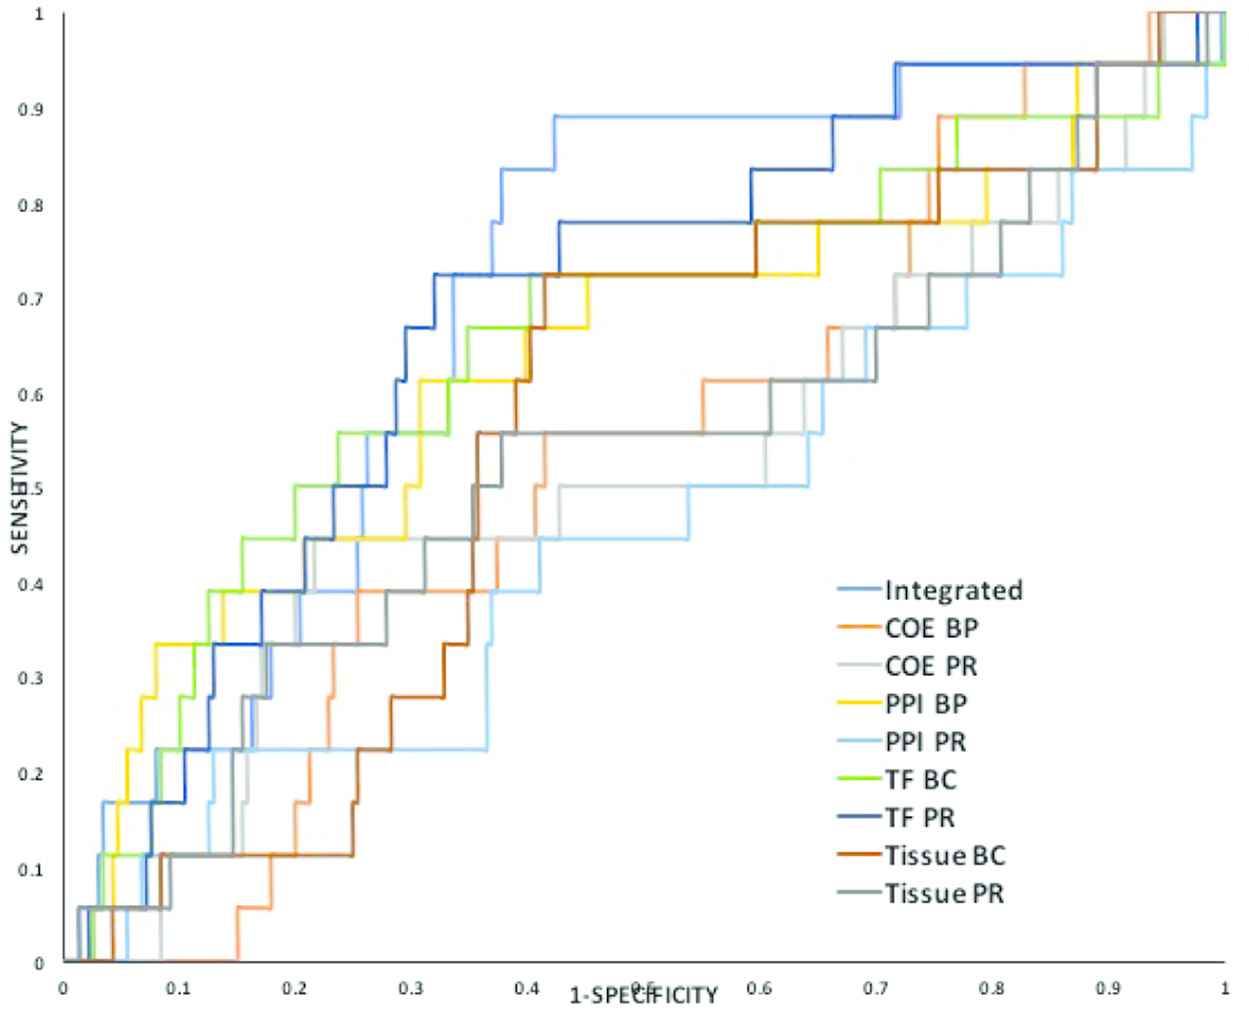
Plotting of Receiver Operating Characteristic (ROC) curves comparing our integrative ranking approach with ToppGene ranking across the individual networks and topology measures to predict ovarian (OV) cancer stage.
The outranking prioritization approach, which integrates prioritized gene lists from the four networks based on both PageRank and Bonacich Power Centrality topological measures, obtained the highest area under ROC curve (AUC) value presented in Figure 2 achieving an AUC of 0.704. To evaluate the statistical significance of these results we performed the paired T-Test (corrected) with a significance cut-off 0.05 in Weka comparing the outranking prioritization approach to the individual network prioritization approaches in Table 4. Statistical significance was observed between the outranking approach and the individual prioritization approaches. This analysis suggests that the integration of diverse data in the prioritization of disease genes are indeed useful for sample stage prediction. Interestingly, it is observed that lists from the TF individual network achieved good predictive results using ToppGene obtaining an AUC of 0.68 when the
The results highlight how our integrative outranking approach has identified 23 driver genes for classification compared to the 283 DEGs that were represented as features in the RNA-Seq Baseline data set. Furthermore, we can see that the reduced gene list has an improvement in AUC compared to ToppGene, which considers the networks individually. This is important in the context for the development of prognostic assays where the measurement of 23 genes compared to 283 genes is advantageous in terms of the expense and resources required to test and validate additional genes.
3.6. Literature Analysis
A list of genes involved in ovarian cancer was obtained from literature using the Cancer Genetics Web [66], which lists diseases and gene associations from published studies. A total of 306 OV genes were identified. From the outranking prioritized list 4 genes were identified as OV literature genes including: GSTA1, ERBB2, IL1A, MAGEB2 which have been implicated in the carcinogenesis and prognosis of ovarian cancer [69–73]. To determine the statistical significance of this result, we randomly selected 9 genes from the set of genes in the OV dataset 1000 times and compared these to the list of 306 literature obtained genes. Using equation below we calculated the
3.7. Biological Overview
The outranking list of genes was analyzed in terms of biological relevance. The downstream effects of disease processes such as mutation, methylation and copy number aberration are captured in transcriptional profiling. The activity of PLAGL1 (inhibiting proliferation and tumorigenicity) is altered through loss of heterozygosity or methylation and it has been found to be down-regulated in almost two-fifths of epithelial ovarian cancer (EOC) patients [74,75]. KRAS mutations, with downstream transcriptional loss, are more associated with low-grade or mucinous EOC, rather than high-grade serous OV, which is the subject of this study. Previous research has suggested that most of the genetic alterations associated with metastatic potential are already present in early-stage EOCs, though our study suggests an accumulation of further genetic changes [76,77].
4. CONCLUSION
Recent years have witnessed the systematic investigation of cancer through the application of high-throughput experimental technologies and the development of centralized databases. These experimental “omic” platforms target the comprehensive analysis of genes, mRNA, proteins and metabolites. These developments have been essential in (i) advancing the knowledge of biological systems; (2) understanding, predicting, diagnosing and monitoring diseases; (3) discovering biomarkers and (4) identifying drug targets. However, translation of relevant prognostic markers identified by such experiments into clinical tools for personalized patient treatment has been slow and unreliable [78].
Biological networks have proved to be effective in capturing the complexity of human disease and discerning how complexity controls disease manifestations, prognosis and therapy. In this study we have demonstrated how the integration of multiple “omic” biological networks can prioritize biologically relevant ovarian cancer progression genes. Prediction of a disease’s clinical stage is crucial for the development of appropriate therapeutics that may delay the progression of the disease. Yet the genetic basis of disease progression for many diseases are still unclear and in some cases unknown. In this study we applied our general framework that integrates “omic” data using a multinetwork approach framework and ranking to the Use Case HGSC progression. HGSC is a malignant form of ovarian cancer and accounts for up to 70% of all ovarian cancer cases [79]. Patients with HGSC are often diagnosed at the late stage of the disease. This is problematic as later stages generally result in a poor prognosis [80]. Chemotherapeutic agents have improved the five-year survival rate, however, the overall mortality of ovarian cancer has not changed in over 50 years [79]. This is mainly due to the lack of success in diagnosing ovarian cancer at an early stage and effective treatments for late stage of the disease [81].
In this research we have proposed an outranking data integration method which combined information from multinetworks using MCDA with aggregation mechanisms to prioritize lists of disease-candidate genes. The outranking approach is based on ELECTRE III and uses decision rules to identify positive and negative ranking criteria along with a multiobjective evolutionary algorithm to exploit the outranking relation and derive a prioritized list. The advantage of this approach is the ability to combine information from multiple heterogeneous data sources to produce ranked lists of potential disease-candidate genes. The approach however is generic in nature and can be applied to other problem domains such as the prioritization of alternative transcripts and protein isoforms, metabolites and drugs.
Using our proposed outranking approach, known ovarian cancer genes GSTA1, ERBB2, IL1A, MAGEB2 were uncovered. KEGG pathways including ErbB signalling and pathways in cancer along with GO terms metalloendopeptidase and ErbB2 were significantly enriched. Furthermore, relatively high predictive performance (AUC: 0.704) was observed when classifying ovarian cancer early and late stage RNA-Seq expression profiles from individuals using 10-fold cross-validation.
In this work we have applied a case study to demonstrate the proof of concept where we know (some of) the underpinning biology. In future work we will apply our approach for discovery in diseases such as chemotherapy-resistant and sensitive HGSC. Furthermore, we will extend our current approach on the integration of multiple “omic” network data using multilayer network theory. We aim to model importance and reliability of layers in a biological multilayer network for predictive task disease progression and apply to other diseases such as lung carcinoma.
CONFLICTS OF INTEREST
The authors declare they have no conflicts of interest.
AUTHORS’ CONTRIBUTIONS
Jesús Jaime Solano Noriega: Conceptualization, Methodology, Validation, Investigation, Data curation, Writing original draft, Writing review and editing; Juan Carlos Leyva López: Conceptualization, Methodology, Validation, Formal analysis, Investigation, Data curation, Writing original draft, Writing review; Fiona Browne: Conceptualization, Methodology, Validation, Formal analysis, Investigation, Data curation, Writing original draft, Writing review; Jun Liu: Validation, Formal analysis, Investigation, Writing review.
Funding Statement
This research did not receive any specific grant from funding agencies in the public, commercial, or not-for-profit sectors.
REFERENCES
Cite this article
TY  - JOUR
AU  - Jesús Jaime Solano Noriega
AU  - Juan Carlos Leyva López
AU  - Fiona Browne
AU  - Jun Liu
PY  - 2021
DA  - 2021/06/12
TI  - An Outranking Approach for Gene Prioritization Using Multinetworks
JO  - International Journal of Computational Intelligence Systems
SP  - 1728
EP  - 1741
VL  - 14
IS  - 1
SN  - 1875-6883
UR  - https://doi.org/10.2991/ijcis.d.210608.003
DO  - 10.2991/ijcis.d.210608.003
ID  - Noriega2021
ER  -