
Multi-Tier Student Performance Evaluation Model (MTSPEM) with Integrated Classification Techniques for Educational Decision Making
 , S. Appavu alias Balamurugan2, *, , S. Sasikala3,
 - DOI
- 10.2991/ijcis.d.210609.001How to use a DOI?
- Keywords
- Student performance analysis; Primary classification; Naive Bayes Classification; Ensemble classifiers; Boosting; Stacking and Random Forest (RF); Classification accuracy
- Abstract
In present decade, many Educational Institutions use classification techniques and Data mining concepts for evaluating student records. Student Evaluation and classification is very much important for improving the result percentage. Hence, Educational Data Mining based models for analyzing the academic performances have become an interesting research domain in current scenario. With that note, this paper develops a model called Multi-Tier Student Performance Evaluation Model (MTSPEM) using single and ensemble classifiers. The student data from higher educational institutions are obtained and evaluated in this model based on significant factors that impacts greater manner in student's performances and results. Further, data preprocessing is carried out for removing the duplicate and redundant data, thereby, enhancing the results accuracy. The multi-tier model contains two phases of classifications, namely, primary classification and secondary classification. The First-Tier classification phase uses Naive Bayes Classification, whereas the second-tier classification comprises the Ensemble classifiers such as Boosting, Stacking and Random Forest (RF). The performance analysis of the proposed work is established for calculating the classification accuracy and comparative evaluations are also performed for evidencing the efficiency of the proposed model.
- Copyright
- © 2021 The Authors. Published by Atlantis Press B.V.
- Open Access
- This is an open access article distributed under the CC BY-NC 4.0 license (http://creativecommons.org/licenses/by-nc/4.0/).
1. INTRODUCTION
Data Mining can be defined as the process of evaluating data from large databases for extracting relevant new data or information based on the application processing. The definition can be stated as the effective separation of classes with respect to the derived data patterns from the available or concerned database datasets. Moreover, it involves in the process of decision making by deriving Knowledge Discovery. The process of data mining can also be termed as knowledge discovery that performs nontrivial extraction of data that are required for the application from given databases [1]. The operations that are involved data mining for knowledge discovery are presented in Figure 1.
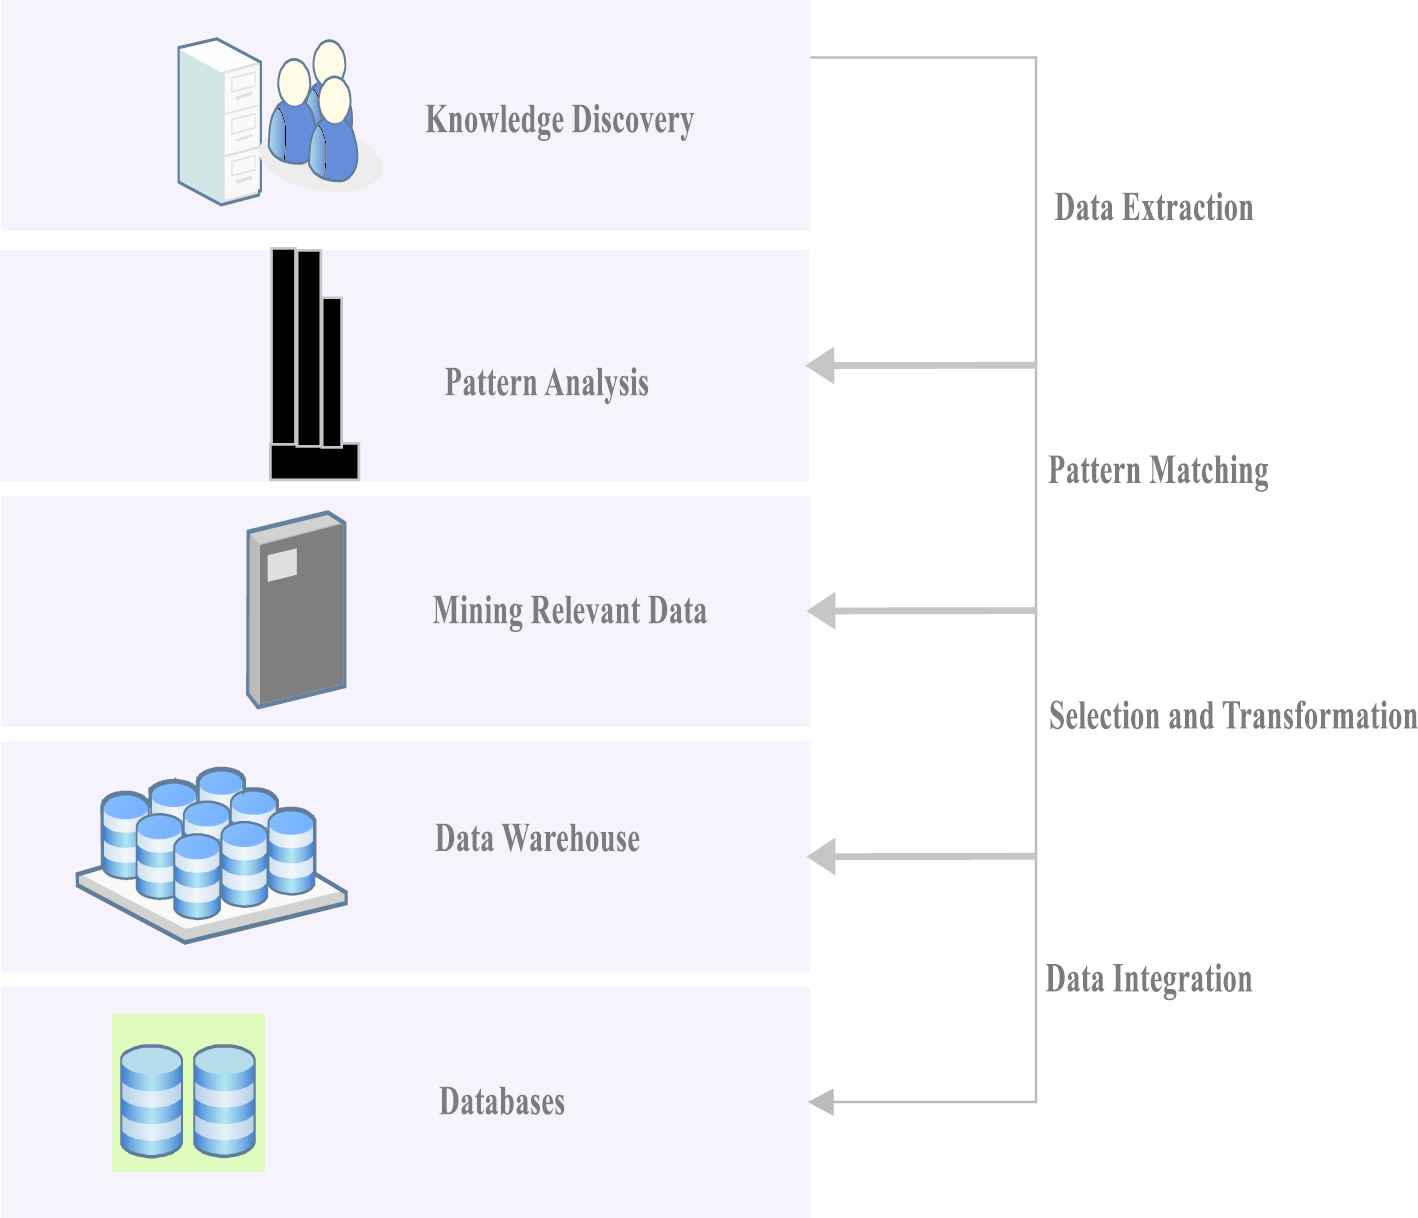
Operations in data mining for knowledge discovery.
In the present scenario, the data mining concepts and methodologies are effectively utilized in measuring student performance in several educational units, which is given as Educational Data Mining (EDM), has become a great research domain. In EDM, the data retrieval or the process of knowledge discovery is performed with the available student data base from the institutions [2]. The main purpose of EDM is to provide analysis results of student performance that helps in providing quality education to the students and to improve the student results and reputation of the institution. Moreover, the huge student data that is collected from previous records of students and provided in the data warehouses as data model of educational databases. The acquired student data is presented in different formats that comprised of information about student personal and academic logs. The functions of EDM in the process of student performance evaluations are diagrammatically portrayed in the Figure 2.

Functions of student performance analysis in Educational Data Mining (EDM).
By developing a model for student categorization, the institution can produce better student results with improved quality. For performing that, the student attributes are evaluated based on the extracted knowledge patterns and provided to the academicians and the institution to provide efficient decision making and modify the teaching methodologies accordingly [3]. Furthermore, advanced management technique and academic data maintenance of students needs an intelligent EDM model based on the problem statement listed below.
Describing and considering the distinctive factors of academic and personal student data.
Developing efficient EDM model for student data classification.
In general, the higher grade student's performances are measured from the attributes such as their personal information, test marks, behaviors, family status and so on [4–6]. In this paper, a new model called Multi-Tier Student Performance Evaluation Model (MTSPEM) is developed for measuring student performance and provides classification results for better understanding of academicians. For that, the model utilized basic classification and ensemble methods. For increasing the classification accuracy and model performance, the proposed work used appropriate and significant student attributes that affect their results to the maximum. The contributions of the proposed MTSPEM are presented below.
Collecting Data for Significant Student Learning Factors (SSLF) that includes the important student information such as academic results, personal domains, behavior, learning abilities.
Combining Traditional with ensemble classification methods for improving results in student classification.
Preprocessing input student data for removing unwanted data.
Performing first-tier classification using Naive Bayes (NB) model and second-tier classification with Boosting, Stacking and Random Forest (RF).
Multi-Tier Classification is carried out for classifying students under OUTSTANDING, GOOD, AVERAGE and LOW.
Performance Evaluations are carried out for measuring the proposed model accuracy and efficiency.
The remaining work is organized as follows: Section 2 deliberates the existing models in evaluating student performance in EDM. Section 3 explains the working procedure and implementation of the proposed multi-tier classification model. The results and performance evaluation of the affirmed work is presented with graph evidences in Section 4. Finally, the paper conclusion is provided in Section 5 with some pointers for future work.
2. RELATED WORKS
There are several methodologies have been developed so far in EDM to determine the student performances. In [6], an informative survey work has been carried out for analyzing the student's academic activities, advanced techniques in knowledge discovery and models for results improvement. A Neuro-fuzzy logic oriented student behavior evaluation model was proposed in [7], which used the student data that were obtained during 1995 to 2005 records. The model was developed to analyze the student record at higher education to improve the final results. In a different manner, the work in [8], presented a model for measuring the performance of tutor corresponding to the questionnaire set. Support Vector Machine (SVM), Artificial Neural Networks (ANN) and Decision Tree (DT) algorithms were used for the classification.
A case study with web data based EDM has been presented in [9]. The obtained classification results were used to evaluate the student class to train them accordingly for result improvement. The model presented in paper [10] provided technique for detecting the parameters that manipulating the students results usingDT model. Furthermore, the paper work in [11] presented a comparative analysis on several classification techniques such as J48 Classifier, Multilayer Perceptron (MLP), Sequential Minimal Optimization (SMO) and so on. The work presented in [12] also provided a survey work on evaluating the parameters that impacts student academics and performances.
Naive Bayesian Classification has been used in [13] for analyzing the student results in different universities under graduation. The model compared the results with DTmodel and concluded that DT methods provided better results because of various operations. A different comparison work has been carried out in [14] and the comparison was processed with the traditional educational and online educational patterns. The learning strategies of the students were not considered in the work for classification. Further, in [15], ID3 based student categorization has been processed and results were used for improving the student performance and results.
The problems on handling with missing student data have been discussed in [16]. The paper also concentrated about the data discrepancy, data misunderstanding, data malfunctions and so on. And, the classification has been further classified using ID3 and C4.5 based data clustering models. A valuable literature survey was done in [17] that comprised of the procedure of traditional classification techniques used in educational systems and web educational data. Genetic Algorithm based student classification model has been developed in [18]. It was stated in the work that utilizing combined classifiers could improve the classification results. Comment Data Mining (CDM) [19] technique was used in performance prediction of students in accordance with the student's learning patterns. Moreover, the results have been further enhanced by enforcing probabilistic latent based semantic analysis and latent Dirichlet Allocation.
A classroom based student behavior measures and classification techniques were presented in the review work given in [20]. The review work mainly considered on Fuzzy based Data Mining Techniques, Association Rule Mining, DT and so on. In the work [21], performances of both the students and instructors were evaluated using Probabilistic Graphical Model. The model considered personal attributes with academic results for generating results with better accuracy. Further, the work presented in [4] involves in measuring the characteristics and classification of students in Engineering Colleges for result improvement. ANN has been used in [22] for student performance and behavior analysis and explained with a case study. Hybrid method by combining DT and Clustering techniques were used in [23] for categorizing the input student samples. The authors of [24] developed a Global Model for Classification (GMC) using Supervised Learning methods for increasing result precision. In [25], Bound Model for Clustering and Classification (BMCC) was framed by combining k-means clustering and J48 clustering and DT classification models for classifying students at higher education levels. A review work about the classification methods is also more effective in EDM for accurate student behavior determination with class labels [26,27]. The supervised learning models and their efficiencies are evaluated in those works for student performance computations.
[28] discussed the application of data mining techniques on educational data of a higher education institution in Croatia using cluster analysis and DT technique. [29] used Association rule mining for Student Job Prediction. In [30], Context-aware Nonlinear and Neural Attentive Knowledge-based Models for Grade Prediction was proposed. [31] studied the application of machine learning and data mining in predicting the performance of intermediate and secondary education level student. Various EDM Tools and Framework for Predicting Students Academic Performance was discussed in [32].
3. PROCEDURE OF MTSPEM
In this section, the complete work procedure of the proposed MTSPEM for student classification is discussed. Moreover, the classification operations are carried out in primary and secondary levels for enhancing result precision, thereby providing alternative teaching methods to students to increase the overall results percentage and also education quality. The model utilized traditional classifications and meta classifiers for student categorizations under four classes, such as, OUTSTANDING, GOOD, AVERAGE and LOW. For that, the benchmark student dataset is obtained from University of California Irvine (UCI) Machine Learning Repository, and the detailed description about the data set is presented in Section 3.1. Furthermore, the model comprises of the following phases for appropriate result prediction.
Student Data Acquisition
Data Preprocessing
Important Feature Selection based on SSLF
First-Tier Base Classification
Second-Tier Meta Classification
Performance and Result Analysis
The operations that are carried out in each phase of work are clearly portrayed in the Figure 3. As presented in the figure, the dataset that are obtained from benchmark datasets are used for training, further, preprocessing is carried out for redundant and insignificant data removal. Furthermore, the operations are described in detail in the following sections.
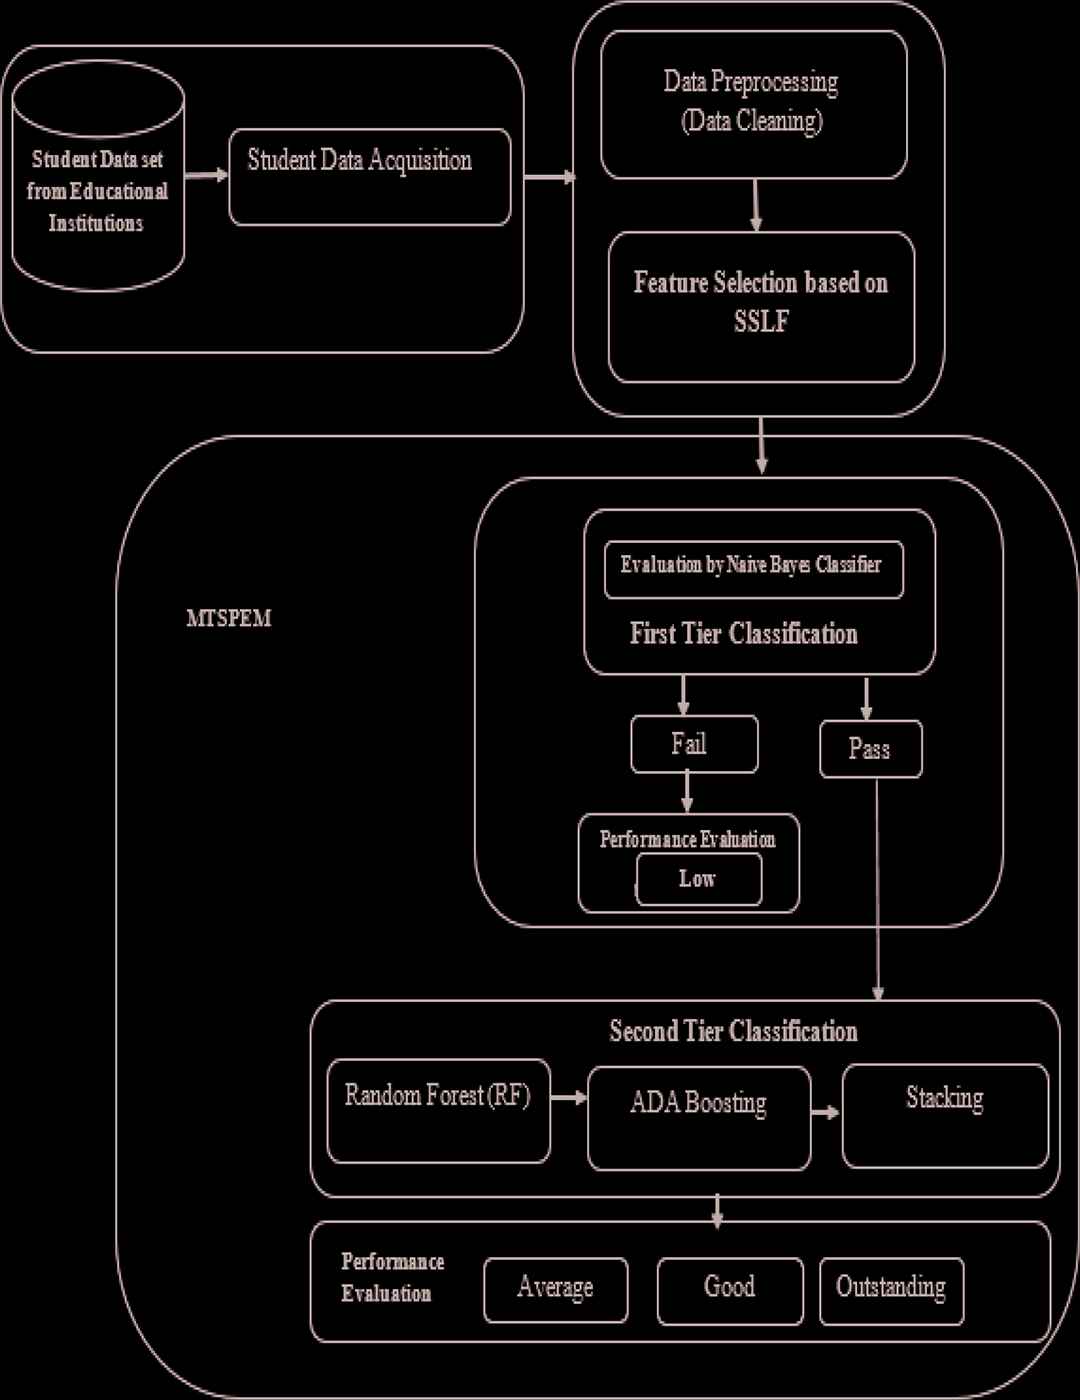
Functions of Multi-Tier Student Performance Evaluation Model (MTSPEM).
3.1. Student Data Acquisition
In this section of Student Data Acquisition, the model acquires data from benchmark student data set (Dataset Description is presented in Section 3.1.1), those data is used for training process and on the other hand, the test samples are obtained from data sources of some other data sources are considered for testing through the developed MTSPEM model. In many cases, the data obtained from web sources are in un-structured data formats that are complicated to process. For that, the proposed model uses preprocessing and feature selection based on the SSLF.
3.1.1. Dataset description
This model uses the student data samples from a benchmark dataset called High School Student Performance Dataset from UCI Machine Learning Repository [33]. The dataset comprises of 649 instances with the multivariate dataset characteristics and integer feature characteristics. The total number of student features that are presented in the dataset is 33. Moreover, it is given that the student's samples of the dataset are obtained from high school education of two Portuguese Schools. The data features include social, environmental, student rank based information, which are acquired from school logs and survey reports. Hence, the dataset is effectively used in the affirmed work to train MTSPEM for providing accurate classification reports in processing with test samples. The sample features obtained from the student dataset are given in Table 1.
| Student_Features | Type | Feature_Depiction | Possible_Values |
|---|---|---|---|
| GRP | Nominal | Students under Specific Group in Higher Education | {Science, Accounts} |
| GEN | Nominal | Gender Specification of Students | {M, F} |
| Age | Numeric | Student's Age | 15–22 |
| ADD | Multivariate | Home location of student for convenience | Different for each |
| F-STA | Numeric | Financial Status for Scholarships | Different for Each |
| EXT-ACT | Nominal | Athlete / Sports Activities | {Yes, No} |
| IA | Numeric | Based on Class test results | Marks (0–100) |
| AG | Numeric | Marks based Results | Ranges from 0 to 10 |
| ATT | Numeric | Attendance Percentage of Students | 70% to 100% |
| FL | Numeric | Number of failures in past examinations | {y, if 1≤y≤3, else 4} |
| H-Status | Nominal | Health issues of students | {Good, Bad} |
| I-USE | Nominal | Internet Availability at Home | {Yes, No} |
| Free-time | Nominal | Free time of students after school | {low, normal, high} |
Sample features from student dataset.
3.2. Data Preprocessing
Data Preprocessing operations involve in eliminating duplicate, redundant and irrelevant data from the obtained student samples from Educational Institutions. For example, the features such as Educational background of Father and Mother, financial status of family, hang-out frequency with friends are not considered as significant in evaluating the academic performances of students. Hence, those features can be eliminated from the obtained data and given for further classification, which may reduce the time and computational complexities. Furthermore, there are some missing values are also presented in the obtained dataset that are to be removed for increasing the model performance and classification accuracy. For processing that, Chi Square Rate (S) between the student features is evaluated based on the classification requirements which is given in Equation (1).
Where, “m” denotes the total student samples considered, “
3.3. Important Feature Selection Based on SSLF
The proposed model implementation and evaluations are processed in WEKA environment, which uses the feature selection to select the SSLF for providing accurate results in student classification. Correlation based feature evaluation is used to compute the correlation between each student_feature with the output variable factors. The features that are having positive or negative correlation rates are considered to be highly significant for classification and, the features that are having low correlations are left for processing training. In WEKA, the correlation based feature selection is processed with the Correlation Attribute Evaluation methods, corresponding to rank filter.
By applying feature selection, the features such as last exam marks, Number of failures in past examinations (FL), Class test results (IA), Attendance Percentage of Students (ATT) and Internet Availability at Home (I-USE) are considered to be the SSLF for student academic performance evaluations and those are further given for processing with classifiers.
3.4. First-Tier Base Classification
In first-tier, base classification is performed with traditional classification technique called Naive Baye's Model. This classification is a category of Supervised Learning that provides classification results based on the arithmetic knowledge patterns obtained from feature selection process. Moreover, the mode identifies the student class based on their performances and results obtained by them in past examinations. The accurate results of first-tier classification are obtained from the selected student_features. Moreover, the classification model requires minimal data to provide results with minimal time and computational complexities.
The steps for NB classification in MTSPEM are presented below.
The SSLF based student_features are used for training.
The probability of student_classes with respect to the SSLF vectors are given as,
Where, “
The product values are determined based on the probability values.
Here, the NB classification is utilized for performing major classification like gender classification of students, and PASS/FAIL classification based on threshold rates that are predefined based on courses.
After performing the major classification, the students, who are classified uer FAIL class is considered as LOW, accordingly, teaching techniques are to be modified for them to produce better results in future examinations. And, the list of students under PASS css is processed with second-tier classification with ensemble classifiers as explained in the next section.
3.5. Second-Tier Meta Classification
In the proposed work, the meta classifiers such as AdaBoosting, Stacking and RF operations are incorporated with base classifier for further classifying the student data from aforementioned four classes with more precision and accuracy. Moreover, the advantages in performing multi-tier classification in the proposed model are provided below,
Providing better classification results than using base or single classifier.
Achieving good generalization with ensemble based classification techniques
3.5.1. RF implementation in MTSPEM
In this classifier, the randomly selected student_features are combined for processing. The classifier utilizes DT for random attribute selection. After selecting random student_features, the split ends are processed with stacking operations. Moreover, the process of Random Tree is used to minimize the tree correlations and providing précised results. The operations in RF are listed as follows.
Random Student_features are selected from student dataset.
DT framing for each tuple is done and results for each tree is obtained.
Ranking for each result is determined.
The result that is on lead place is considered as final.
3.5.2. Implementation of stacking in MTSPEM
Using stacking, single student dataset is provided to multiple classifiers to train. The dataset samples are provided to the classifiers in the derived model and the results are obtained through that. When processing with large number of student samples in EDM, the appropriate results can be obtained with several classification outlets. The steps for processing with Stacking, following the NB based classification are provided below.
The student dataset for training is partitioned into two-folds.
In first section, first-tier classification is used to fix to the inputs.
In second section, ensemble classification is processed for further classifications.
Placing second-tier classification based on the previous results as inputs.
3.5.3. AdaBoosting in second-tier of MTSPEM
The function of AdaBoosting is to perform acquiring combined execution of distinctive classifiers to enhance result accuracy. By enforcing, AdaBoosting, the final results are obtained for classification of students based on Academic Results and student learning patterns. The steps are as follows,
A loop based sample dataset distribution is performed.
All the student_samples are given with equal rates.
The correctly classified instances are given with lower rates and the incorrectly classified samples are provided with higher rates.
At the end of processing with AdaBoosting, the final classification of student samples under OUTSTANDING, GOOD, AVERAGE are done and evaluations are performed for evidencing the result accuracy and model effectiveness.
3.6. Performance and Result Analysis
The performance of the proposed model is measured based on the parameters such as Precision, Recall, Specificity, F1-Measure, Accuracy and Mean Absolute Error (MAE). The aforementioned rates are computed from the True Positive (I), True Negative (J), False Positive (K) and False Negative (L) results in classifying student samples. And, the computations of the parameters are explained below.
Sensitivity Rate (True Positive Rate):
Sensitivity can be measured as the probability of occurrence of classification as positive, accurately and the derivation is given in Equation (3) and it can also be stated as recall,
Specificity Rate (True Negative Rate):
Specificity rate can be evaluated as the results are correctly classified under negative. And, the formula is given in Equation (4),
Precision:
Precision is described as acquiring positive identifications that can be computed as the ratio of “I” predictions from the available positive classes. The formula is given as,
Accuracy Rate:
The efficiency of proposed MTSPEM is evaluated based on its accuracy rate in classifying student samples. It can be given as the ratio of total number of accurately classified student samples to the number of student samples obtained from the dataset.
F1-Score:
The harmonic mean value of sensitivity and specificity is given as F1-Score, which is computed as,
where Recall is the measure of the correctly identified positive cases from all the actual positive cases, which is given in Equation (8).MAE:
This is derived to measure the differences in actual and predicted results and the formula is given as,
Where, “n” is the error numbers, “
4. IMPLEMENTATIONS AND COMPARISONS
The proposed model is implemented and evaluated using WEKA tool, in which the student's dataset are used in Attribute Relation File Format (ARFF). Initially, the data in the obtained benchmark dataset [33] (described in Section 3.1.1) are in Comma Separated Value (CSV) format. The results are evaluated based on the parameters presented in the previous section. Further, the results are compared with existing student classification techniques such as, K Nearest Neighbor (K-NN), ANN, SVM, DT, NB and various Ensemble classifiers namely KNN-ANN, DT-KNN, ANN-DT, DT-SVM, NB-SVM and DT-NB. The acquired samples are processed with the preprocessing and feature selection techniques for obtaining SSLF that are given for Classification training. The Table 2 contains the values of Precision, Recall, Specificity, F1-Score, Accuracy and Error rate for processed student samples that ranges from 100 to 500.
| Models | Student Samples | Parameters |
||||||
|---|---|---|---|---|---|---|---|---|
| Precision | Recall/Sensitivity | Specificity | F1-Score | Accuracy | Error Rate | Time Taken (in Sec) | ||
| K-NN | 100 | 0.6957 | 0.6400 | 0.7200 | 0.6667 | 0.6800 | 0.3200 | 48 |
| 200 | 0.6923 | 0.6300 | 0.7200 | 0.6597 | 0.6750 | 0.3250 | 68 | |
| 300 | 0.7029 | 0.6467 | 0.7267 | 0.6736 | 0.6867 | 0.3133 | 94 | |
| 400 | 0.6978 | 0.6350 | 0.7250 | 0.6649 | 0.6800 | 0.3200 | 108 | |
| 500 | 0.7013 | 0.6480 | 0.7240 | 0.6736 | 0.6860 | 0.3140 | 117 | |
| Average | 0.6980 | 0.6399 | 0.7231 | 0.6677 | 0.6815 | 0.3185 | 87 | |
| ANN | 100 | 0.7391 | 0.6800 | 0.7600 | 0.7083 | 0.7200 | 0.2800 | 78 |
| 200 | 0.7143 | 0.6500 | 0.7400 | 0.6806 | 0.6950 | 0.3050 | 95 | |
| 300 | 0.7101 | 0.6533 | 0.7333 | 0.6806 | 0.6933 | 0.3067 | 109 | |
| 400 | 0.7033 | 0.6400 | 0.7300 | 0.6702 | 0.6850 | 0.3150 | 135 | |
| 500 | 0.7056 | 0.6520 | 0.7280 | 0.6778 | 0.6900 | 0.3100 | 144 | |
| Average | 0.7145 | 0.6551 | 0.7383 | 0.6835 | 0.6967 | 0.3033 | 112 | |
| SVM | 100 | 0.7609 | 0.7000 | 0.7800 | 0.7292 | 0.7400 | 0.2600 | 18 |
| 200 | 0.7363 | 0.6700 | 0.7600 | 0.7016 | 0.7150 | 0.2850 | 39 | |
| 300 | 0.7246 | 0.6667 | 0.7467 | 0.6944 | 0.7067 | 0.2933 | 56 | |
| 400 | 0.7104 | 0.6500 | 0.7350 | 0.6789 | 0.6925 | 0.3075 | 74 | |
| 500 | 0.7155 | 0.6640 | 0.7360 | 0.6888 | 0.7000 | 0.3000 | 98 | |
| Average | 0.7295 | 0.6701 | 0.7515 | 0.6986 | 0.7108 | 0.2892 | 57 | |
| DT | 100 | 0.7826 | 0.7200 | 0.8000 | 0.7500 | 0.7600 | 0.2400 | 21 |
| 200 | 0.7582 | 0.6900 | 0.7800 | 0.7225 | 0.7350 | 0.2650 | 26 | |
| 300 | 0.7391 | 0.6800 | 0.7600 | 0.7083 | 0.7200 | 0.2800 | 32 | |
| 400 | 0.7158 | 0.6550 | 0.7400 | 0.6841 | 0.6975 | 0.3025 | 36 | |
| 500 | 0.7253 | 0.6760 | 0.7440 | 0.6998 | 0.7100 | 0.2900 | 45 | |
| Average | 0.7442 | 0.6842 | 0.7648 | 0.7129 | 0.7245 | 0.2755 | 32 | |
| NB | 100 | 0.8043 | 0.7400 | 0.8200 | 0.7708 | 0.7800 | 0.2200 | 6 |
| 200 | 0.7802 | 0.7100 | 0.8000 | 0.7435 | 0.7550 | 0.2450 | 9 | |
| 300 | 0.7536 | 0.6933 | 0.7733 | 0.7222 | 0.7333 | 0.2667 | 13 | |
| 400 | 0.7243 | 0.6700 | 0.7450 | 0.6961 | 0.7075 | 0.2925 | 16 | |
| 500 | 0.7350 | 0.6880 | 0.7520 | 0.7107 | 0.7200 | 0.2800 | 21 | |
| Average | 0.7595 | 0.7003 | 0.7781 | 0.7287 | 0.7392 | 0.2608 | 13 | |
| KNN-ANN | 100 | 0.8261 | 0.7600 | 0.8400 | 0.7917 | 0.8000 | 0.2000 | 158 |
| 200 | 0.8132 | 0.7400 | 0.8300 | 0.7749 | 0.7850 | 0.2150 | 180 | |
| 300 | 0.7971 | 0.7333 | 0.8133 | 0.7639 | 0.7733 | 0.2267 | 198 | |
| 400 | 0.7380 | 0.6900 | 0.7550 | 0.7132 | 0.7225 | 0.2775 | 218 | |
| 500 | 0.7500 | 0.7080 | 0.7640 | 0.7284 | 0.7360 | 0.2640 | 242 | |
| Average | 0.7849 | 0.7263 | 0.8005 | 0.7544 | 0.7634 | 0.2366 | 1199 | |
| DT-KNN | 100 | 0.8478 | 0.7800 | 0.8600 | 0.8125 | 0.8200 | 0.1800 | 83 |
| 200 | 0.8462 | 0.7700 | 0.8600 | 0.8063 | 0.8150 | 0.1850 | 102 | |
| 300 | 0.8188 | 0.7533 | 0.8333 | 0.7847 | 0.7933 | 0.2067 | 115 | |
| 400 | 0.7500 | 0.7050 | 0.7650 | 0.7268 | 0.7350 | 0.2650 | 140 | |
| 500 | 0.7637 | 0.7240 | 0.7760 | 0.7433 | 0.7500 | 0.2500 | 156 | |
| Average | 0.8053 | 0.7465 | 0.8189 | 0.7747 | 0.7827 | 0.2173 | 119 | |
| ANN-DT | 100 | 0.8696 | 0.8000 | 0.8800 | 0.8333 | 0.8400 | 0.1600 | 105 |
| 200 | 0.8247 | 0.8000 | 0.8300 | 0.8122 | 0.8150 | 0.1850 | 124 | |
| 300 | 0.8394 | 0.7667 | 0.8533 | 0.8014 | 0.8100 | 0.1900 | 140 | |
| 400 | 0.7672 | 0.7250 | 0.7800 | 0.7455 | 0.7525 | 0.2475 | 166 | |
| 500 | 0.7773 | 0.7400 | 0.7880 | 0.7582 | 0.7640 | 0.2360 | 186 | |
| Average | 0.8156 | 0.7663 | 0.8263 | 0.7901 | 0.7963 | 0.2037 | 144 | |
| DT-SVM | 100 | 0.8913 | 0.8200 | 0.9000 | 0.8542 | 0.8600 | 0.1400 | 44 |
| 200 | 0.8557 | 0.8300 | 0.8600 | 0.8426 | 0.8450 | 0.1550 | 71 | |
| 300 | 0.8613 | 0.7867 | 0.8733 | 0.8223 | 0.8300 | 0.1700 | 86 | |
| 400 | 0.7831 | 0.7400 | 0.7950 | 0.7609 | 0.7675 | 0.2325 | 108 | |
| 500 | 0.7917 | 0.7600 | 0.8000 | 0.7755 | 0.7800 | 0.2200 | 136 | |
| Average | 0.8366 | 0.7873 | 0.8457 | 0.8111 | 0.8165 | 0.1835 | 89 | |
| NB-SVM | 100 | 0.9130 | 0.8400 | 0.9200 | 0.8750 | 0.8800 | 0.1200 | 30 |
| 200 | 0.8866 | 0.8600 | 0.8900 | 0.8731 | 0.8750 | 0.1250 | 49 | |
| 300 | 0.8913 | 0.8200 | 0.9000 | 0.8542 | 0.8600 | 0.1400 | 68 | |
| 400 | 0.8010 | 0.7650 | 0.8100 | 0.7826 | 0.7875 | 0.2125 | 91 | |
| 500 | 0.8099 | 0.7840 | 0.8160 | 0.7967 | 0.8000 | 0.2000 | 112 | |
| Average | 0.8604 | 0.8138 | 0.8672 | 0.8363 | 0.8405 | 0.1595 | 70 | |
| DT-NB | 100 | 0.9348 | 0.8600 | 0.9400 | 0.8958 | 0.9000 | 0.1000 | 24 |
| 200 | 0.9175 | 0.8900 | 0.9200 | 0.9036 | 0.9050 | 0.0950 | 35 | |
| 300 | 0.9091 | 0.8667 | 0.9133 | 0.8874 | 0.8900 | 0.1100 | 46 | |
| 400 | 0.8325 | 0.8200 | 0.8350 | 0.8262 | 0.8275 | 0.1725 | 56 | |
| 500 | 0.8354 | 0.8120 | 0.8400 | 0.8235 | 0.8260 | 0.1740 | 65 | |
| Average | 0.8859 | 0.8497 | 0.8897 | 0.8673 | 0.8697 | 0.1303 | 45 | |
| MTSPEM | 100 | 0.9592 | 0.9400 | 0.9600 | 0.9495 | 0.9500 | 0.0500 | 14 |
| 200 | 0.9485 | 0.9200 | 0.9500 | 0.9340 | 0.9350 | 0.0650 | 19 | |
| 300 | 0.9379 | 0.9067 | 0.9400 | 0.9220 | 0.9233 | 0.0767 | 28 | |
| 400 | 0.8693 | 0.8650 | 0.8700 | 0.8672 | 0.8675 | 0.1325 | 36 | |
| 500 | 0.8664 | 0.8560 | 0.8680 | 0.8612 | 0.8620 | 0.1380 | 48 | |
| Average | 0.9163 | 0.8975 | 0.9176 | 0.9068 | 0.9076 | 0.0924 | 81 | |
ANN, Artificial Neural Networks; DT, Decision Tree; K-NN, K Nearest Neighbor; MTSPEM, Multi-Tier Student Performance Evaluation Model; NB, Naive Bayes; SVM, Support Vector Machine.
Note: Average Performance of Each classification model was indicated in Bold numbers.
Evaluation results obtained for student data using various classification techniques.
With respect to the results presented above, the comparative analysis for Accuracy, Precision, Recall, F1-Score, Error rate and time complexities are performed between the proposed and the compared models. The Figure 4 portrays the results obtained for classification Accuracy, Precision, Recall, Specificity, F1-score and Error rate in categorizing students under four classes based on the SSLF, includes academic results, attendance, Internet Utilization for studies and so on. The effective integration of classification methods produces appropriate results. It is observed from Table 3 and Figure 4 that the proposed model produces accuracy of 90.76% in average, which is greater than other compared work. And, the results for detection performance is presented in Figure 5. It can be derived as the ratio of true positive rates from the available positive notations of samples. It is auspicious from the Figures 4 and 5 that MTSPEM achieves higher accuracy and precision than others.
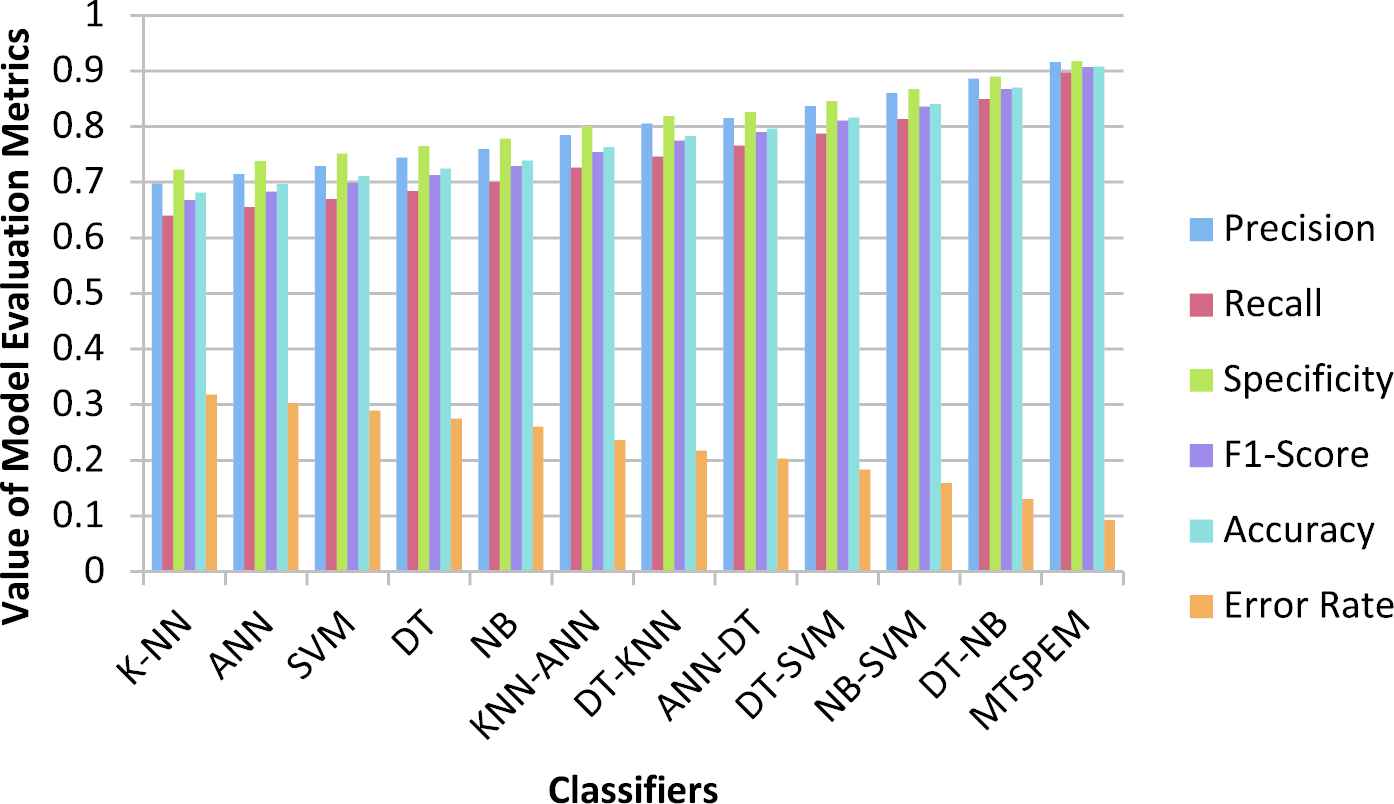
Performance of classifiers.
| Models | Precision | Recall/Sensitivity | Specificity | F1-Score | Accuracy | Error Rate | Time Taken (in Sec) |
|---|---|---|---|---|---|---|---|
| K-NN | 0.6980 | 0.6399 | 0.7231 | 0.6677 | 0.6815 | 0.3185 | 87 |
| ANN | 0.7145 | 0.6551 | 0.7383 | 0.6835 | 0.6967 | 0.3033 | 112 |
| SVM | 0.7295 | 0.6701 | 0.7515 | 0.6986 | 0.7108 | 0.2892 | 57 |
| DT | 0.7442 | 0.6842 | 0.7648 | 0.7129 | 0.7245 | 0.2755 | 32 |
| NB | 0.7595 | 0.7003 | 0.7781 | 0.7287 | 0.7392 | 0.2608 | 13 |
| KNN-ANN | 0.7849 | 0.7263 | 0.8005 | 0.7544 | 0.7634 | 0.2366 | 1199 |
| DT-KNN | 0.8053 | 0.7465 | 0.8189 | 0.7747 | 0.7827 | 0.2173 | 119 |
| ANN-DT | 0.8156 | 0.7663 | 0.8263 | 0.7901 | 0.7963 | 0.2037 | 144 |
| DT-SVM | 0.8366 | 0.7873 | 0.8457 | 0.8111 | 0.8165 | 0.1835 | 89 |
| NB-SVM | 0.8604 | 0.8138 | 0.8672 | 0.8363 | 0.8405 | 0.1595 | 70 |
| DT-NB | 0.8859 | 0.8497 | 0.8897 | 0.8673 | 0.8697 | 0.1303 | 45 |
| MTSPEM | 0.9163 | 0.8975 | 0.9176 | 0.9068 | 0.9076 | 0.0924 | 81 |
ANN, Artificial Neural Networks; DT, Decision Tree; K-NN, K Nearest Neighbor; MTSPEM, Multi-Tier Student Performance Evaluation Model; NB, Naive Bayes; SVM, Support Vector Machine.
Note: Average Performance and time taken by the proposed MTSPEM method was indicated in Bold numbers.
Average performance and time taken by various model.
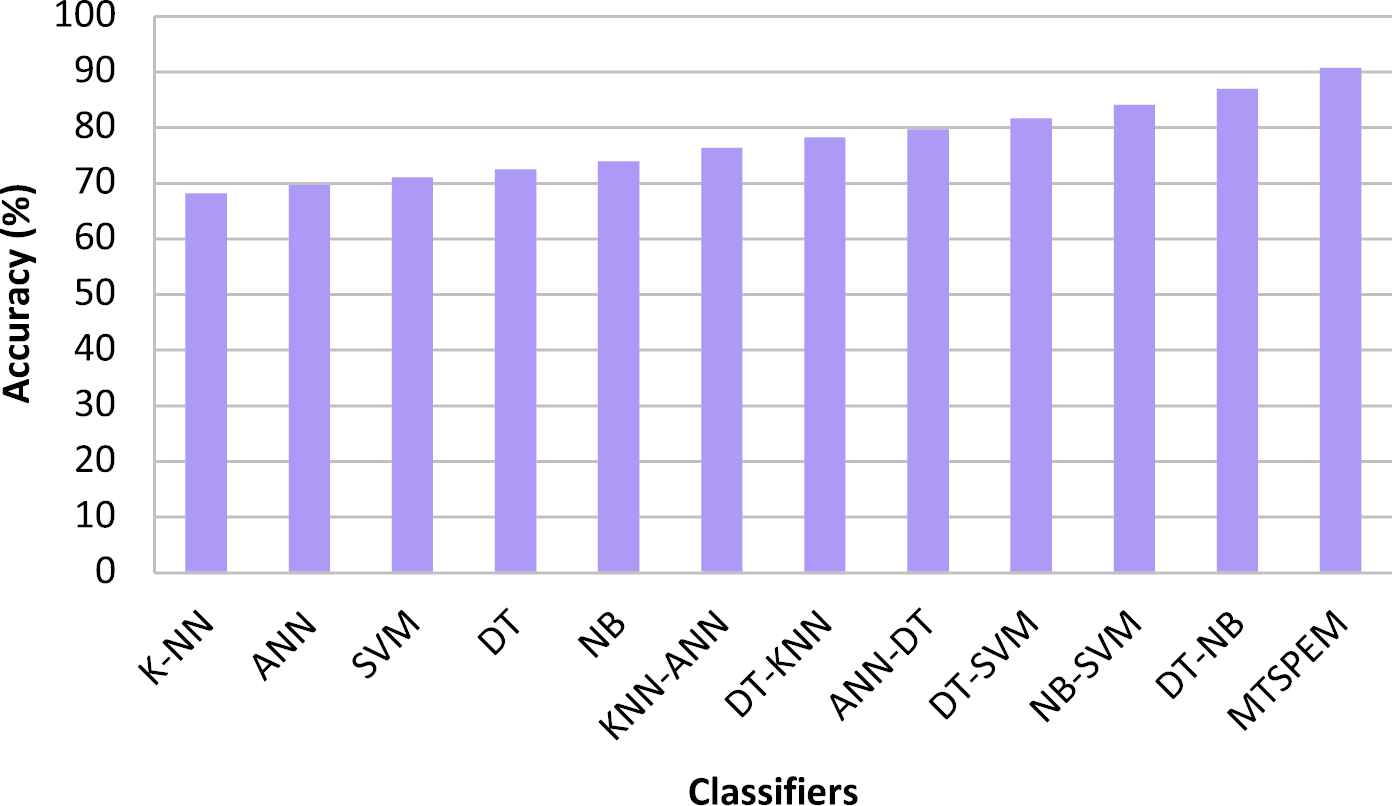
Accuracy of classifiers.
When the precision and accuracy rates are considered for measuring the model performance, it is important to consider the error rates in classification, and the corresponding results are provided in Figures 6 and 7. The average error rate found in the proposed classification model is 0.0924, which is the lowest among all models. Moreover, the multi-tier classification model fixes efficient classification techniques, and that reduces the time and computational complexities. Hence, by performing student classification using the proposed work utilizes minimal time and the results are provided in Figure 8.
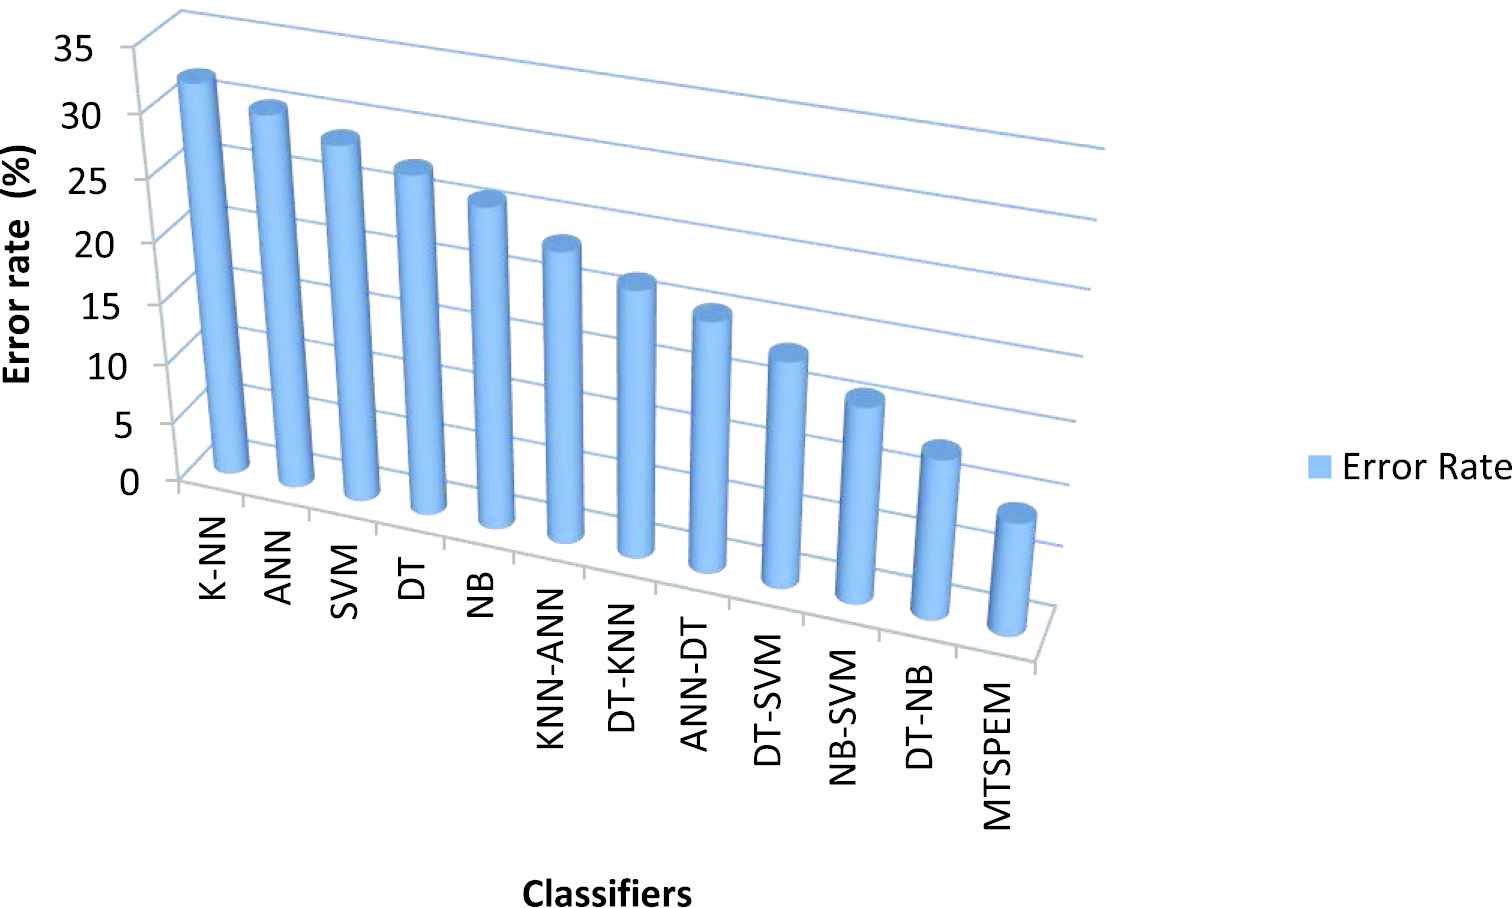
Error rate of classifiers.
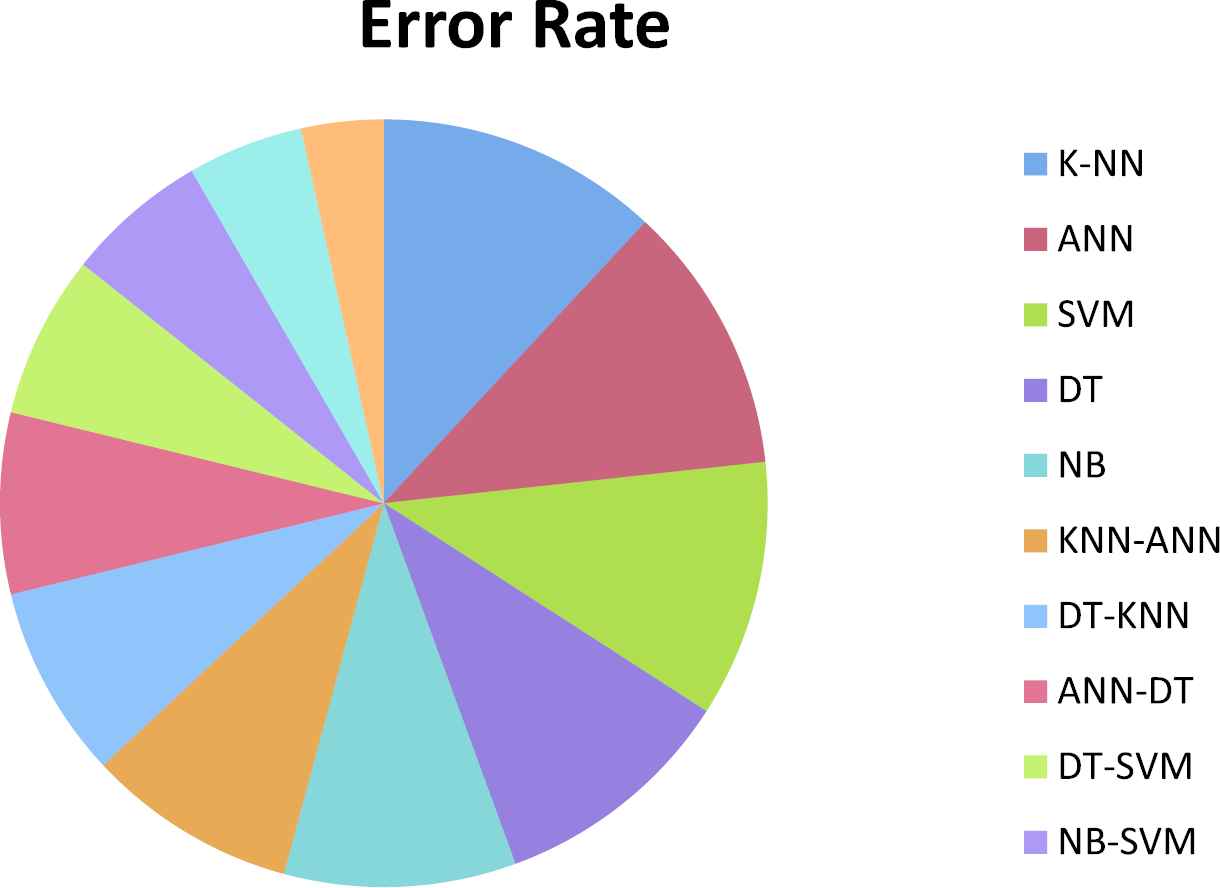
Acquired error rate between models in student's classification.
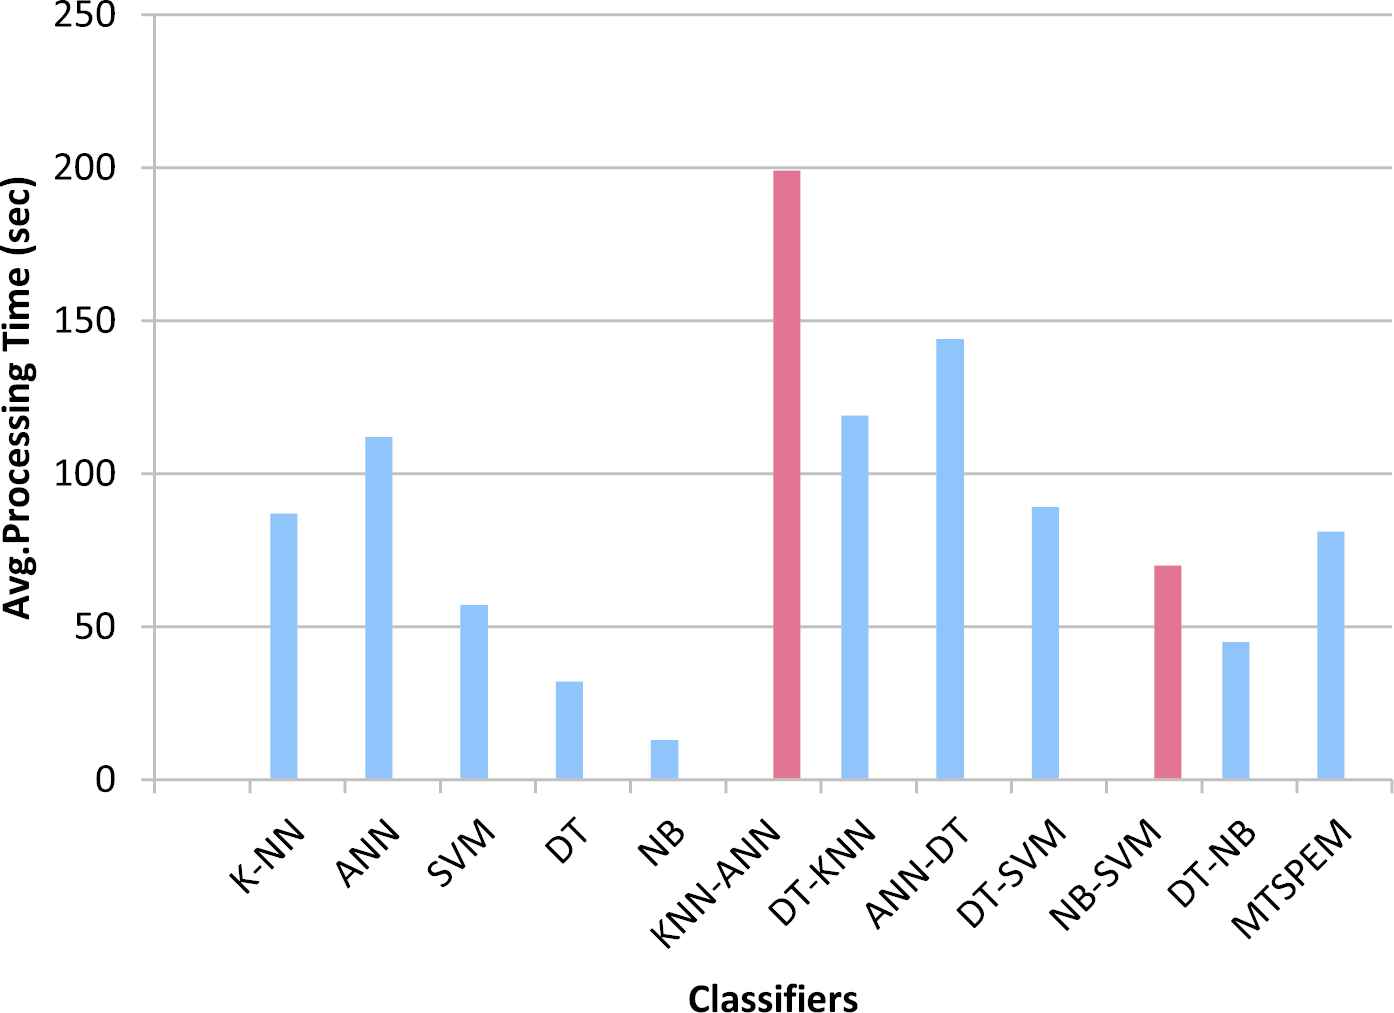
Processing time in classification.
The final classification results of student performance classification from the data samples obtained are displayed in Figure 9. As mentioned before, there are 500 student samples are considered for testing and based on the operations in proposed work, the model classifies 122 samples under LOW, 154 samples under AVERAGE, 146 under GOOD and 78 under OUTSTANDING and their percentages are given as 24%, 31%, 29% and 16% respectively. In this classification, the error rate is considered as 0.1380% with higher rate of accuracy.
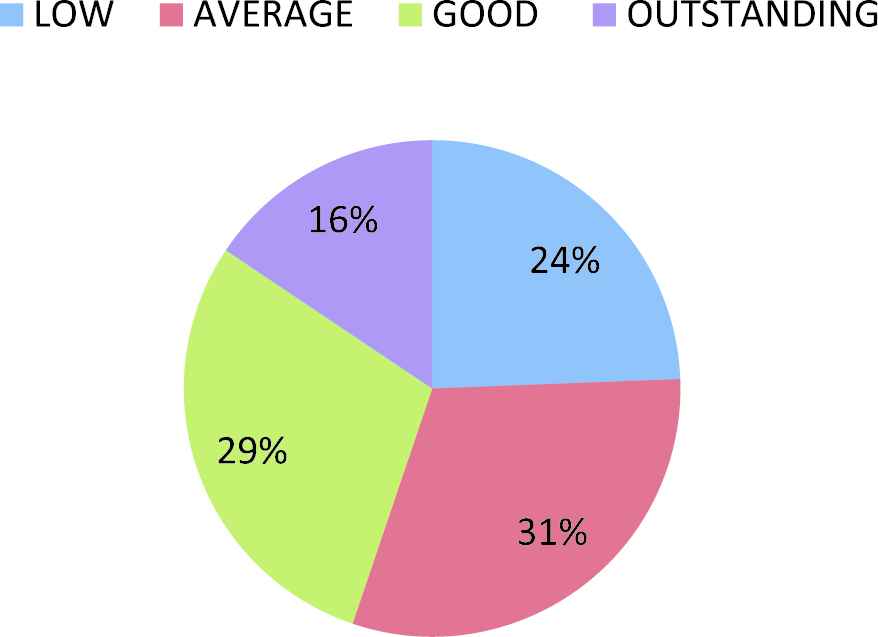
Final student classification results in Multi-Tier Student Performance Evaluation Model (MTSPEM).
5. CONCLUSIONS AND FUTURE WORK
In this paper, a model for classifying students called MTSPEM is developed. The classification operations are performed based on the personal behavior and academic performances of students. For evaluation, the benchmark dataset of students in Higher Education are obtained from UCI repository and preprocessed with for removing insignificant features. Further, correlation based feature selection is performed with respect to the SSLF, for deriving features that are influencing the academic results. Following, the first-tier and second-tier classification is performed using base and ensemble classifiers. Naive Baye's model is used for processing base classification and, RF, AdaBoosting and Stacking are used for second-tier operations. By this, the proposed classification model performs multiple classifications and proving the results as four classes, OUTSTANDING > GOOD > AVERAGE > LOW. Based on the classification results, further decision making for improving results and different teaching methods can be made. The model performance is evaluated with WEKA tool based on parameters such as Accuracy, precision and classification errors. The results show that the proposed model provides higher precision with minimal error rates, which outperforms the results of other classification techniques in student classifications.
The work can be enhanced with some multi-dimensional analysis patterns and real-time large data samples can be used for processing with improved result accuracy.
CONFLICTS OF INTEREST
The authors declare they have no conflicts of interest.
AUTHOR'S CONTRIBUTIONS
E.S. Vinoth Kumar, S.Appavu alias Balamurugan and S.Sasikala conceived and worked together to achieve this work. E.S.Vinoth Kumar was responsible for analysis, investigation, data curation and writing-original draft preparation. S.Appavu alias Balamurugan was responsible for Methodology, Validation, Writing-review and Project Administration. S.Sasikala was responsible for Editing, Experimental investigation, Visualization, Evaluation and Supervision. All the authors wrote, edited and revised the article.
ACKNOWLEDGMENTS
Authors thank the editors and the anonymous reviewers for their insightful comments which improved the quality of the paper.
REFERENCES
Cite this article
TY  - JOUR
AU  - E. S. Vinoth Kumar
AU  - S. Appavu alias Balamurugan
AU  - S. Sasikala
PY  - 2021
DA  - 2021/06/16
TI  - Multi-Tier Student Performance Evaluation Model (MTSPEM) with Integrated Classification Techniques for Educational Decision Making
JO  - International Journal of Computational Intelligence Systems
SP  - 1796
EP  - 1808
VL  - 14
IS  - 1
SN  - 1875-6883
UR  - https://doi.org/10.2991/ijcis.d.210609.001
DO  - 10.2991/ijcis.d.210609.001
ID  - VinothKumar2021
ER  -