
Toward Automated Quality Classification via Statistical Modeling of Grain Images for Rice Processing Monitoring
- DOI
- 10.1080/18756891.2016.1144158How to use a DOI?
- Keywords
- Process monitoring; Sequential fragmentation theory; Weibull distribution; Least squares-support vector machine (LS-SVM)
- Abstract
Computer vision-based rice quality inspection has recently attracted increasing interest in both academic and industrial communities because it is a low-cost tool for fast, non-contact, nondestructive, accurate and objective process monitoring. However, current computer-vision system is far from effective in intelligent perception of complex grainy images, comprised of a large number of local homogeneous particles or fragmentations without obvious foreground and background. We introduce a well known statistical modeling theory of size distribution in comminution processes, sequential fragmentation theory, for the visual analysis of the spatial structure of the complex grainy images. A kind of omnidirectional multi-scale Gaussian derivative filter-based image statistical modeling method is presented to attain omnidirectional structural features of grain images under different observation scales. A modified LS-SVM classifier is subsequently established to automatically identify the processing rice quality. Extensive confirmative and comparative tests indicate the effectiveness and outperformance of the proposed method.
- Copyright
- © 2016. the authors. Co-published by Atlantis Press and Taylor & Francis
- Open Access
- This is an open access article under the CC BY-NC license (http://creativecommons.org/licences/by-nc/4.0/).
1. Introduction
With the rapid development of the national economy and the improvement of the living standards of the human beings, consumers put forward higher and higher requirements on food quality. Rice provides the major source of dietary energy and protein, with regard to human nutrition and caloric intake[1], which is the most widely consumed staple food for the largest population, especially in China, who has the largest population in the world. Hence, intelligent and automated rice quality grading and classification packaging have represented the core competitiveness of each rice processing company. For the purpose of providing high quality product, rice, and reducing the processing cost, most of the rice processing enterprises have concerned the automatic classification technology rather than the inefficient and subjective manual inspection of the rice processing-quality.
The appearance of the product, rice, including color, size, shape, surface texture and variety of defects, is an effective visual indicator to its internal quality, e.g., nutrition ingredient, taste and so on, to some extent. Hence, the appearance of the rice product is a very important sensory attribute for rice quality grading, which greatly influences the preferences of consumers and consequently the market value of enterprises.
In earlier years, rice quality was inspected manually, thus the accuracy and efficiency of the rice processing-quality inspection results generally depend on the naked-eye observation of humans with their subjective experience. It is worth noting that the manual inspection is a time-consuming and labor-intensive work and the inspection results depend largely on human experience. During the past several years, computer vision-based food quality inspection system, as a rapid, non-contact, nondestructive, low-cost and objective tool, has attracted enormous interest both in academic and industrial communities [2,3].
Brosnan[4,5] reviewed the developments of machine vision-based quality inspection techniques of food products in a variety of different applications in food industries in early years. Like the traditional computer vision monitoring system, the main steps include rice image capturing, processing and feature extraction and the ultimate content understanding, e.g., image-based rice processing quality classification or grading by employing some machine learning and pattern recognition methods. A more recent elaborate summary of the existing computer vision related external quality inspection of fruits and vegetables can be found in [6], which summarized the principles, developments and applications of computer vision-based food quality inspection and pointed out that it is important and necessary in the postharvest preprocessing stage and it has become a common and scientific tool in industrial and agricultural manufacturing automation.
Machine vision-based rice quality inspection system imitates the vision of the human eyes by capturing and analyzing the rice images of rice products automatically. Thus, digital image processing and analysis methods should be adopted definitely to extract a sufficient number of suitable features, which are used for rice quality grading or process monitoring and control. Consequently, it enables a computer to understand the underlying content of rice images by employing pattern classification and recognition methods[6,7].
In earlier years, people tend to be more concerned about the physical properties of each individual rice grain, such as surface gloss, physical shape, size and other characteristics of each rice grain [8]. As addressed in the surveys[5,9], the first step of these methods is rice image segmentation in general, which is the foundation of gaining proper descriptions of the surface color, shape and size of each individual rice grain. After feature extraction, a kind of classifier such as neural networks, support vector machines or other supervised pattern recognition methods is established to achieve the automatic grading or classification of rice quality[10].
Although many experiments have verified the effectiveness of these aforementioned methods with a high grading accuracy (higher than 90% recognition rate), in practical applications, many problems exist, for example, the accuracy of the particle image segmentation and the efficiency of image processing (the highest record reported is only 1200 particles per one minute [9]).
Recent years, researchers expected to bypass the time-consuming and unsatisfactory image segmentation process in the rice image processing. Therefore, researchers tend to be more concerned about the spatial variations (structural distribution) in the gray or color spaces of rice images. Namely, they pay more attention to the spatial structure features of rice images, usually called as image texture[11]. Texture feature is a statistics-related and ubiquitous feature in almost every image yet has a great challenge to interpret by the traditional computer vision technologies.
Jackman[7] has pointed it out clearly that further analysis of image texture besides the traditional image features of the rice image is expected to achieve more sophisticated description to get higher classification accuracies. Actually, researchers had focused on the texture features of rice images for rice quality inspection in the earlier years. The commonly used texture description methods are some simple second statistics based on the gray level co-occurrence matrix (GLCM), gray level run length matrix (GLRM), local binary pattern(LBP), histogram description of pixel difference with their varieties and some other mathematical description methods[7].
As research continues, multi-resolution analysis related methods[12,13], such as Wavelet Transform, Gabor filters, fractal pattern analysis, have progressively attracted extensive interest in rice image analysis and perception for rice quality inspection. Almost all of these methods attempt to extract statistics in a variety of different scales or bands to characterize the grain images for content understanding. Though these methods provide a way of analyzing rice images under various observation scales, the proposed mathematical statistics cannot always depict the distinct features from the complex texture images for product qualities inspection or process condition monitoring, especially from the complex grain images, comprising a pile of tiny grain particles without distinct foreground and background.
During the processing of the polished edible rice, grain particles are randomly stacking on the transfer belt and squeezing each other after the rough rice is subject to dehusking or removal of hulls and then to the removal of brownish outer bran layer known as whitening[1], which results in the failure of showing the obvious distinction between the foreground and background in the collected rice image. Hence, it is generally difficult to put forward an effective segmentation method to delineate the specific features of each individual particle. Furthermore, some local particle-based information is actually insufficient for rice quality monitoring. The reliable information should be the accumulating particles randomly piled in the entire observing field, which is described by a certain visual characteristics of macro, i.e., the image statistical distribution characteristics.
To obtain the statistical distribution of the pixel intensity or color information in the grain image, current vision systems either extract some simple statistics, or introduce some specific empirical statistical distribution models to describe the distribution of the image pixel intensities in a special transform domain. Commonly used statistics for rice image feature description such as means or variances for rice quality perception are confined with the unreliable assumption that the pixel intensity (in the transform domain) distribution is Gaussian distribution. Besides the latent Gaussian distribution, the other commonly used statistical distributions models, such as generalized Laplace distribution[14], Gamma distribution[13], are predefined based on the human experience without guideline for statistical model selection or evaluation in theory. The effectiveness of the model selection greatly affects the accuracy of the final inspection results.
Since the proposed statistical parameters or empirical statistical models are short of actual physical sense perception mean, they are often difficult to effectively characterize the most essential characteristics of the complex grain images or particle images which are comprised of a large number of random local homogeneous particles or fragmentations. Therefore, it severely restricts the further application of industrial vision systems in rice-processing-quality monitoring.
In order to overcome the problems of understanding the complex grainy images comprised of a large number of local homogeneous particles or fragmentations, without obvious distinction between foreground and background, for effective rice quality classification, we present an image statistical modelingbased rice quality inspection method in this study. We analyze the Weibull distribution process of the spatial structure of grain images with complex texture feature base on visual perception mechanism in advance. In order to obtain the complex spatial structure details of particle images, we introduce a multi-scale and omnidirectional Gaussian derivative filtering for image spatial structure feature extraction. The Weibull distribution model parameters are computed as the structural features of rice images for quality inspection. At last, a LS-SVM classifier is established to automatically identify the rice quality.
2. Statistical Modeling of Grain Images
2.1. Weibull Distribution Process of Grain Images
Rice image is a kind of special grain image with complex texture pattern, whose most important visual structure is the reflection of the spatial layout of rice particles piling up in the visual field. As can be seen from Fig.1, a typical rice image is completely covered by a large number of local homogeneous rice particles which randomly stack and squeeze each other. These images do not have distinct foreground and background.
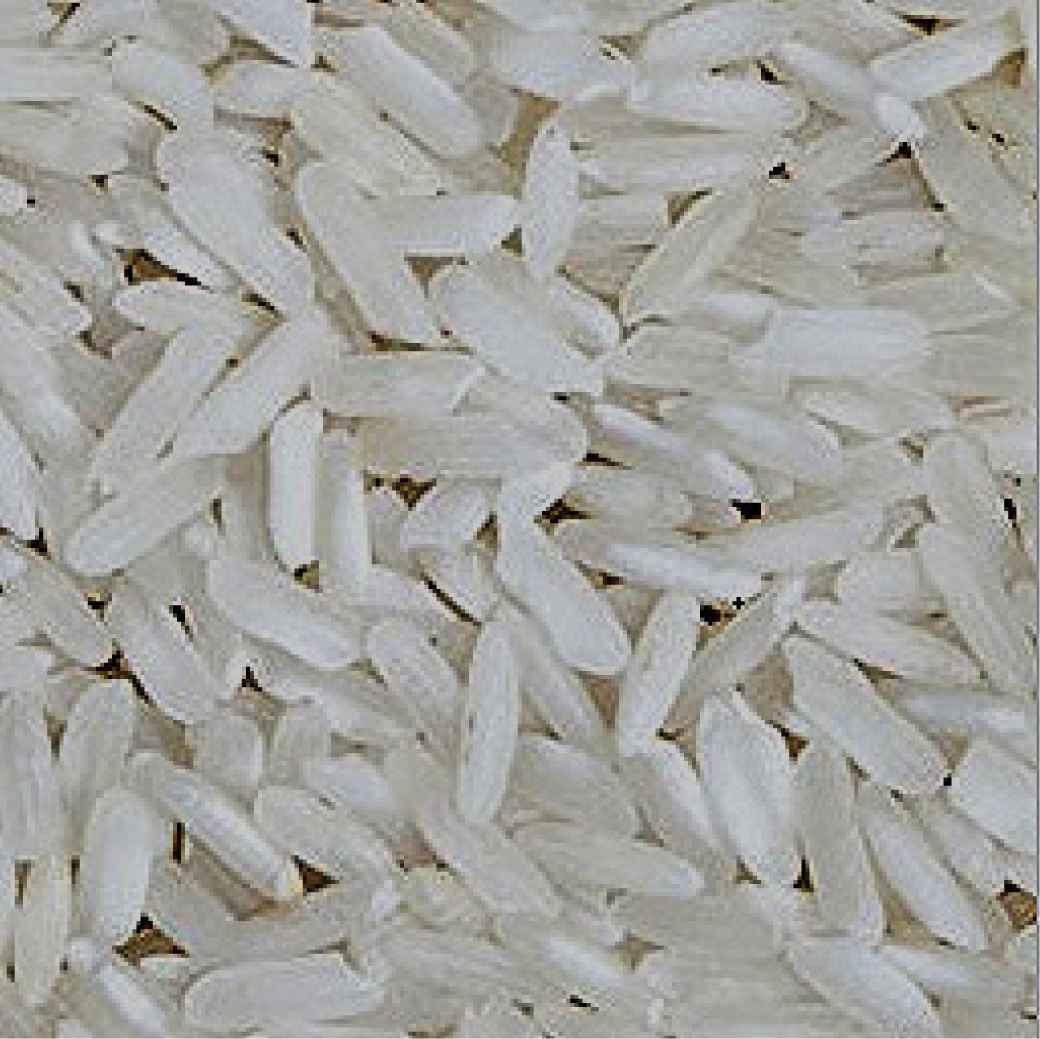
Typical grain images
In terms of the machine vision inspection, if the resolving power of the vision sensor is high enough, the captured rice image would contain abundant local structural details of the rice particles. Hence the edges of these local particles would divide the visual scene into numerous independent tiny regions, each of which has the same intensity. With the decrease or increase of the power resolution of the visual sensor, the adjacent structure will merge or re-subdivide, which leads to form coarser local particle structures or finer local particle structures.
Studies have shown that the re-subdivision or merging processes of the spatial structure details in complex particle images are equivalent to the processes of sequential fragmentation[15] well known in the ore grinding process. According to the theory of sequential fragmentation, the size distribution of particles or masses in the particle images subject to a power-law distribution, which could be described by the following formula:
Since a grain image is composed of a large number of local homogeneous fragmentations, the contrast histogram distribution of the fragmentations is generated by the accumulated local particles which obey power-law distribution[15],
Since the resolving power of the visual sensor in real applications cannot be infinite, the fragmentation process of the local particles in the rice image will inevitably stop and the particle details will always tend to be stable. Hence the statistical distribution of the spatial structure of the grain image just correspond to the debris particles whose local contrast larger than x. Therefore, the statistical distribution of the spatial structure of the rice image can be described by the integral-form WD model,
Previous studies have emphasized that the integral-form WD model can effectively portray many classical statistical distributions. As an example, when λ = 1, WD becomes an exponential distribution with the mean of β. When λ = 2, the integral form WD model actually turns out to be a Gaussian distribution. The parameters in the integral-form WD model have direct correlations with human visual perception[15], where λ is a shaped-perception parameter of the spatial structure reflecting the particle size, shape and other related visual characteristics, β is the scale parameter with a direct relationship to image illumination contrast. Furthermore, studies have also demonstrated that the shape parameter λ is directly related to the fractal dimension of the image, the image of the fractal dimension is Df = −3λ.
2.2. Parameter Estimation
The integral-form WD model parameters λ and β can be estimated by the maximum likelihood estimation (MLE) method. Given that X = {x1,x2,⋯,xn} is the sampling data set, which is subject to the integral WD model, the corresponding log-likelihood function ln L(X|λ,β) indicates how well the model describes the sampling data
The model parameters can be estimated by setting the partial derivative of ln L(X|λ,β) over λ and β be equal to zero respectively
The parameter λ can be calculated by eliminating β in equation (7), then we can get
Because equation (8) does not have a close-form solution, it can be solved by the Newton-Raphson method, an iterative procedure of gradient-based root-finding method.
Given an initial λ0, the iterative procedure is repeated as
In equation (10),
The iterative procedure is repeated until the estimation λn converges, namely a sufficiently accurate value is reached. After achieving λ, β can be calculated by the equation (6).
3. Image Spatial Structure Feature Extraction
3.1. Gaussian Derivative Filtering
Supposing a local pixel I(0,0) is the original observed pixel point, any pixel point (x,y) in the local spatial structure around I(0,0) can be determined by the Taylor expansion. The approximate expression of the Taylor formula of Î(x,y) is as follows:
Fig. 2 shows the WD modeling results of the corresponding spatial structural details of a rice image with first and second orders of Gaussian derivative filters ( G1,σ and G2,σ) respectively. The modeling results explicitly demonstrate that the integral WD model can effectively characterize the statistical distribution profile of the spatial structure of the complex particle image.
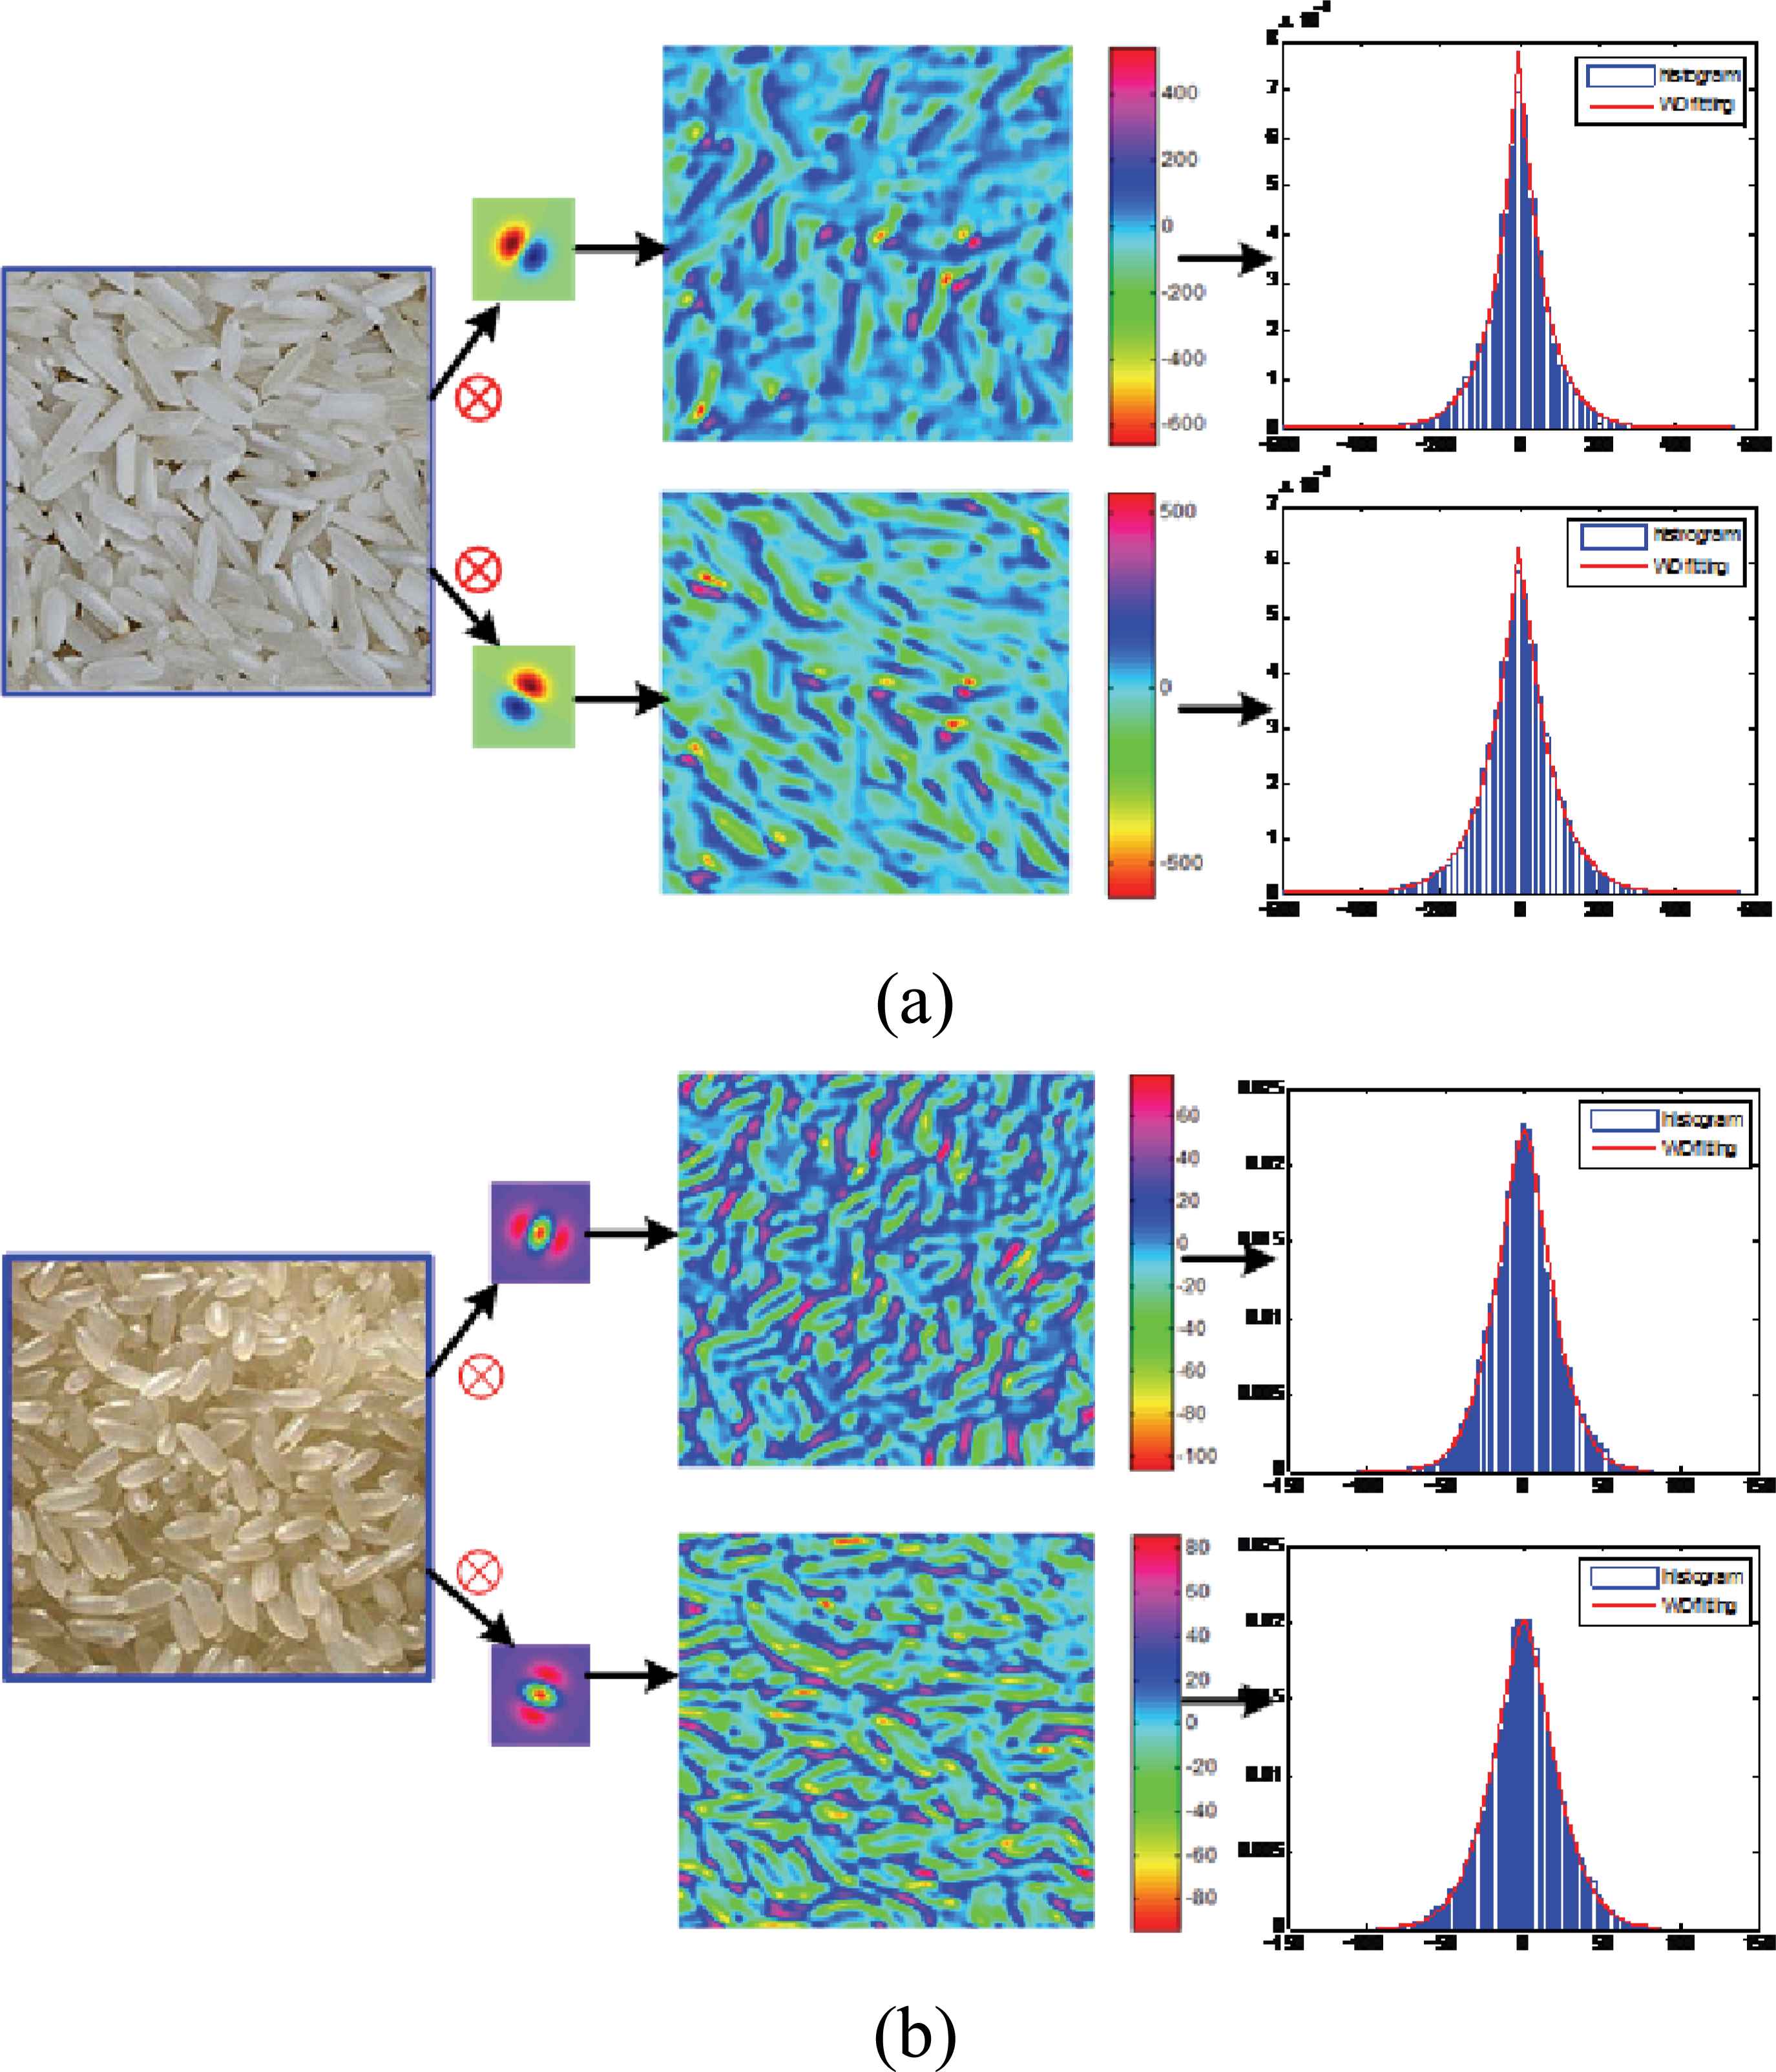
Statistical modeling of rice images with WD. (a)WD modeling results of rice image filtering with first order Gaussian derivative filters, I*G1,σ, (b)WD modeling results of rice image filtering with second order Gaussian derivative filters, I*G2,σ, σ = 1
3.2. Omni-directional Derivative Gaussian Filter
Using Gκ,σ to grain image analysis can obtain the characteristics of the spatial structure of the origin image over x and y direction. However, the grain structure, as shown in Fig.1 and Fig.2, exhibits obvious orientation characteristics. Therefore, it is necessary to introduce the direction information to the Gaussian derivative filters to obtain the spatial structure feature of the particle image under any direction.
Denote Gθκ,σ as the result of Gκ,σ after rotating an angle of θ. According to the research of Freeman[16], the rotated filter Gκ,σ can be calculated by the following formula
The best way to compute Gθκ,σ(x,y) is to use the minimum number of Gaussian derivative bases to represent Gθκ,σ denoted by the equation (13).
Set the minimum number of Gaussian derivative filter base as M, and convert Gκ,σ to the polar coordinates represented as Gκ,σ (r,ϕ) where
From equation (14), it is not difficult to find that the number of the optimal Gaussian derivative bases M is equal to the number of the non-zero harmonic components in the Fourier series decomposition of Gκ,σ (r,ϕ). Therefore, the solution ki(θ) is also the solution of the following equation
Through selecting M Gaussian derivative filter bases of some specific directions and solving equation (18), we can get the solution ki(θ) of an omnidirectional Gaussian derivative filter. For example, we can obtain Gθ1,σ and Gθ2,σ as follows,
Fig.3 displays the Gaussian derivative filters of Gθ1,σ and Gθ2,σ in several different directions between [90° ∼ 180°] and [0 ∼ 90°] respectively.
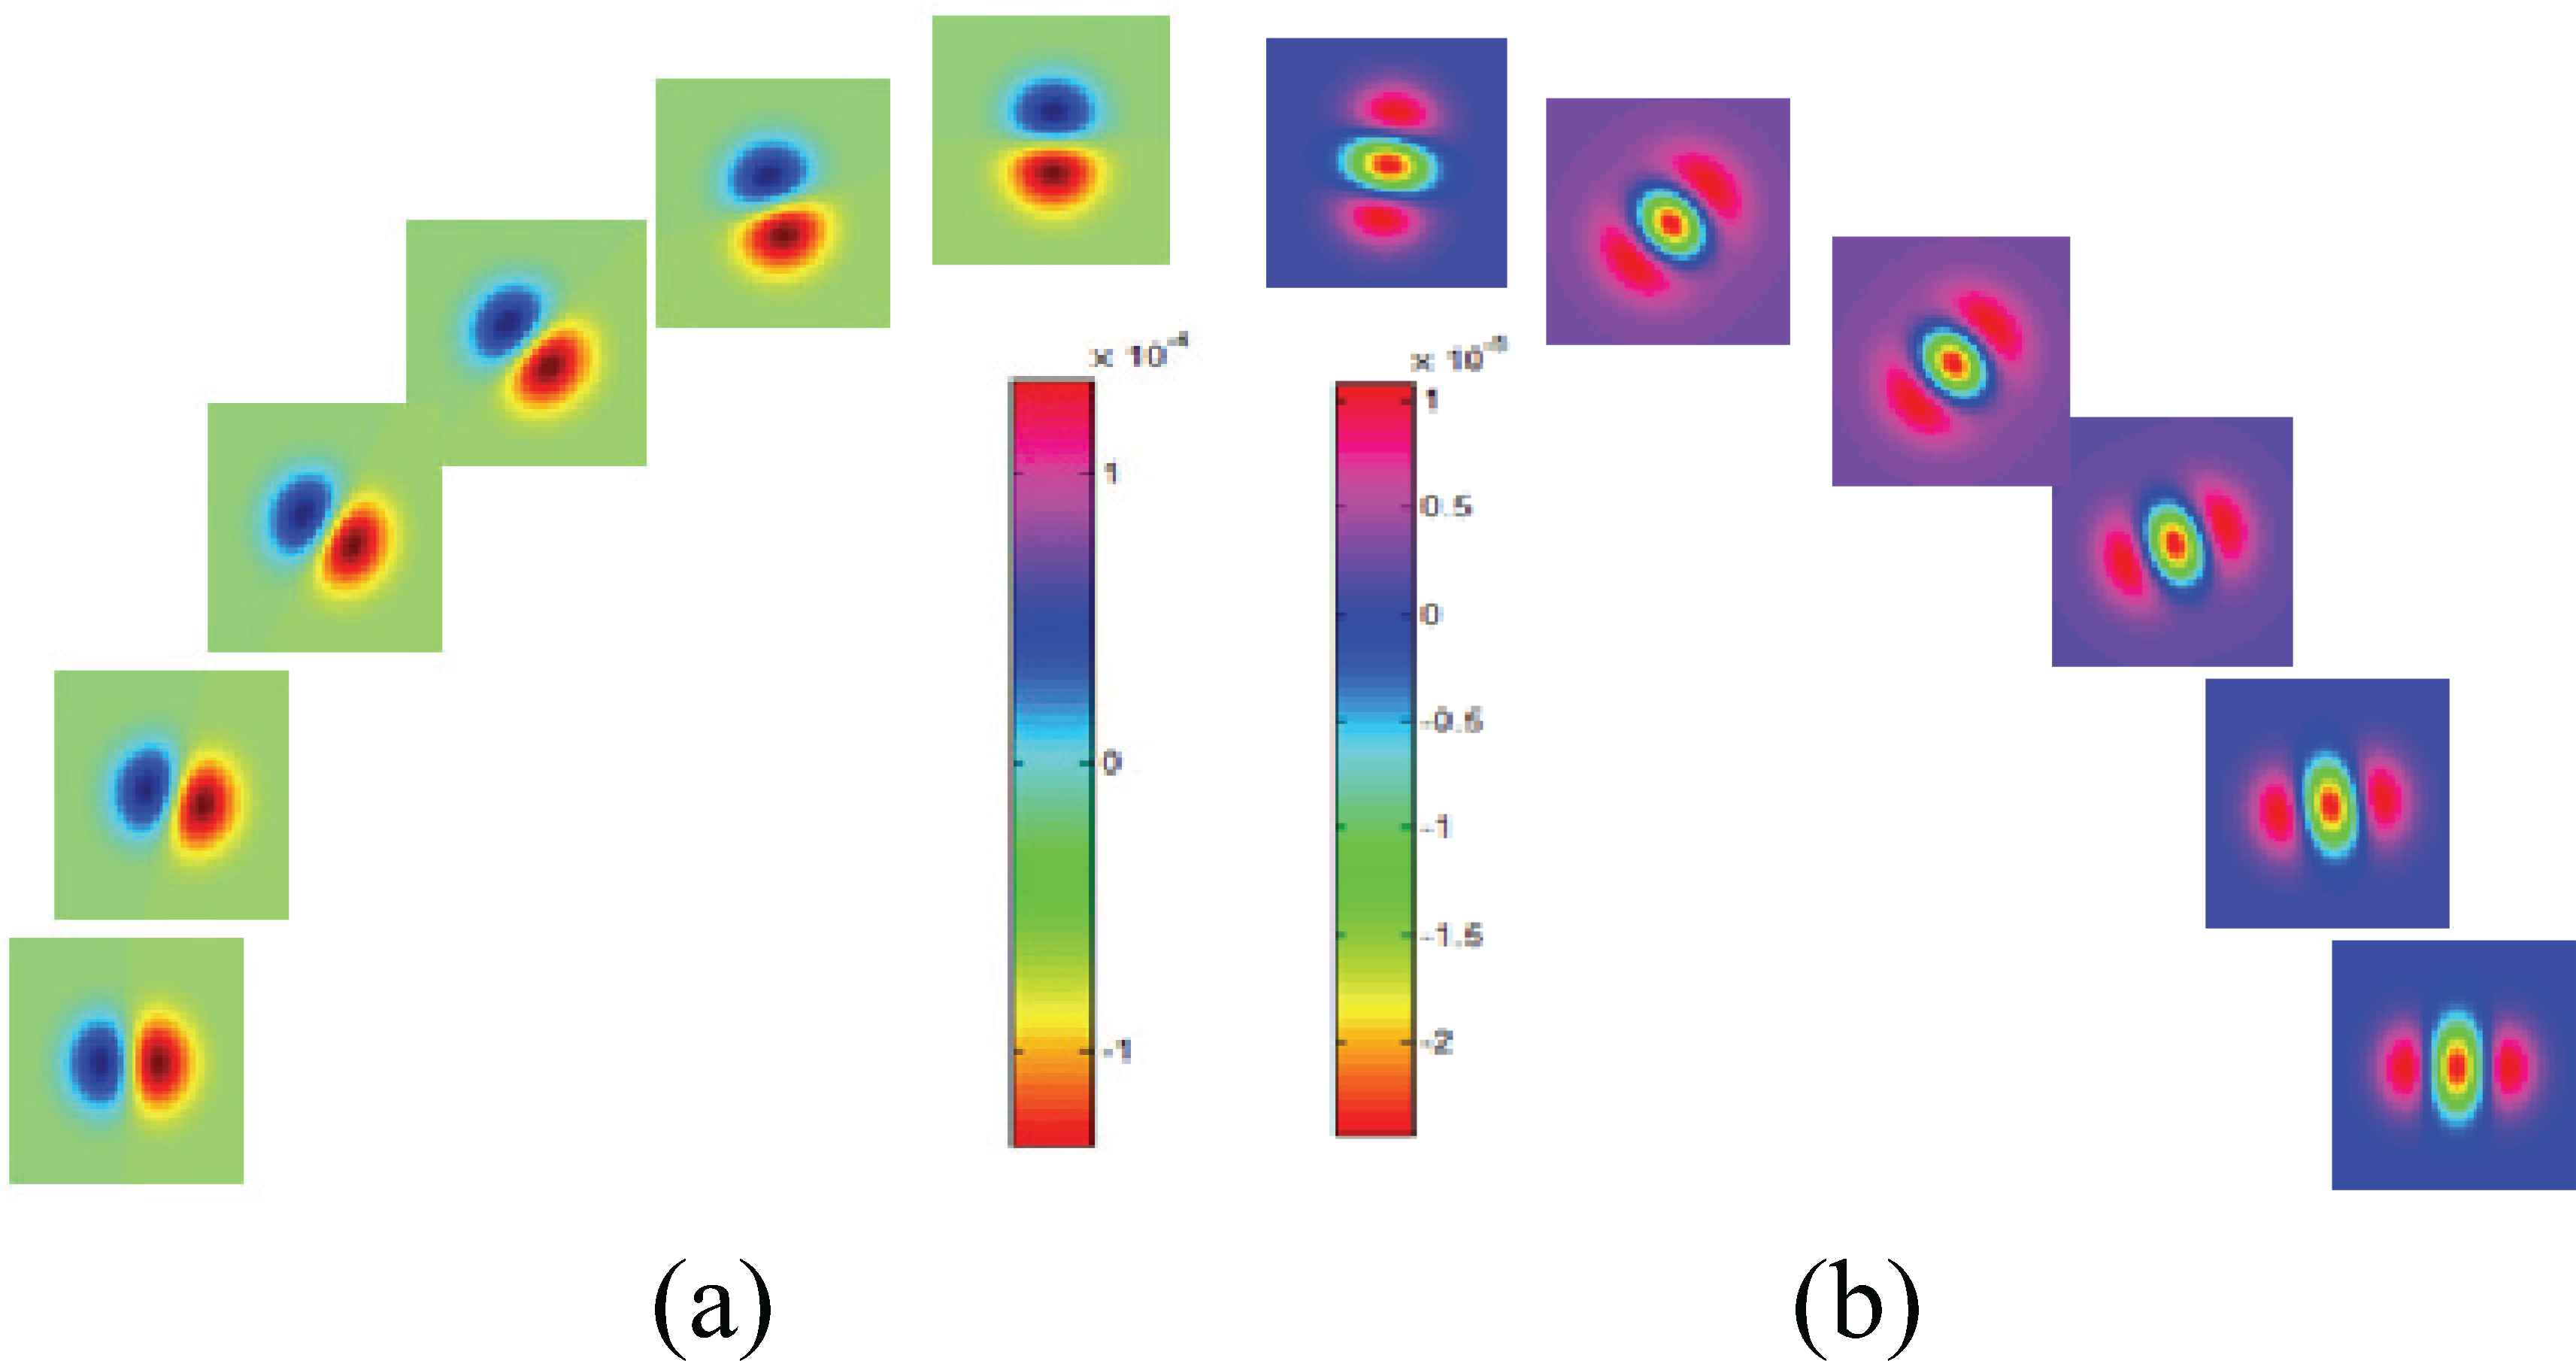
Gaussian derivative filters of several specific orientations.(a)Gθ1,σ,(b)Gθ2,σ
3.3. Statistical Characteristics Extraction of Images Spatial Structure
To extract the omni-directional structure features of the rice image, we discretize [0∼ 360° ] into N directions. The WD model parameters of the filtering responses are extracted as the rice image features. Since the particle image exhibit obvious directivity, the statistical features of the omni-directional spatial structure of any image under the Gaussian observation scale σ can be described as
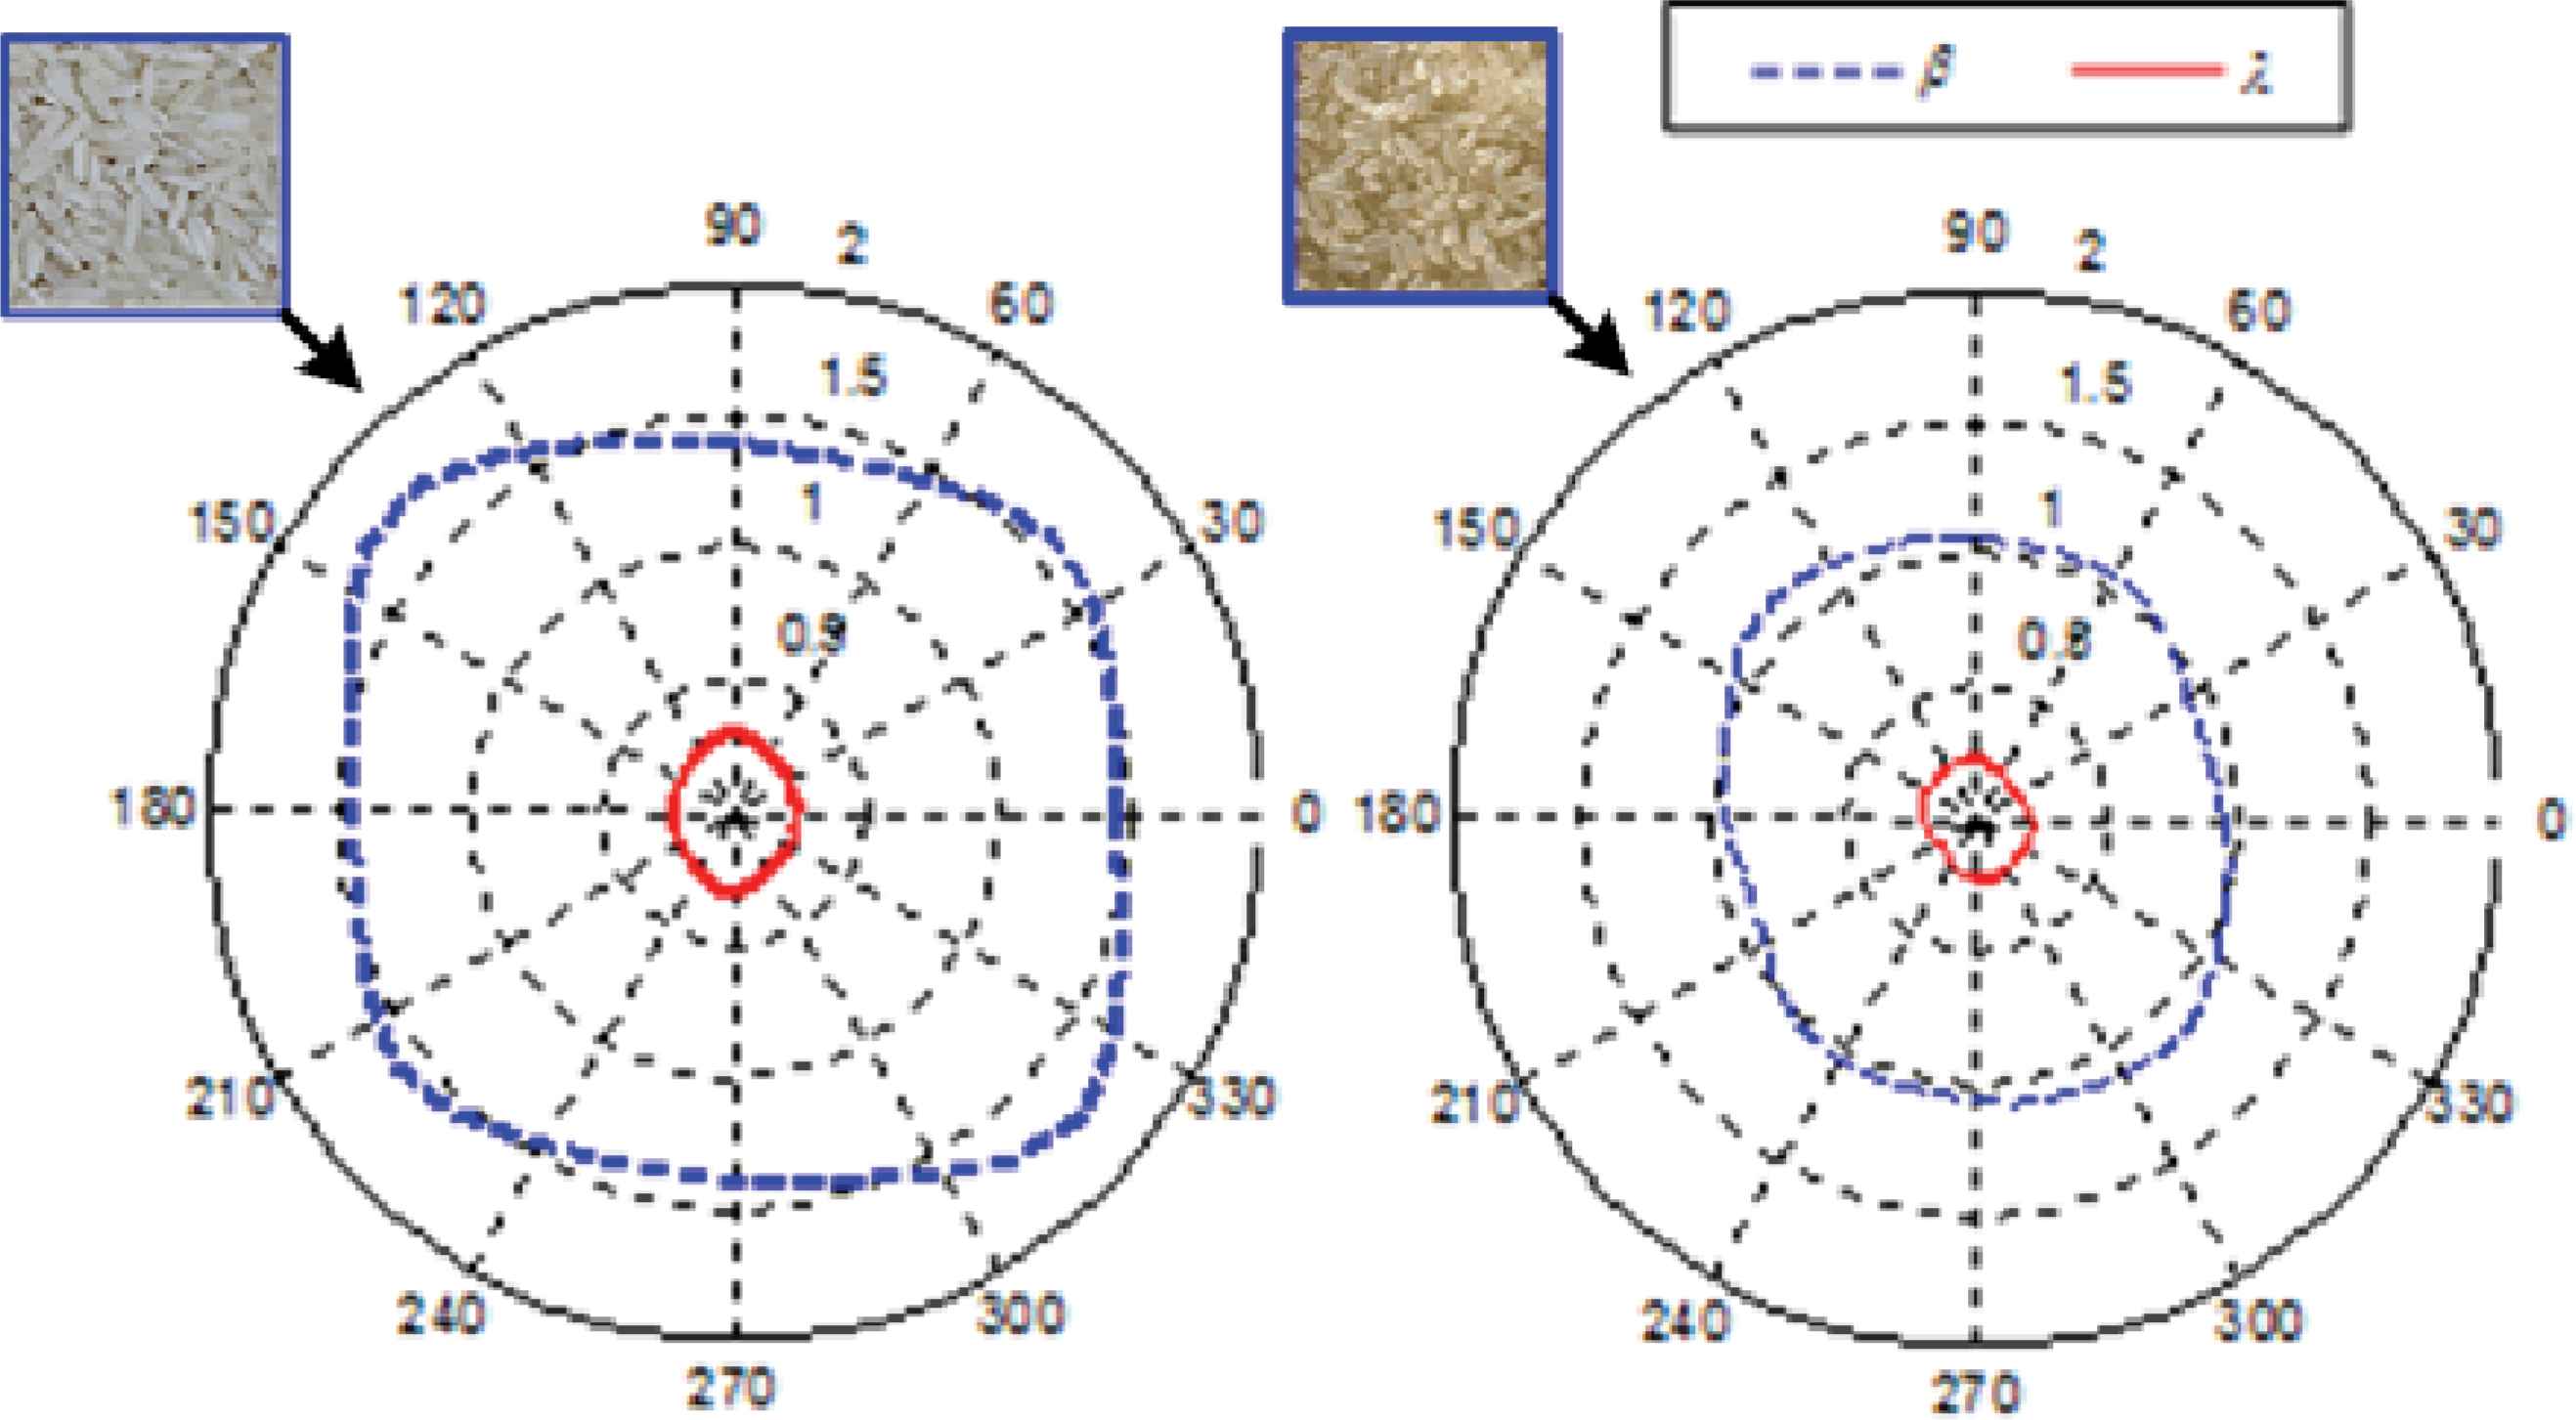
Polar plots of WD model parameter features of two different rice images
As can be seen from Fig.4, the WD model parameters of a grain image exhibit obvious directivity under a certain observation scale. The extracted WD-model parameters are the reflection of the most important spatial structural features, which can be used as the visual hint for rice quality inspection. In addition, we set a series of different observation scales to analyse the rice image omni-directionally under diverse observation scales. Specifically, if the scales of the Gaussian kernel are [σ1,σ2,⋯,σT], the corresponding rice image features can be expressed as follows.
4. Application Case
The proposed image statistical modeling based rice quality inspection method was applied to a rice-processing enterprise for performance verification. To achieve real-time rice-processing-quality inspection results, an appropriate visual surveillance system is built on an assembly line of rice processing in a food processing enterprise, in which the vision sensors (camera lens of line-scan digital camera) are vertical to the rice particles on the conveyor belt. Computer vision system achieves online rice processing-quality identification result based on the image statistical modeling and analysis results of the rice images with an intelligent classifier. When the visual monitoring system identifies the unqualified product (rice) on the assembly line, it will automatically control the actuator (air nozzle) of jet to blow away the low quality rice from production line (belt). Fig.5 is a simplified schematic of the computer vision inspection system for automatic rice processing-quality grading or classification.
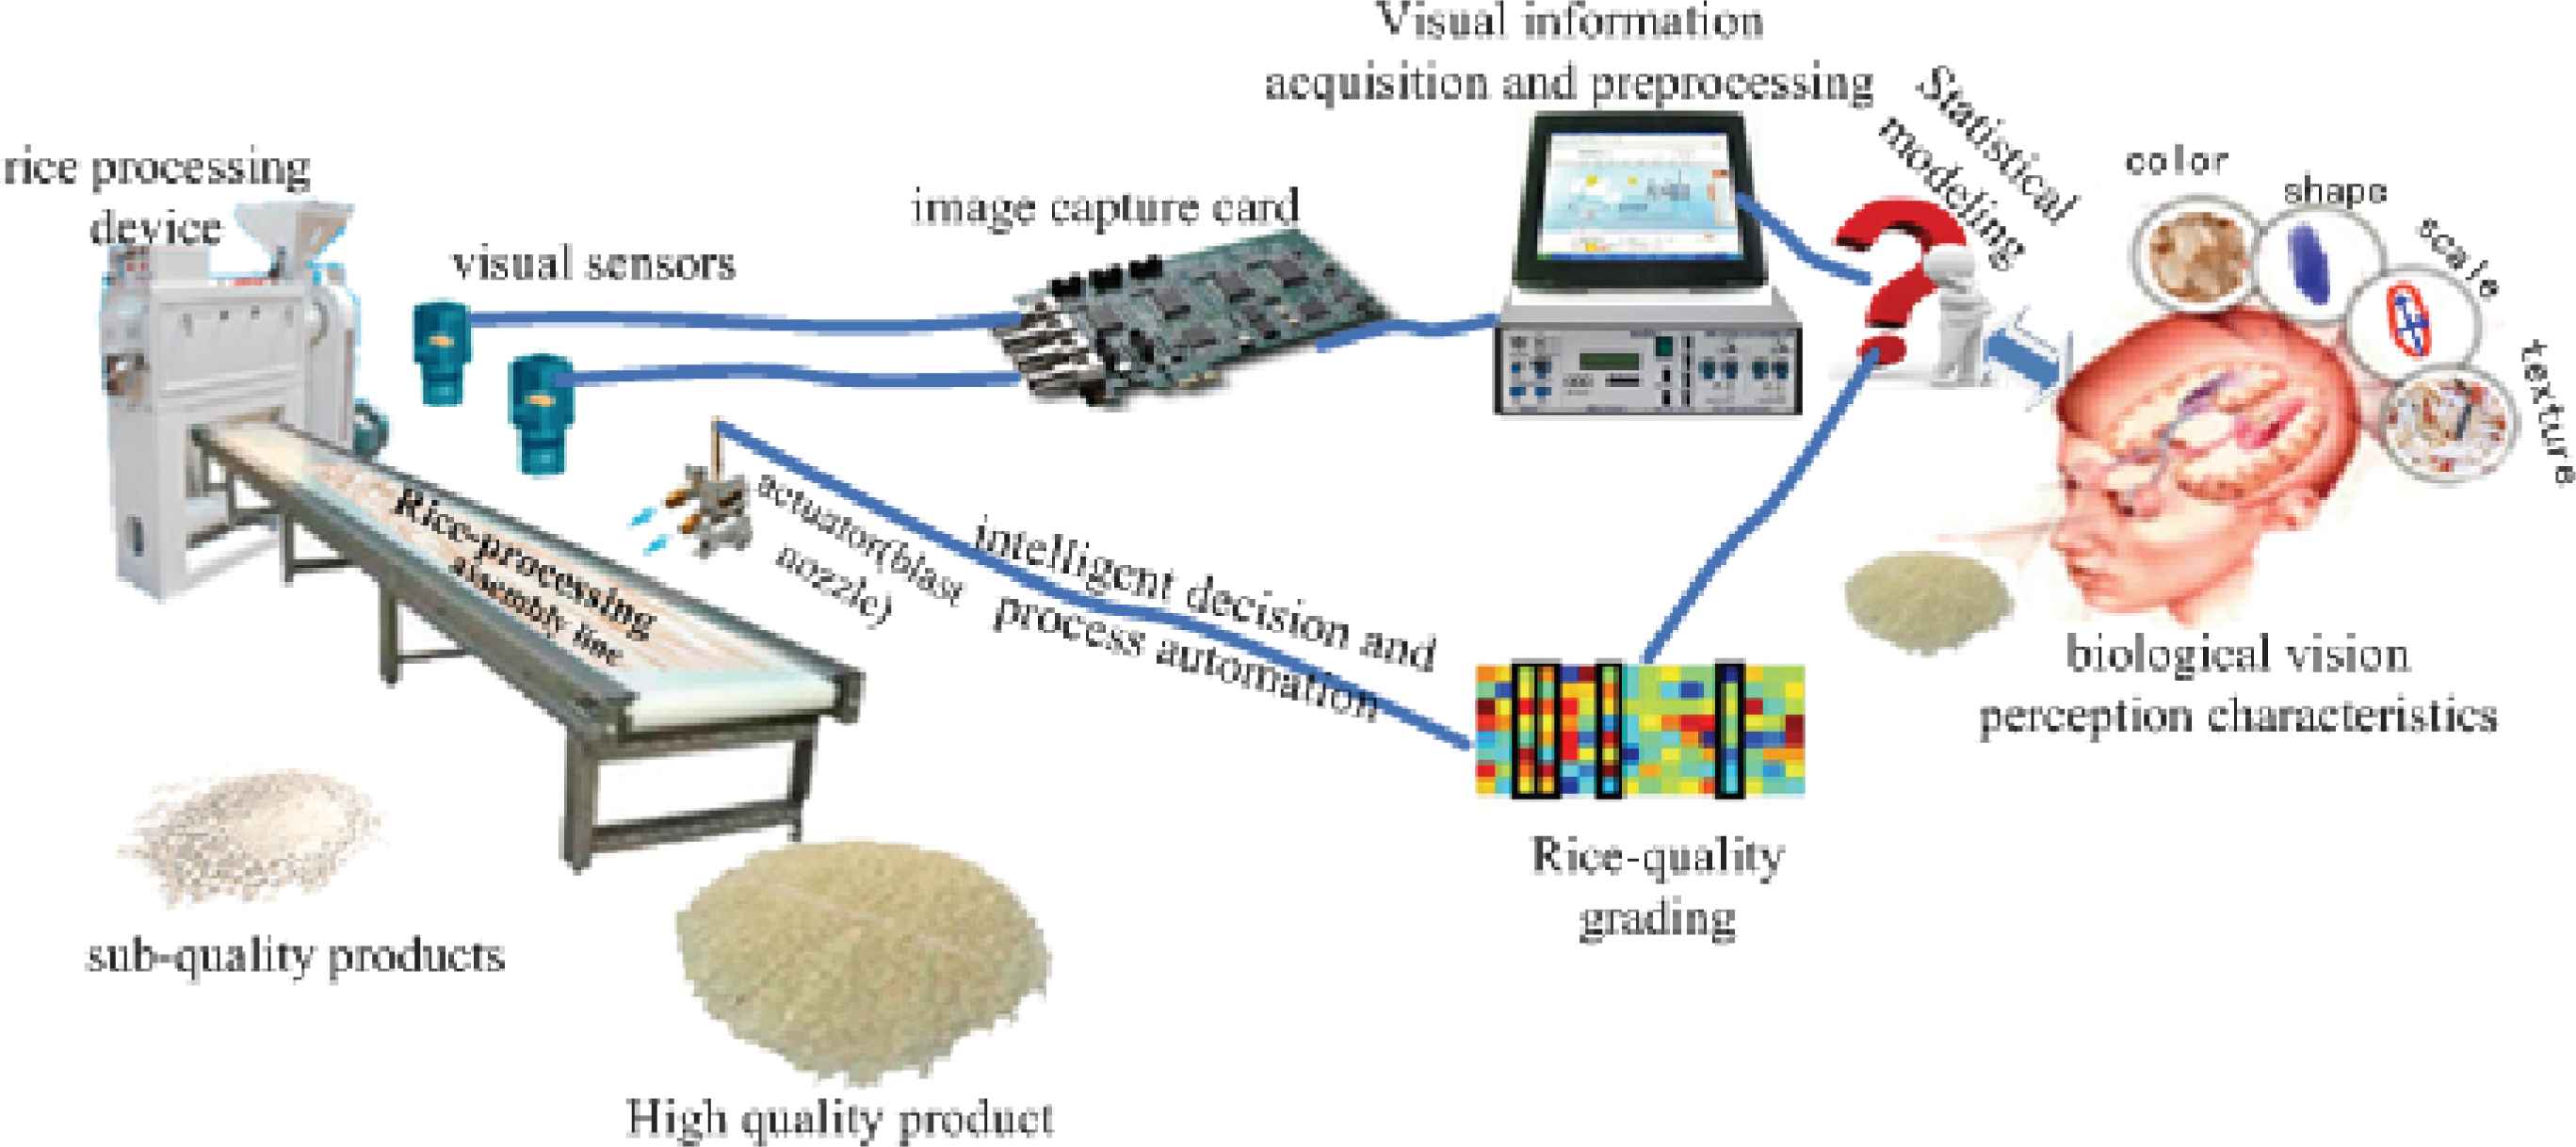
Schematic diagram of the machine vision based rice processing-quality inspection system
4.1. Classifier Construction
The task of rice processing-quality grading is a non-linear classification problem, which can be solved by the supervised pattern recognition or classification methods such as neural networks or support vector machine (SVM). SVM solves the pattern recognition problem through nonlinear mapping the samples into a high-dimensional (even infinite dimensional) feature space, which usually achieves good classification accuracy. Furthermore, the Least Square Support Vector Machine (LS-SVM)[17] solves a set of linear equations instead of a convex quadratic programming (QP) problem in the classical SVMs, which can reduce the complexity of the problem. Hence, a LS-SVM classifier is adopted in this work.
According to the actual demands of the food enterprise, we only consider the two-types classification problem of rice quality inspection. We denote the rice quality yt corresponding to a sample image t with the image feature xt as
Given the corresponding training set
Based on the classification model, we construct the optimization problem as,
To solve the optimization problem in equation (21), we can construct a Lagrange function under Karush–Kuhn–Tucker conditions with a n×n Gaussian radial basis function as kernel function K(xi,xk). Then, we can get the rice quality classification model f(x) as
In the real application, the data distribution is frequently unbalanced, for example, the number of samples regarding the “high quality” is larger than the number of the samples of “other quality” rice. In the common LS-SVM classification model described in the formula (21), each sample is set at a constant penalty parameter r, which is not an effective solution for the classification of the unbalance distribution data. Hence, in order to treat the samples discriminatingly in accordance with the different importance of the samples, different penalty factors should be provided for each of the samples. The optimization problem in formula (21) can be modified slightly as follows
The following steps are similar to the common LS-SVM model. Hence, by a little modification, we can get an improved LS-SVM (iLS-SVM) based classification model, which can solve the inaccurate classification problem incurred by the unbalanced distributed samples.
4.2. Classification Results of Rice Quality
In order to verify the effectiveness of the proposed method, we collect 5 kinds of rice in the assembly line for rice quality inspection. The corresponding rice quality responses are manually labelled by combining rice appearance and nutrients measured in the laboratory. The rice images are collected by the computer vision monitoring system mounted on the assembly line. The computer vision inspection system analyzes the rice images and identifies the rice quality with the iLS-SVM classifier based on the image feature extraction results. The pixel resolution of the test and training samples is 2048*256. The processing rate of each channel is about 2 kilogram per second.
(1) Experimental preparation
We denote the 5 varieties of rice as ω1 ∼ ω5. During the rice processing, the rice yield from the processing device is high quality in most cases. It is much convenient for us to collect the samples of “high-quality rice”. Hence, the probability distribution of the two classes of rice-quality is inevitably imbalanced. In the verification experiment, we have spent about the same time to collect the samples of each varity of rice. After eliminating the samples without clear rice images, the numbers of the remaining samples with imbalanced distributions of each variety of rice are displayed in Tab.1.
| quality | ω1 | ω2 | ω3 | ω4 | ω5 |
|---|---|---|---|---|---|
| High: yt = −1 | 600 | 545 | 602 | 621 | 659 |
| Others: yt = 1 | 202 | 213 | 192 | 221 | 197 |
| Sum | 802 | 758 | 794 | 842 | 846 |
Sample size of the 5 kinds of rice
In the rice-quality classification task, the K-folder cross-validation is a popular and effective experimental validation procedure. Hence, the commonly-used 10-fold cross validation repeated 10 times is used for classification accuracy evaluation. Namely, each collected data set (both positive and negative sample) is uniformly divided into 10 subsets. For the ith time, the ith subset is used as the testing set, and the other 9 subsets are used as the training set. In each repeated experiment, the order of the samples is shuffled to obtain more representative results.
When perform the directional filtering for image analysis, 180 directional filter in [0-360°] are used. The interval between any two adjacent directions is 2 degrees. 4-scale Gaussian kernels are used for rice image’s spatial structure analysis and the selected Gaussian scale is
(2) Evaluation measures
In terms of binary classification problem, 4 metrics are commonly used for the classification performance evaluation[18]. They are:
- (a)
True positive (TP), the number of positive instances (in this work, it represents the samples of the other-quality) that are correctly classified;
- (b)
False positive (FP), the number of negative instances (in this work, it represents the samples of the high-quality) that are incorrectly classified as positive samples;
- (c)
True negative (TN), the number of negative instances that are correctly classified; and
- (d)
False negative (FN), the number of positive instances that are incorrectly classified as negative samples.
Based on the metrics, we conduct 3 types of measures to evaluate classifier performance.
First of all, the receptive performance evaluation index is the total classification accuracy (TCA), which can be computed as
Though TCA provides a simple way of evaluating the classification accuracy, it is apparently not enough for classification accuracy evaluation because in real rice quality inspection task, the classification errors of different classes may bring distinct economic losses. For example, if we misclassify the sub-quality rice as high-quality rice, it may make the consumers lose confidence to the product of the company and consequently seriously reduce the credit of the food enterprise. However, if we misclassify the high-quality rice as other quality rice, it will reduce the yield and cause some waste of the food resource. In general, the first mentioned misclassification usually causes greater economic losses. Hence, in this work, we pay more attention to the correct recognition of the positive class (the other quality of rice), which has the minority samples.
Then, in lieu of TCA, other metrics to obtain comprehensive assessment should be defined. Commonly-used sensitivity (Sens) and specificity (Spec) are defined as follows:
These two measures are aggregate into a widely used measure, Geometric mean (GM), which is a frequently used method for comparing positive and negative classes regardless of their size
The measure GM considers the classification performance both of the minority class and the majority class. It will achieve high value only if the classifier gains high classification accuracies both on the majority class and the minority class. If the classifier prefers a certain category, it will affect the accuracy of another type of sample and consequently lead to small value.
The third measure named F-measure is defined as follows
(3) Classification results
We first evaluate the classification accuracies of processing-quality of the 5-varieties of rice by the measure of TCA, which are displayed in Fig.6. In the classification experiment, the orders of the Gaussian derivative filters considered are first-order, second-order, third-order and their combinations. The mentioned with a little modified LS-SVM based classifier is used for rice processing-quality grading. In the Fig.6, Gi represents the selected Gaussian derivative filter, and i is the order of the corresponding Gaussian derivative filter.
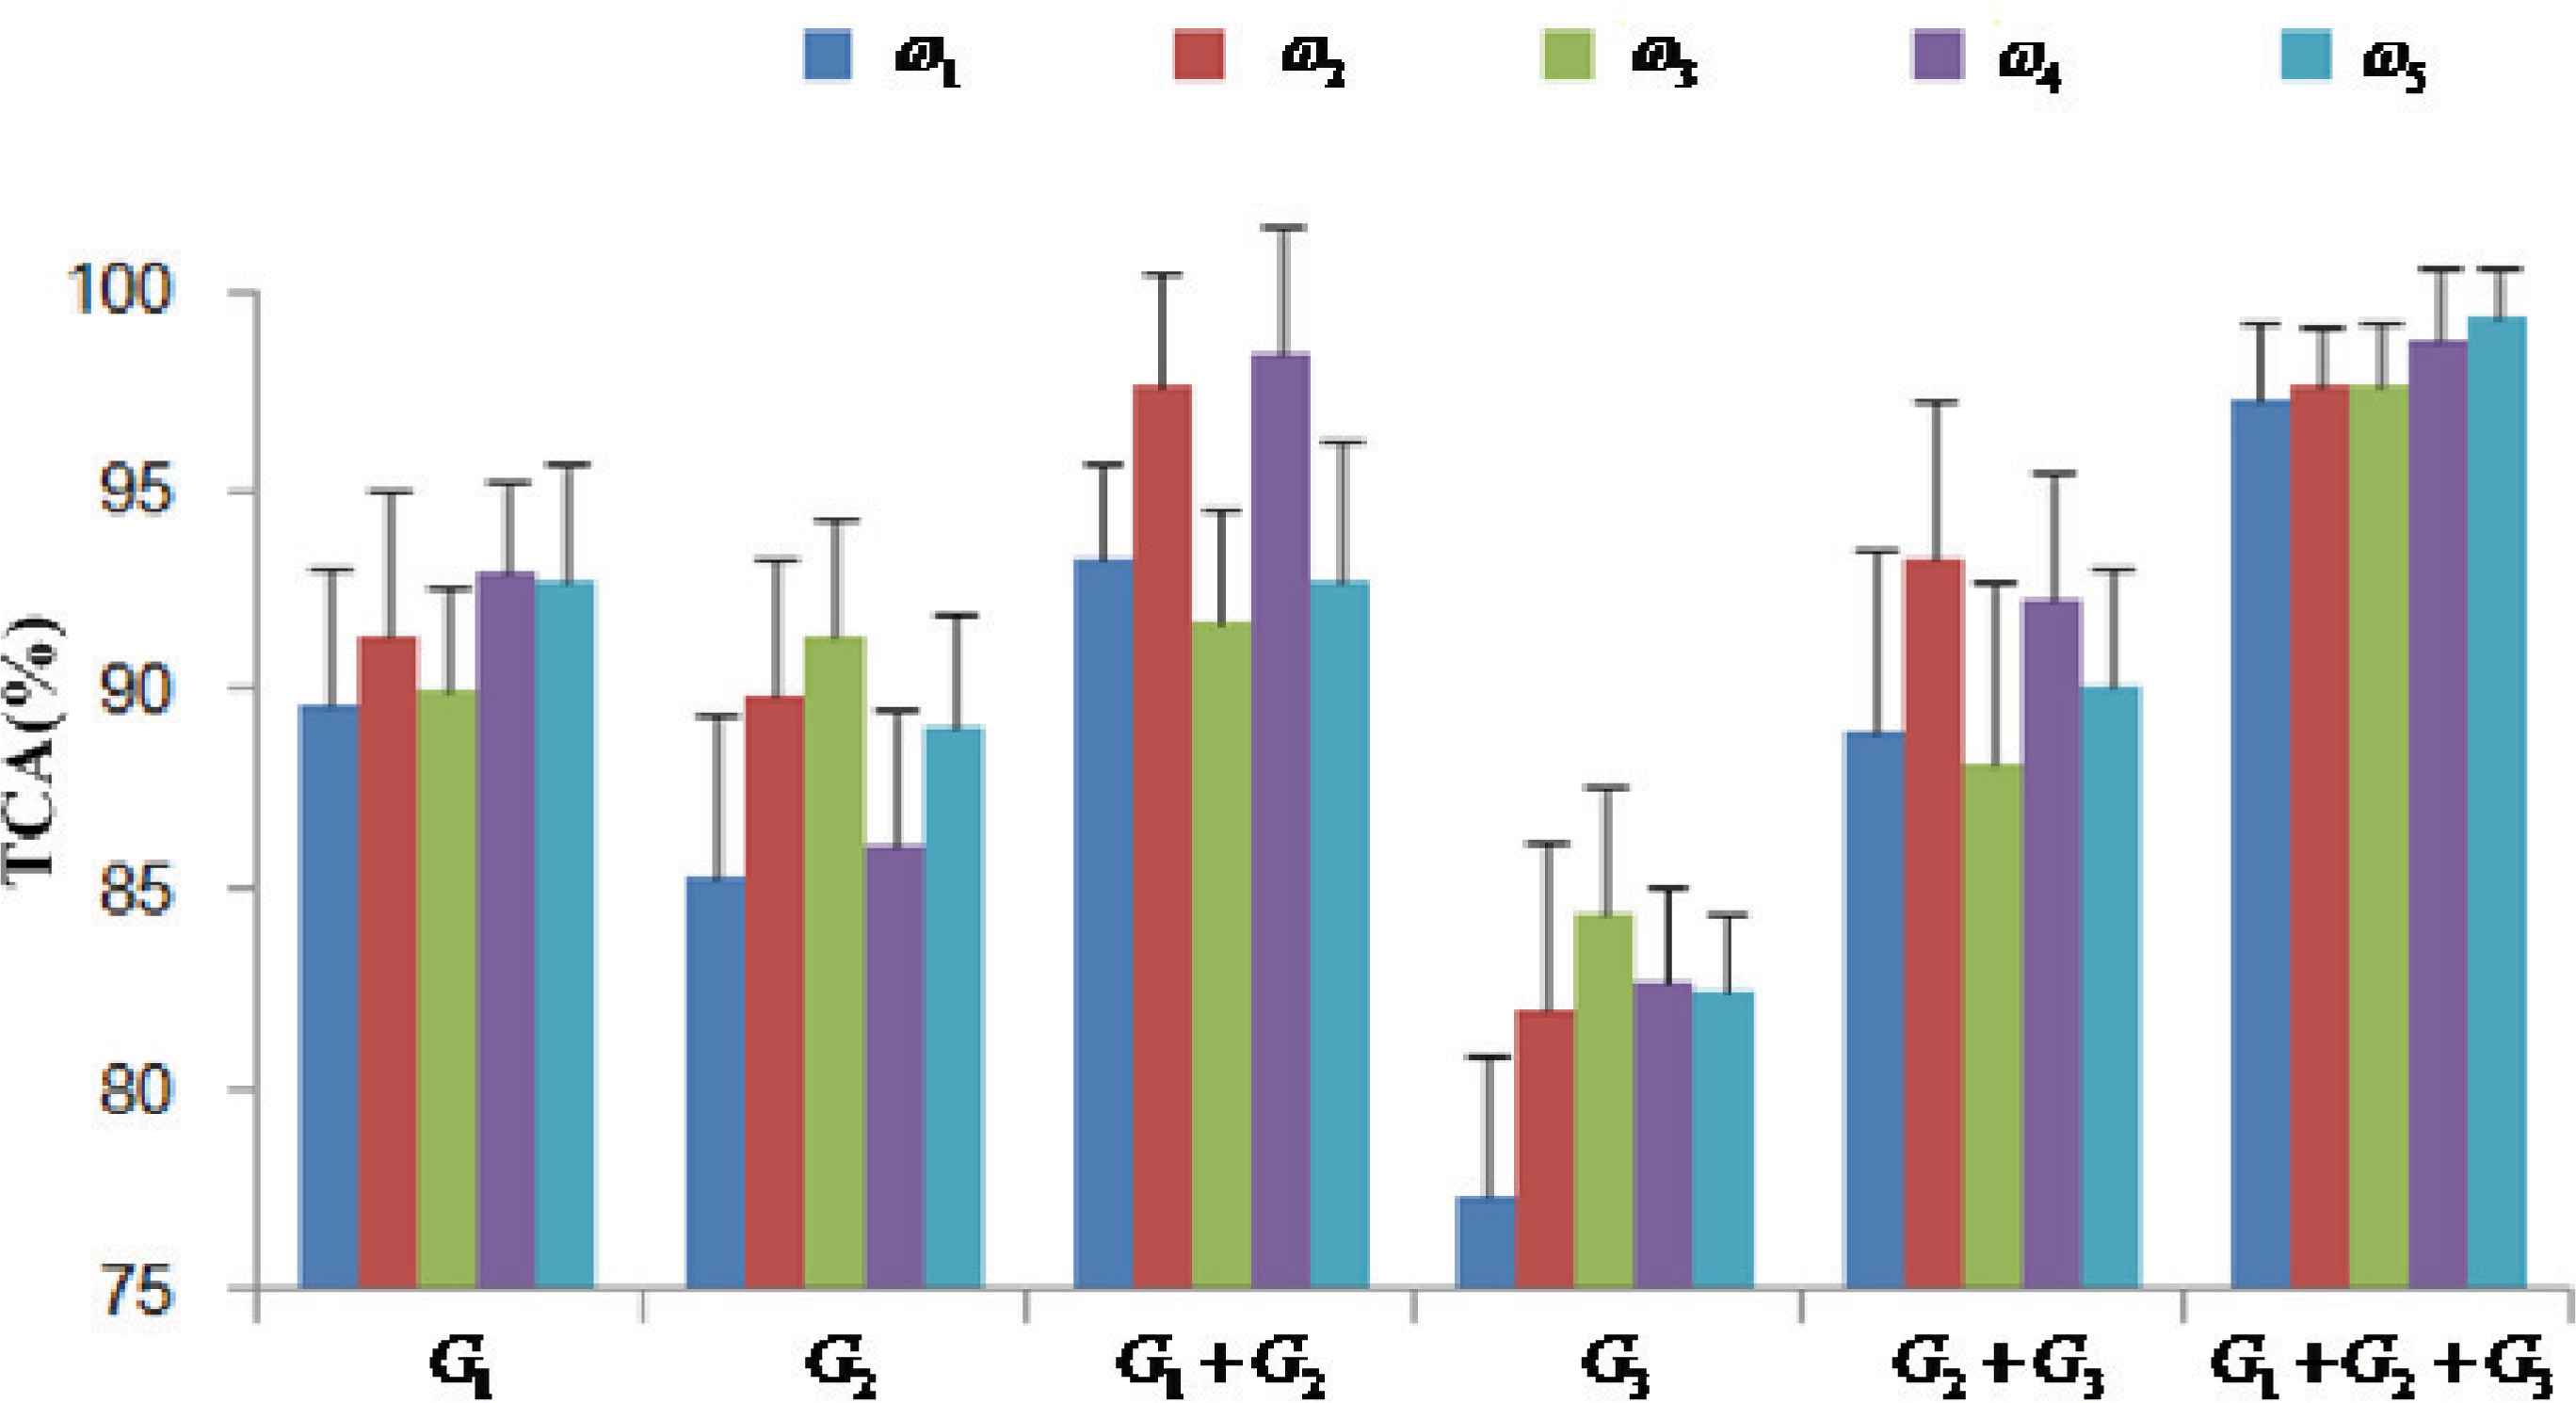
Total classification accuracies (TCA) of the rice processing-quality of 5 kind of rice with the WD statistical features and LS-SVM classifier
In terms of the result of TCA, when only using a single Gaussian derivative filter to identify the rice quality, G1 could get the best classification result, whose average accuracy is 91.238%, while the performance of G3 is relatively poor, whose average accuracy of the 5 varieties of rice in the repetitive experiments is only 81.788%.
If we combine all of the Gaussian derivative filters (G1 + G2 + G3), the total classification accuracy of the 5 varieties of rice would be higher than 97% in average. Besides the average of TCA (ATCA), the standard deviation of TCA (STDTCA) represents the stability of the classification performance. By comparing the STDTCA, the combination of first to three orders of Gaussian derivative filters ( G1 + G2 + G3) is a fairly stable rice image analysis method. The STDTCA regarding G1 + G2 + G3 filter is as low as 1.57 (%) in average for all 5-varieties of rice in the repetitive experiments, while the STDTCAs regarding G1, G2, G1 + G2, G3, G2 + G3 are 2.4(%), 3.2(%), 2.5(%), 4.2(%), 3.8(%) in average for all the 5-varieties of rice.
Besides the evaluation measure of TCA, more classification accuracy evaluation results can be find in Tab.2, where only the average value of the metrics of the 10 repeated experiments are provided. As can be seen from Tab.2, the evaluation metrics GM and F-measure by various combinations of the Gaussian derivative filters will achieve different performance. However, the same as TCA, the WD model parameter features with the full combination of the Gaussian derivative filters (G1 + G2 + G3) can achieve the best performance on no matter what kinds of rice based on the measures of GM and F-measure.
| Rice | feature | GM | F-measure |
|---|---|---|---|
| ω1 | G1 + G2 + G3 | 0.943 | 0.957 |
| G1 + G2 | 0.921 | 0.935 | |
| G1 + G3 | 0.914 | 0.920 | |
| G2 + G3 | 0.892 | 0.912 | |
| ω2 | G1 + G2+G3 | 0.946 | 0.975 |
| G1 + G2 | 0.931 | 0.936 | |
| G1 + G3 | 0.934 | 0.942 | |
| G2 + G3 | 0.901 | 0.912 | |
| ω3 | G1 + G2 + G3 | 0.948 | 0.962 |
| G1 + G2 | 0.911 | 0.923 | |
| G1 + G3 | 0.914 | 0.935 | |
| G2 + G3 | 0.921 | 0.934 | |
| ω4 | G1 + G2 + G3 | 0.947 | 0.972 |
| G1 + G2 | 0.925 | 0.946 | |
| G1 + G3 | 0.921 | 0.937 | |
| G2 + G3 | 0.914 | 0.932 | |
| ω5 | G1 + G2 + G3 | 0.963 | 0.987 |
| G1 + G2 | 0.931 | 0.936 | |
| G1 + G3 | 0.934 | 0.942 | |
| G2 + G3 | 0.897 | 0.922 | |
Evaluation measures of the classification results with the proposed WD model parameter features and iLS-SVM classifier
Combining the classification results of Fig.6 with Tab.2, it indicates that the proposed statistical modeling based image feature with the iLS-SVM classifier is an effective production-quality inspection method, especially with the combination filters of G1 + G2 + G3, which is also a stable rice-quality classification method with high classification accuracy and can effectively ensure the actual demand of automatic recognition of the rice quality in rice processing enterprise. Since the combination of three different orders of Gaussian derivative filters will achieve the best total classification accuracy, hereby we pay attention to the rice-image feature by the combined filters (G1 + G2 + G3).
(4) Performance comparison
In order to compare the performance of the proposed method with some other related methods, we selected some well known image-based rice quality classification. The related feature extraction methods are the gray level co-occurrence matrix (GLCM)[19], the gray level run length matrix (GLRM)[19] and Wavelet transform analysis method[20]. GLCM / GLRM extraction details are as follows:
- (a)
The image intensity is quantized to 8, 32 and 64 brightness levels;
- (b)
At each quantization scale, calculate the GLCM / GLRM matrix;
- (c)
Based on each GLCM / GLRM matrix, we extract in total of 14 statistics[19], e.g., energy, inertia moment, partial correlation, entropy, fineness, to constitute the spatial structural feature vector of the rice images.
The details of WTA feature extraction are as follows:
- (a)
Image colour space are transformed into HIS and CIE L*a*b* color spaces;
- (b)
In each independent colour space, we conduct multi-scale image decomposition using Db4 wavelet for rice image analysis, until the coarsest scale of the image size is not less than 8*8;
- (c)
In each decomposition scale, we calculate energy, colour covariance, etc. In total of 15 parameters[21] computed from the detail Wavelet decomposition coefficients.
In the comparative experiments, the classifier selection is another effect factor to the classification performance. Besides the proposed iLS-SVM based classifier, the commonly used learning vector quantization neural network (LVQ-NN)[22] based classifier is used for rice-quality classification experiment.
In each comparative experiment, the training and test samples used for five different kinds of rice are identical. The number of hidden layer of LVQ-NN is determined by the best classification performance through cross validation. Procedure of 10-fold cross-validation repeated 10 times is used in the comparative experiment. By the repetitive experiments with different training samples, we find that 24 hidden layer nodes could obtain the best recognition results. The classification results achieved by combination of different image features with different classifiers are displayed in Tab.3, where Gi still means the ith order Gaussian derivative filter.
| Rice | feature | classifier | TCA | GM | F-measure | Rice | feature | classifier | TCA | GM | F-measure |
|---|---|---|---|---|---|---|---|---|---|---|---|
| ω1 | G1 + G2 + G3 | LVQ-NN | 0.873 | 0.871 | 0.895 | ω4 | G1 + G2 + G3 | LVQ-NN | 0.914 | 0.901 | 0.890 |
| GLCM | iLS-SVM | 0.831 | 0.826 | 0.8420 | GLCM | iLS-SVM | 0.834 | 0.865 | 0.845 | ||
| GLCM | LVQ-NN | 0.824 | 0.765 | 0.802 | GLCM | LVQ-NN | 0.825 | 0.834 | 0.842 | ||
| GLRM | iLS-SVM | 0.825 | 0.822 | 0.836 | GLRM | iLS-SVM | 0.834 | 0.854 | 0.863 | ||
| GLRM | LVQ-NN | 0.835 | 0.834 | 0.856 | GLRM | LVQ-NN | 0.845 | 0.852 | 0.845 | ||
| WTA | iLS-SVM | 0.867 | 0.872 | 0.886 | WTA | iLS-SVM | 0.850 | 0.843 | 0.867 | ||
| WTA | LVQ-NN | 0.815 | 0.865 | 0.873 | WTA | LVQ-NN | 0.832 | 0.832 | 0.854 | ||
| GLCM+GLRM | iLS-SVM | 0.856 | 0.884 | 0.890 | GLCM+GLRM | iLS-SVM | 0.867 | 0.873 | 0.880 | ||
| GLCM+GLRM | LVQ-NN | 0.834 | 0.865 | 0.876 | GLCM+GLRM | LVQ-NN | 0.859 | 0.862 | 0.869 | ||
| ω2 | G1 + G2 + G3 | LVQ-NN | 0.902 | 0.901 | 0.914 | ω5 | G1 + G2 + G3 | LVQ-NN | 0.922 | 0.930 | 0.896 |
| GLCM | iLS-SVM | 0.845 | 0.834 | 0.845 | GLCM | iLS-SVM | 0.834 | 0.875 | 0.867 | ||
| GLCM | LVQ-NN | 0.821 | 0.823 | 0.838 | GLCM | LVQ-NN | 0.836 | 0.864 | 0.869 | ||
| GLRM | iLS-SVM | 0.801 | 0.812 | 0.824 | GLRM | iLS-SVM | 0.857 | 0.859 | 0.865 | ||
| GLRM | LVQ-NN | 0.798 | 0.835 | 0.856 | GLRM | LVQ-NN | 0.845 | 0.835 | 0.846 | ||
| WTA | iLS-SVM | 0.845 | 0.859 | 0.867 | WTA | iLS-SVM | 0.867 | 0.872 | 0.883 | ||
| WTA | LVQ-NN | 0.850 | 0.834 | 0.845 | WTA | LVQ-NN | 0.834 | 0.853 | 0.867 | ||
| GLCM+GLRM | iLS-SVM | 0.862 | 0.869 | 0.872 | GLCM+GLRM | iLS-SVM | 0.866 | 0.889 | 0.901 | ||
| GLCM+GLRM | LVQ-NN | 0.858 | 0.858 | 0.863 | GLCM+GLRM | LVQ-NN | 0.879 | 0.876 | 0.892 | ||
| ω3 | G1 + G2 + G3 | LVQ-NN | 0.897 | 0.886 | 0.879 | ||||||
| GLCM | iLS-SVM | 0.831 | 0.835 | 0.840 | |||||||
| GLCM | LVQ-NN | 0.834 | 0.845 | 0.842 | |||||||
| GLRM | iLS-SVM | 0.824 | 0.824 | 0.835 | |||||||
| GLRM | LVQ-NN | 0.815 | 0.826 | 0.847 | |||||||
| WTA | iLS-SVM | 0.825 | 0.846 | 0.858 | |||||||
| WTA | LVQ-NN | 0.840 | 0.850 | 0.872 | |||||||
| GLCM+GLRM | iLS-SVM | 0.857 | 0.865 | 0.845 | |||||||
| GLCM+GLRM | LVQ-NN | 0.870 | 0.854 | 0.872 | |||||||
Comparative results of rice quality classification with the combination of different image features and different classifiers
As can be seen from Fig.6, Tab.2 and Tab.3, the average TCA of the five rice-varieties by the proposed statistical feature (G1 + G2 + G3) can reach over 97% and 90% based on the iLS-SVM classifer and LVQ-NN classifier respectively. Whereas, the TCA based on the commonly-used features of GLCM, GLRM, WTA and GLCM+GLRM with iLS-SVM only achieves 83.5%, 82.8%, 85.1%, and 86.2%, however if we change the iLS-SVM classifier to the LVQ-NN classifier, there is no improvement of the TCA based on these features with LVQ-NN classifier, which can only achieve 82.8%, 82.7%, 83.4% and 86.2% accuracy rate. Hence, it can achieve much better classification performance (higher TCA) by the proposed statistical feature (G1 + G2 + G3), whether we use iLS-SVM classifier or the LVQ-NN classifier.
In terms of the classification accuracies of the different classes of samples, the best classification results can be achieved from the proposed statistical feature (G1 + G2 + G3) with iLS-SVM classifier. As can be seen from Tab.2 and Tab.3, the average GM and F-measure of the five rice-varieties is 0.949 and 0.976 based on the proposed statistical feature (G1 + G2 + G3) with iLS-SVM. And the average GM and F-measure based on the combination of the proposed statistical feature (G1 + G2 + G3) with LVQ-NN are much lower the proposed statistical feature with iLS-SVM classifier, they can only reach 0.898 and 0.895 respectively, which means the combination of the proposed statistical feature with iLS-SVM classifier can achieve better classifier accuracies both on the majority samples and the minority samples.
The combinations of the other commonly-used features, e.g, GLCM, GLRM, WTA, with the classifiers iLS-SVM and LVQ-NN, are generally inferior to the proposed statistical feature (G1 + G2 + G3) with iLS-SVM classifier. The average GM of the five rice-varieties based on the iLS-SVM classifier with the GLCM, GLRM, WTA and GLCM+GLRM feature can only achieve 0.847, 0.834, 0.858 and 0.876, whereas the average F-measures based on these features with LVQ-NN classifier are 0.826, 0.836, 0.846 and 0.863.
The average F-measure of the five rice-varieties based on the iLS-SVM classifier with the GLCM, GLRM, WTA and GLCM+GLRM features can only achieve 0.848, 0.845, 0.872 and 0.878, and the the average F-measure based on the LVQ-NN classifier with these commonly-used features are 0.839, 0.850, 0.862 and 0.874 respectively. Apparently, whether the iLS-SVM classifier or LVQ-NN classifier is used, the proposed statistical feature G1 + G2 + G3 is superior to the commonly used feature extraction methods for rice-quality classification.
Combined the experimental results in Fig.6, Tab.2 and 3, it can be seen apparently that the proposed method, WD model features with the improved LS-SVM classifier, achieves much higher classification accuracy with stable results both on the positive samples and the negative samples, which can be effectively applied to the intelligent rice quality inspection in the assembly production line.
5. Conclusions
This work presents an image statistical modelingbased method for automated rice quality inspection. We have analyzed the WD distribution process theoretically of the spatial structure of the complex grain images, which comprised of a large number of local homogeneous particles or fragmentations without obvious foreground and background. A kind of multiscale and Omnidirectional Gaussian derivative filtering method is proposed to obtain the spatial structures of the grain images. And the WD model parameters of the filtering responses are achieved for grain image feature characterization. An improved LS-SVM classifier was employed to rice processing-quality classification with the extracted image features based on the statistical model. The experiments demonstrate that the proposed method can effectively describe the characteristic of the complex grainy images and possesses a high accuracy for rice quality classification, which effectively ensured the intelligent classification of high-quality rice and automatic packing in the assembly line rice production line.
Acknowledgments
This work is supported by the National Natural Science Foundation of China under grant Nos.61501183, 61563015, 61472134, and 61272337, the Young Teacher Foundation of Hunan Normal University under Grant Number 11405, the Science and Technology Planning Project of Hunan Province of China under Grant Number 2013FJ4051 and Scientific Research Foundation of Educational Commission of Hunan Province of China under Grant Number 13B065.
References
Cite this article
TY  - JOUR
AU  - Jinping Liu
AU  - Zhaohui Tang
AU  - Qing Chen
AU  - Pengfei Xu
AU  - Wenzhong Liu
AU  - Jianyong Zhu
PY  - 2016
DA  - 2016/01/01
TI  - Toward Automated Quality Classification via Statistical Modeling of Grain Images for Rice Processing Monitoring
JO  - International Journal of Computational Intelligence Systems
SP  - 120
EP  - 132
VL  - 9
IS  - 1
SN  - 1875-6883
UR  - https://doi.org/10.1080/18756891.2016.1144158
DO  - 10.1080/18756891.2016.1144158
ID  - Liu2016
ER  -