
Identification of Pulmonary Disorders by Using Different Spectral Analysis Methods
- DOI
- 10.1080/18756891.2016.1204110How to use a DOI?
- Keywords
- Artificial Neural Network; Classification Accuracy; Feature Extraction; Power Spectrum Density; Spectral Analysis
- Abstract
This study presents detection of pulmonary disorders using different spectral analysis methods such as fast Fourier transform, autoregressive and the autoregressive moving average. Power spectral densities of the sounds were estimated through these methods. Feature vectors were constructed by extracting statistical features from the PSDs. Created feature vectors were used as inputs into the artificial neural networks. Then performances of spectral analysis methods were compared according to classification accuracies, sensitivities and specificities. In this aspect, the study is a comparative study of different spectral analysis methods.
- Copyright
- © 2016. the authors. Co-published by Atlantis Press and Taylor & Francis
- Open Access
- This is an open access article under the CC BY-NC license (http://creativecommons.org/licences/by-nc/4.0/).
1. Introduction
Respiratory sounds also are known lung or pulmonary sounds produced by the lungs due to changing rate of airflow during inhalation and exhalation can indicate problems within the lungs [1]. The sounds are divided into two classes as normal sounds and adventitious sounds [2, 3]. Respiratory sounds of healthy people are considered as normal breath sounds. The normal breath sounds are associated frequency ranges of 100Hz–1000Hz and they are devoid of any discrete peaks [1]. Adventitious sounds are abnormal sounds and generally signify a kind of respiratory disorder [1]. This type of sounds is divided into two main classes, wheeze and crackle [3]. The frequency of wheezes lies within 100Hz and 2500 Hz [4] with a dominant frequency between 100 Hz and 1000 Hz [4]. According to American Thoracic Society (ATS) wheezes have a dominant frequency greater than 400 Hz [5, 6].
The frequency ranges of crackles are between 100Hz and 2000 Hz [4].
Respiratory sounds are effective indicators of pulmonary disorders. These sounds are obtained by chest auscultation during both inhalation and exhalation. Listening to the sounds of the body through the stethoscope is referred auscultation. Because of cheapness and effectiveness of this method, it is most widely used diagnostic method in the world. However, diagnosing of respiratory disorders by auscultation has some disadvantages depending on doctors, their education, their hearing sensitivity, their skills, their tiredness, their thoughtfulness etc. Also the response of stethoscope and ambient noise influence auscultation findings [7].
Because of advanced technological developments in computer and electronic environments, it is possible to process sound-based signal reliably in different pulmonary conditions. Computer-based respiratory sound analysis contains recording the patient’s respiratory sounds by an electronic device, followed by analysis of respiratory sound signals with signal processing techniques and classification of respiratory sounds according to their specific characteristics [4].
In the literature many researches and studies focus on respiratory sound classification with respect to pulmonary conditions. Most crucial step during classification is to select useful features of sounds [8]. Therefore, determination of the analysis and feature extraction methods to be used in the study is very important.
Frequency distribution of respiratory sounds gives considerable diagnostic information [1]. As we mentioned in the first paragraph, sounds such as wheeze, crackles and the others that cause disease are placed at certain frequency intervals, and this different distribution characterize respiratory sounds. That’s why, the frequency distribution is an important feature for classification of respiratory sounds [8]. The literature search has shown that spectral analyses techniques have been increasingly used to provide information about the frequency components of the signal. The Fourier transforms (FT) are the most commonly used techniques for spectral analysis of respiratory sounds as feature extraction methods [9–17]. Forkheim et al. [9] computed 1024-point fast Fourier Transform (FFT) and then calculated FT spectrum for wheeze detection. Wheeze and non-wheeze respiratory sounds were represented these FT spectrums. When a back propagation network was trained with features consisted of FT spectrums, the overall classification rate on the test sets was obtained as 91.5%. Rietveld et al. [10] calculated power spectrums of respiratory sounds through FT. They classified so-obtained a set of spectral vectors into 3 classes by means of artificial neural networks. Researches obtained good results with supervised networks: as much as 95% of the training vectors could be classified correctly, and 43% of the test vectors. Güler et al. [12] calculated a 256-point Power Spectrum Density (PSD) as features using FT. They classified these features to predict the presence or absence of adventitious sounds. Correct classification rates of all lung sound signals range between %83 and 93%. In the majority of studies [9–15], the binary cases such as healthy versus pathological or normal versus abnormal sounds classifications has been considered [18]. As well as Fourier transform, autoregressive (AR) and autoregressive moving average (ARMA) models are commonly used in many studies [2, 19, 20, 21] for spectral analysis.
Most of the literature studies adopted two-class structure as healthy and pathological. Multiple classifications of respiratory sounds associated with different pulmonary conditions are very limited in the literature.
This paper presents the importance of the feature extraction step using various spectral analysis methods used in different studies. In this study, FFT, AR and ARMA spectral analysis methods were used to extract features from respiratory sounds associated with 6 pulmonary conditions. In the first stage of the study, the recorded and filtered sounds were partitioned into segments that include a respiratory cycle. Subsequently, each cycle was divided into inhalation and exhalation phase. In the feature extraction stage of the study power spectral densities (PSD) of inhalation and exhalation sound signals were estimated using AR, ARMA and FFT techniques and feature vectors consisted of the PSD values were obtained. And then, statistical properties were selected on PSD values to reduce the size of feature vectors. In the classification stage of the study selected statistical features were used as the inputs of artificial neural networks (ANN).
In this study, ANN with back-propagation learning algorithm was used for the purpose of classification of inhalation and exhalation sounds as normal and five different pulmonary disordered sounds. In this aspect, this study represents multi class structure on respiratory sounds related to different pulmonary conditions. Also this study is a comparative study of different spectral analysis methods based on classification accuracy, specificity and sensitivity. In the following sections of study, classification results of respiratory sounds are obtained for each spectral analysis method, and these results are compared.
2. Materials and Methods
2.1. Acquisition of Respiratory Sounds
Sound signals belonging to 15 individuals who had severe asthma, moderate asthma, mild asthma, chronic obstructive pulmonary disease (COPD), hypersensitivity pneumonitis (HP), and the normal subjects were recorded from the right and left part of chest separately. To prevent sounds coming from ambient, sound recording process was carried out in the laboratories of the College of Medicine at University of Gaziantep. Sony ECM T150 microphone with an air capsule was used to record sounds [8]. The working method of the microphones can be one or all directions. The microphone used in this study is one direction. It was mounted onto the stethoscope head to get standard and valuable sound [8]. Its impedance is 2.2 kΩ. Response bandwidth is between 30-15000 Hz. The sampling rate is 8 kHz and 16 bits. The duration of the recorded sounds varies between 10 and 14 second.
Recording respiratory sounds are not completely distinguishable due to combination of noise sources such as heartbeat, muscle movements, and other sounds not associated with respiration. According to literature studies, heart sounds, muscle sounds and frictional noise constitute low frequency range below 100Hz. Furthermore, sounds which have frequency components above 2000Hz are not carry important information about the respiratory sounds. In accordance with this information, we can say that respiratory sounds have considerable frequency components between 100Hz and 2000Hz frequency bands. Therefore, irrelevant frequency components should be filtered.
In the pre-processing stage of this study, the respiratory sound signals were filtered with high pass filter at 100 Hz (to eliminate muscle sounds, heart sounds and frictional noise), and low pass filter at 2000 Hz (to avoid aliasing).
When we examine the literature studies about the respiratory sounds, we have seen that Bessel high pass filter and Butterworth low pass filter are often used to filter respiratory sounds. For example, Pasterkamp and coworkers (1996) [22] utilized a 6th order Butterworth low pass filter with cut off frequency of 2400Hz. Broersen and de Waele (2000) [23] used a 4th order Bessel band pass filter with cut off frequencies of 100Hz and 1500Hz. Güler et al. (2005) [21] filtered out heart sounds and frictional sounds using a sixth-order Bessel Filter. Similarly eight-order Butterworth filter with flat passband characteristics was used as anti-aliasing filter. Sen and Kahya (2003) [24] used Bessel high pass filter (6th order) and Butterworth low pass filter (8th order). Yeginer et al. (2009) [25] also used sixth order Bessel high-pass filters and eighth order Butterworth low-pass filters in order to minimize heart sound interference and frictional noise with minimal phase distortion and to prevent aliasing. Due to the widespread use of these filters, 6th order Bessel high pass filter and 8th order Butterworth low pass filter were used in this study.
After the filtering process, pre-processing stage was continued with segmentation of respiratory sounds. Since the each of sound samples contains a varying number of respiratory cycles, each sound signal was segmented into a small duration of one complete cycle of respiration. And then every cycle was separated as inhalation and exhalation sound signals according to the start and end times of inhalation and exhalation phases. The start and end times of phases as milliseconds were determined by utilizing audacity tool. Audacity is multi-track audio editor and recorder. This tool can be accessed free on the web. After the start and end times of phases were determined, respiratory sound cycles were divided into inhalation and exhalation using Matlab software package. In this way, each segment contained one inhalation or exhalation phase.
As a result of the segmentation of the sounds belonging to 15 people with different pulmonary conditions, sound segments which of amounts are mentioned in the following list were obtained.
- ✓
67 right basal inhalation sound segments
- ✓
67 right basal exhalation sound segments
- ✓
70 left basal inhalation sound segments
- ✓
70 left basal exhalation sound segments
Every sound segment was evaluated and processed as a separate pattern.
Distributions of the respiratory sound segments according to 6 pulmonary conditions are as shown Fig. 1.
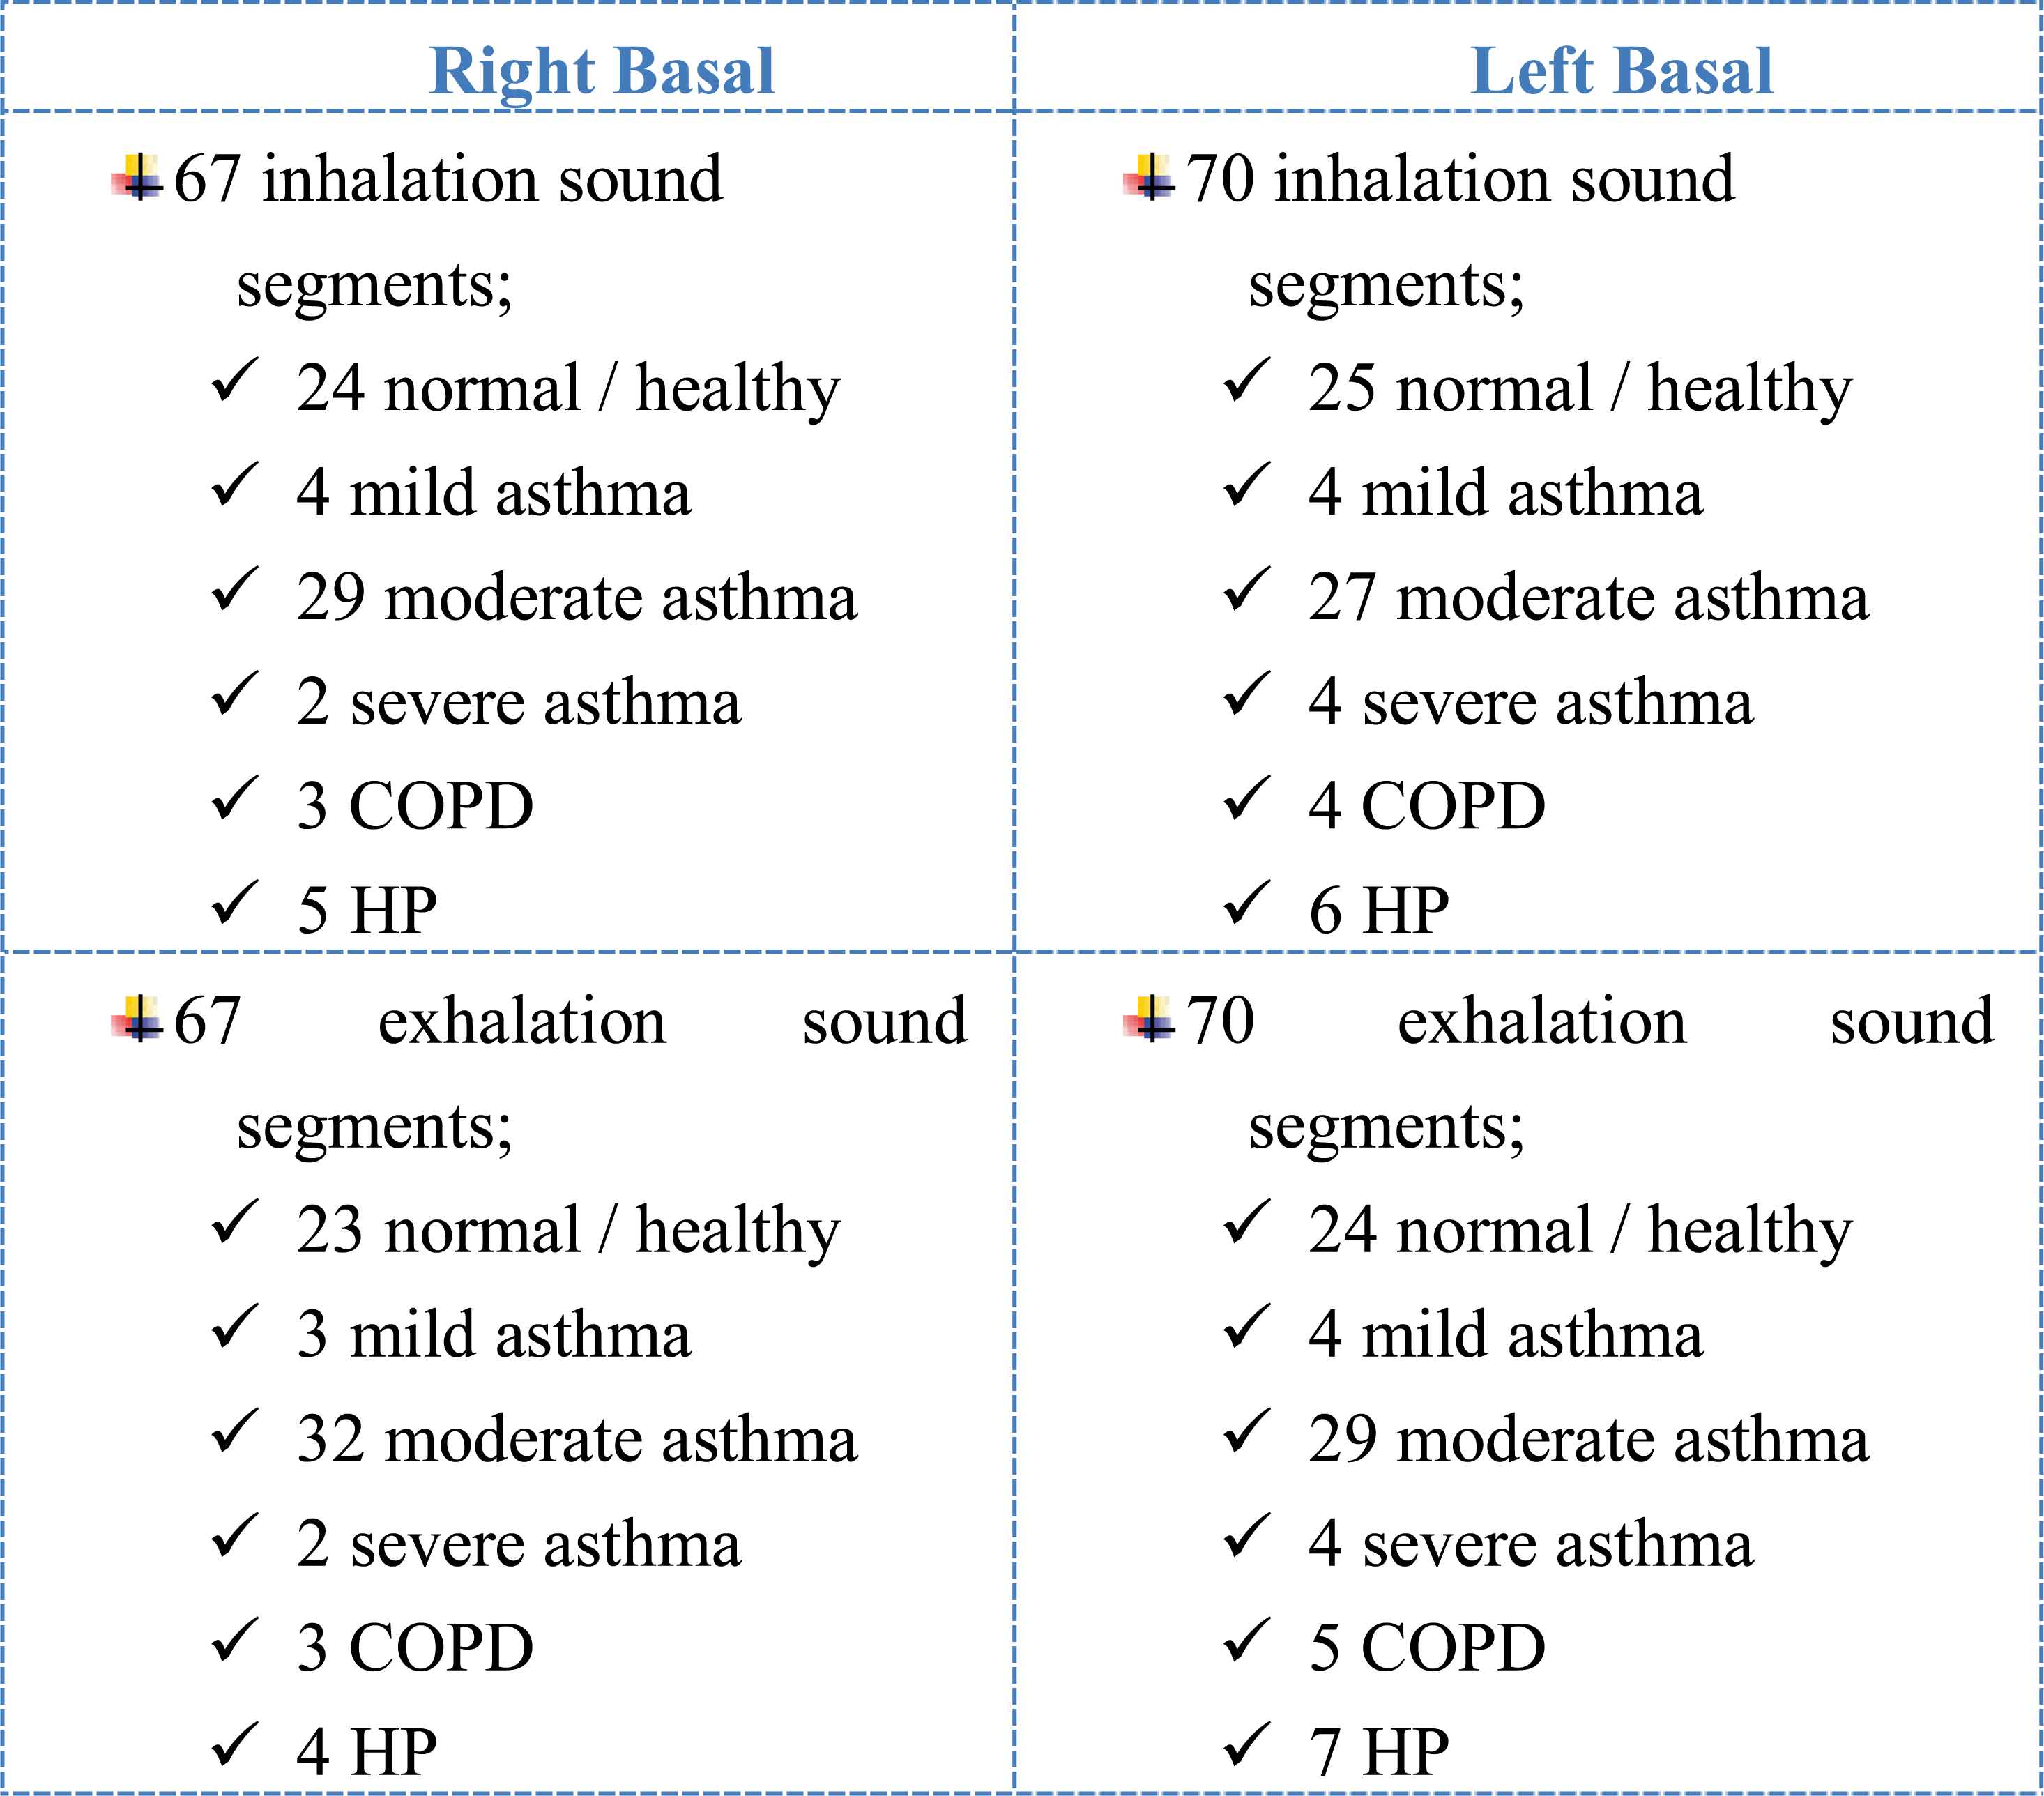
Distribution of the lung sound segments according to 6 pulmonary conditions.
Following the pre-processing stage, frequency spectra of sound segments were obtained by using spectral methods such as FFT, AR, ARMA.
2.2. Used Feature Extraction Methods
Feature extraction is a special form of dimensionality reduction [8]. Along with the feature extraction process, high dimensional vectors are converted into lower dimensional vectors. It is a mapping f: RH→RL, where L<H. In the feature extraction process, characteristics of the signal with a small data rate are captured [4].
Frequency components, their distribution and power information at various frequencies are numerous characteristic features for sound signals. To represent the frequency characteristics of sound signals, generally power spectra of signals are estimated [26]. For a given signal, the power spectra give the distribution of the signal power among various frequencies.
The most common way of generating power spectra is to use spectral analyses techniques. For this reason, we used different spectrum analysis methods namely AR, ARMA and FFT in this study. Detailed information about these techniques is given in this section.
Welch method is a FFT based technique used to estimate the power of signal at various frequencies. Spectral estimation through Welch based on the definition of periodogram method [12]. Calculation of PSD with this method is carried out averaging modified periodograms from overlapped and windowed segments [27].
In this method, a signal s(n), of length N samples, is divided into K data segments of length M, overlapping by D points. The ith segment si is defined as following Eq. (1) [27].
If the finite-length signal such as signal with N samples is considered, the spectrum of this signal generally exhibits side lobes and spectral leakage due to discontinuities at the end points [27]. Well, what are the leakage and discontinuities? More importantly, how they are prevented?
The FFT-Welch method assumes that the signal is infinite. That is, signal is exactly repeated throughout all time [28]. As a result of this assumption, signal is periodic at intervals that correspond to the length of the time record [28]. For example, we suppose that our input is a single cycle of a sine wave. FFT-Welch method will actually see it as an endless repetition of that sine wave. The resulting spectrum contains just a single spike or main lobe at the signal’s frequency. Fig. 2 illustrates this situation.
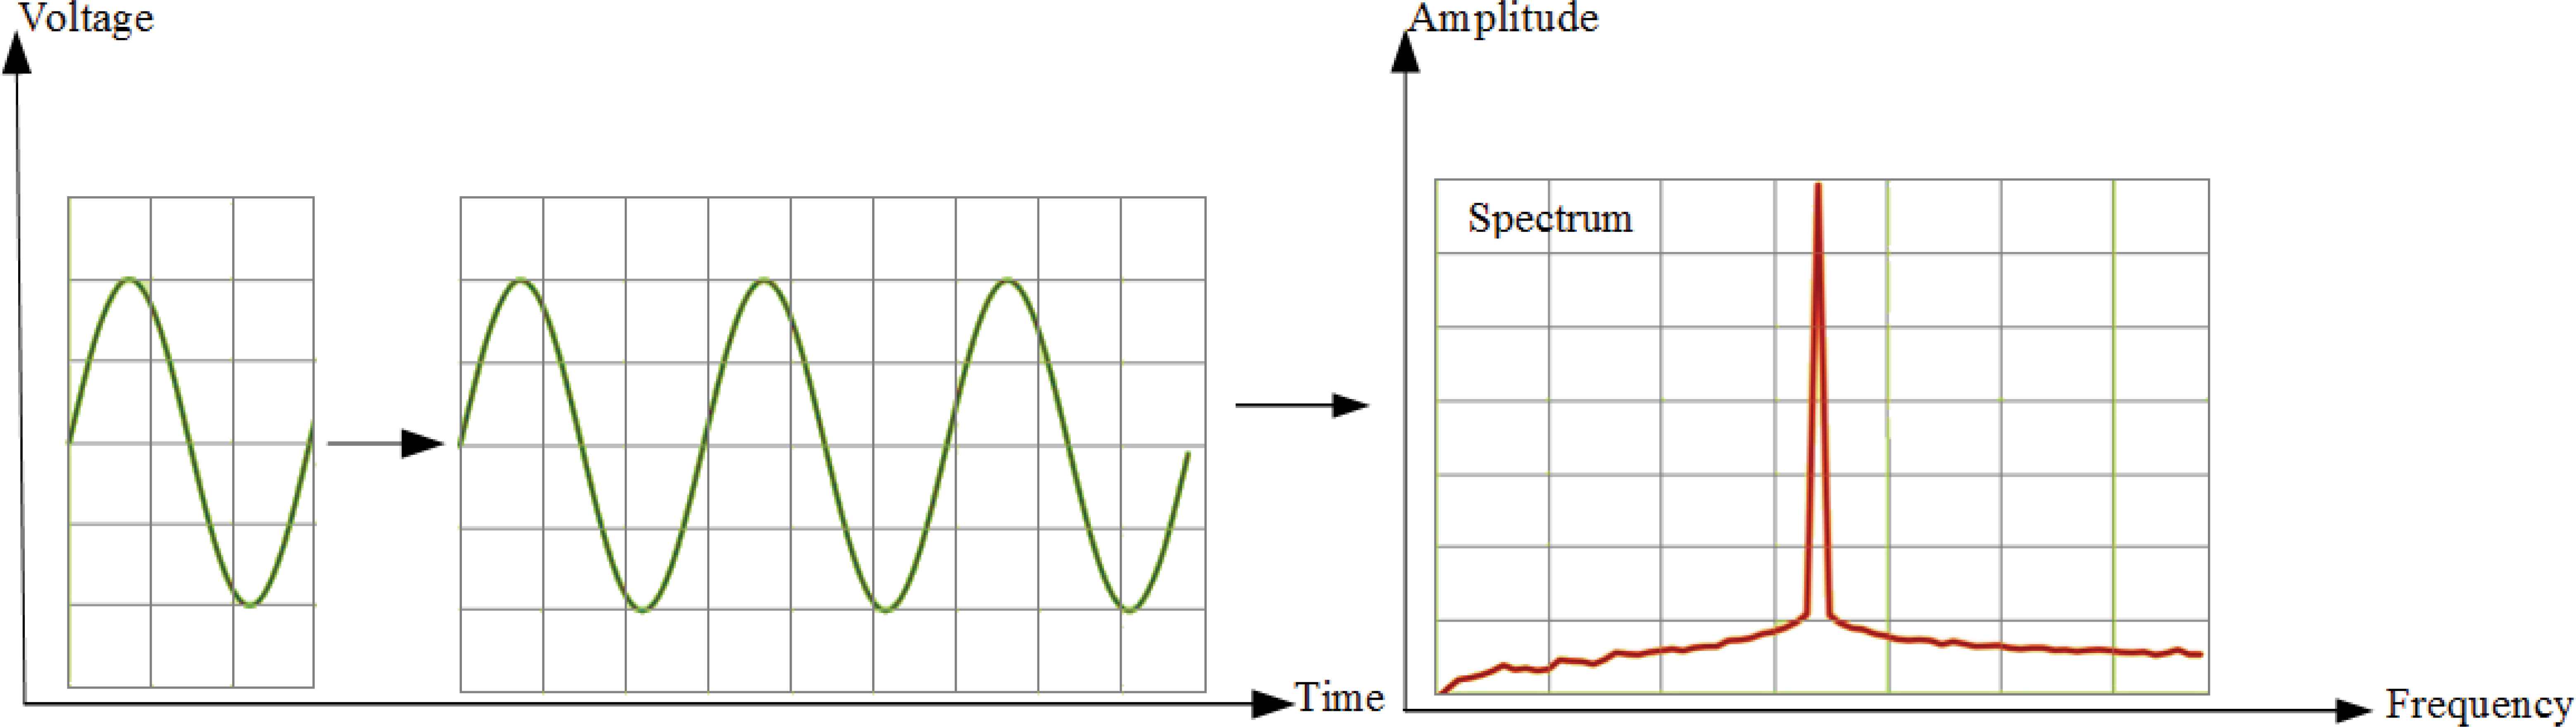
Single cycle of sine wave, infinite cycles of a sine wave and its spectrum
But we assume that our signal is a partial cycle of a sine wave. In this case, signal is not periodic. The FFT-Welch method will see this as a signal that jumps straight from the maximum value to zero, repeatedly. In this case, discontinuities occur in the signal and spectrum of this signal is different than single spike. In the spectrum of it, the peak gets smeared out across the frequency domain and noise floor rises up. Even, noise may obscure other frequencies that are present in the signal. Fig. 3 shows partial cycle of sine wave, sine wave with discontinuity and its spectrum.
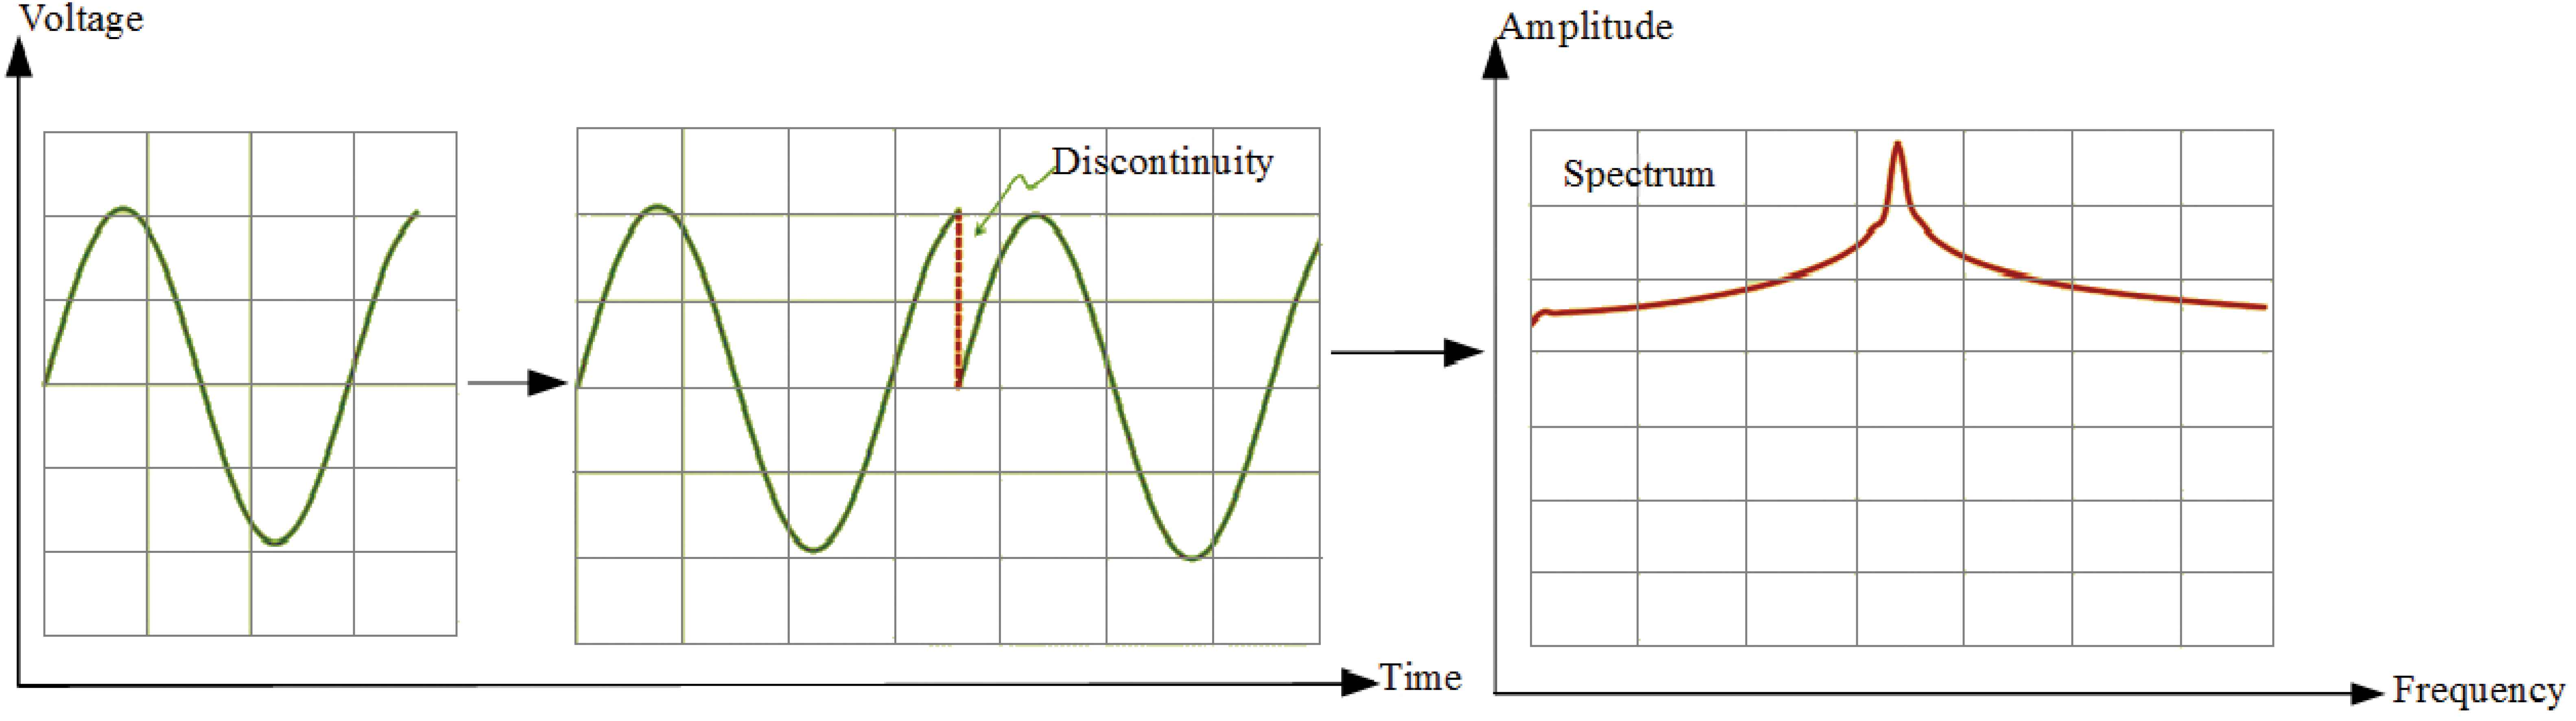
Partial cycle of sine wave, sine wave with discontinuity and its spectrum
For the coherent nice spectrum as Fig. 2, measured signal is should be periodic. Also this signal should have integer number of periods [28]. However, generally, the measured signal isn’t an integer number of periods. For the FFT-Welch, it means that this signal is discontinuous. In the spectrum of discontinuous signal, spectral leakage and side lobes are seen.
Spectral leakage distorts the measurement in such a way that energy from a given frequency component is spread over adjacent frequency lines or bins [28]. It causes of the fine spectral lines to spread into wider signals.
The effects of performing an FFT over a non-integer number of cycles can be minimized by using a technique called windowing [28]. The discontinuities are alleviated and the spectral leakage are minimized by the window function w(n) [27]. A window function alters signal, tapering it to nearly zero at the beginning and end. Therefore, in the welch method; each segment is windowed prior to computing the modified periodogram [27]. That is, we select data window w(n), n=0,…,M-1, and form the sequences s1(n)w(n),…,sK-1(n)w(n).
After the windowing operation, for the ith windowed segment, the modified periodogram is calculated using Eq. (2) [26].
In Eq. (2), P(w, i) is the modified periodogram of ith windowed segment, w(n) is the window function and U is the power in the window function. U is defined as Eq. (3) [27].
As shown in Eq. (4) [27], the Welch power spectrum is the average of the K-modified P(w, i) periodograms that were obtained from the overlapped and windowed segments of a signal [27].
Power spectrum estimation using the FFT method is relatively simple, well understood and easy to compute. This method is also fast [29].
The parametric (model-based) methods are also commonly used for spectral estimation. AR and ARMA are the best known of these for spectral analysis of breath sounds. They provide good frequency resolution. Also, they avoid the problems caused by FFT method [29]. However, selection of order is very important in these methods [29]. If a model with too low order is chosen, highly smoothed spectrum is obtained. If order of model is selected too high, we faced with the risk of spurious low-level peaks in the spectrum [29].
Basic idea of the parametric spectral estimation is shown Fig. 4.
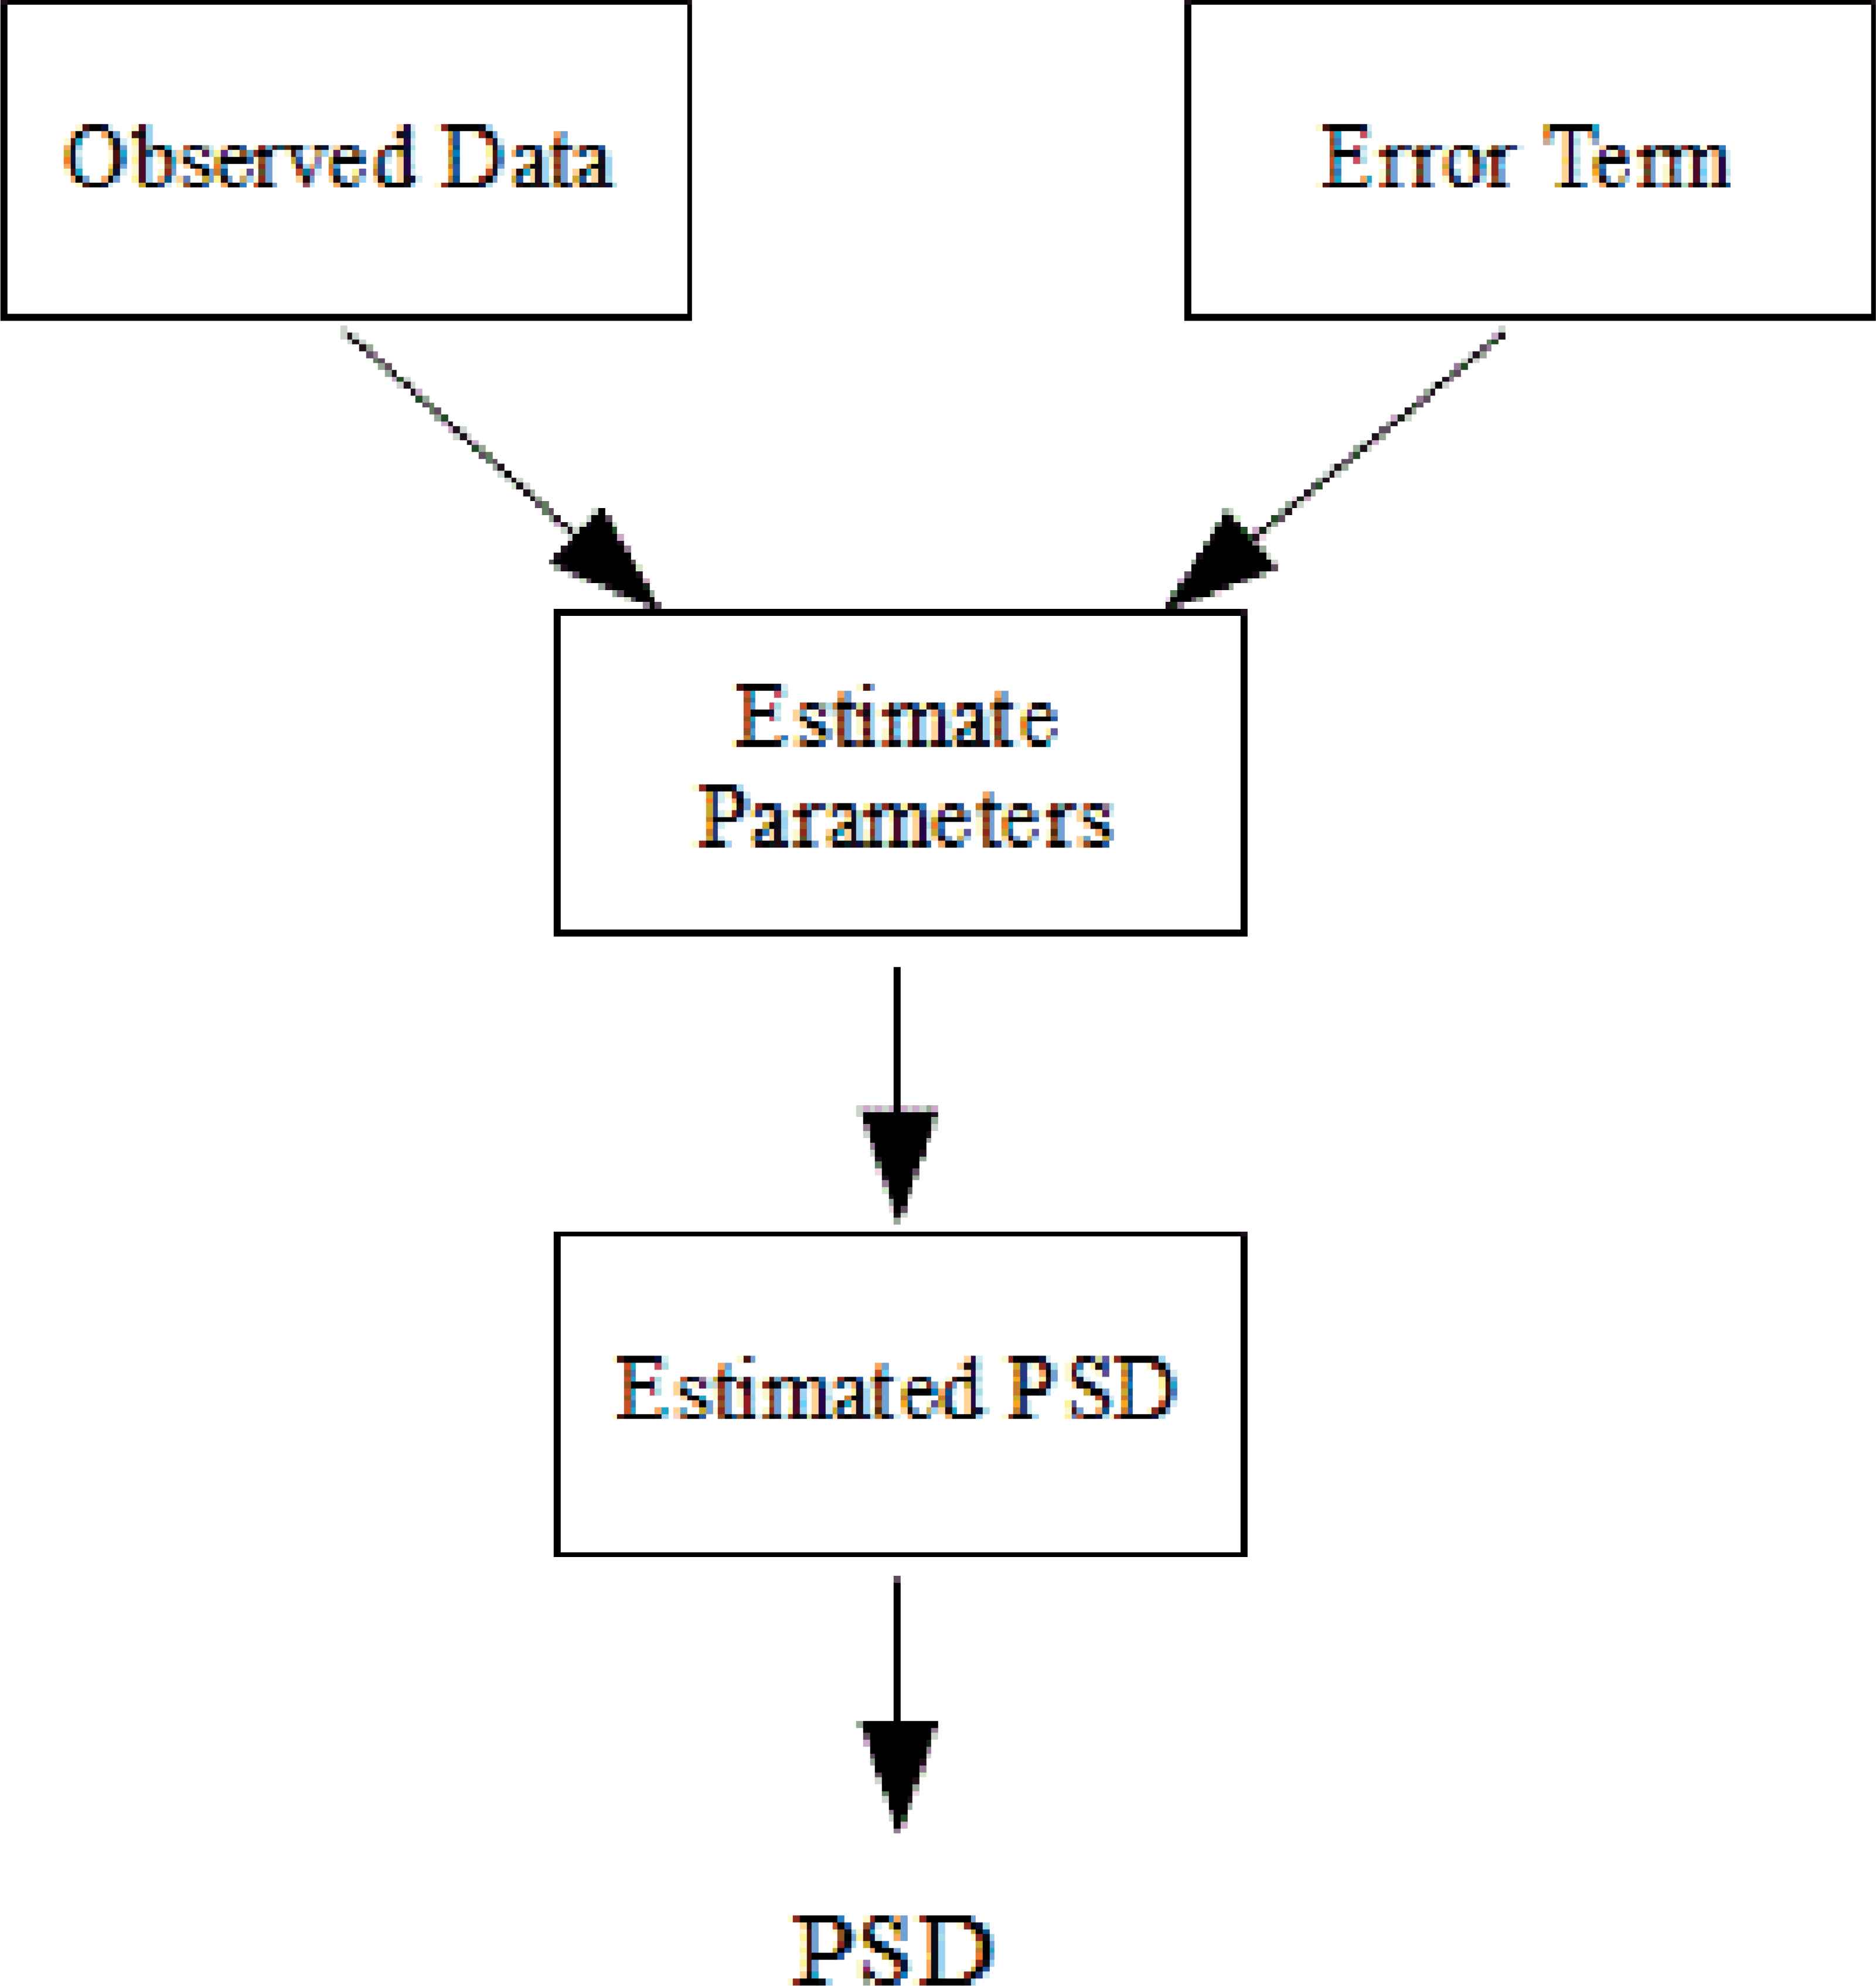
Block diagram of parametric spectral estimation
The AR model is an infinite impulse response filter or an all pole filter [29] and is named according to the number of observations in past periods. AR (p) model can be defined by AR parameters {a (1), a (2)… a (p)} and white noise pw. There are several algorithms to estimate parameters of AR such as burg, yule walker.
PSD of AR methods is obtained basically from following Eq. (5) and Eq. (6).
In Eq. (5), pw refers to white noise variance to scale the returned PSD. In the same equation, T means that interval in seconds to scale the returned PSD.
In Eq. (6), A(p) is referred AR model of degree p.
The power spectrum estimation is carried out by the Burg algorithm as in Eq. (7).
Where êp represents the total least square error and it is the sum of the forward and backward prediction errors.
ARMA model is a combination of both AR and moving average (MA) model. ARMA(p,q) method can be defined ARMA parameters { a(1), a(2), …, a(p),b(1),b(2), …,b(q)} and white noise pw. PSD of this model is obtained by filtering unit variance noise with a filter having both poles and zeros [29]. PSD of ARMA model is expressed by Eq. (8) and Eq. (9). B(q) is the MA model of degree q.
AR model is suitable for signals that have sharp peaks. MA model is suitable for signals that have not sharp peaks. The ARMA model is suitable for both types of signals. Sounds have sharp peaks. Therefore, use of AR and ARMA models are more appropriate than MA model for sound signal analysis. AR model is more advantageous than ARMA model in terms of mathematical computing density [29].
One of the most important aspects of the use of AR and ARMA methods is the selection of the model orders. Since inhalation and exhalation phases show different characteristics, separate AR-Burg models were applied to each phase in this study. Changing order values were tried for AR and ARMA models and the order values that produce the highest classification accuracy were chosen. While the order of the AR-Burg model was set as 9 for inhalation phases of right basal, it was set as 14 for exhalation phases of same basal. Orders of AR-Burg which are applied to left basal inhalation and exhalation phases were determined respectively as 22 and 16. Orders of ARMA model used in this study are shown following expressions.
p, q order values of ARMA model;
- ✓
Inhalation sounds of right basal: 21, 20
- ✓
Exhalation sounds of right basal: 14, 13
- ✓
Inhalation sounds of left basal: 25, 24
- ✓
Exhalation sounds of left basal: 27, 26
Power spectrum densities of partitioned sound signals were found through AR-Burg’s method, ARMA method and FFT-Welch method in a Matlab software package.
nfft parameter is crucial for FFT-Welch, AR-Burg and ARMA matlab functions because its value determines the size of the feature vectors. Well, what is the nfft parameter? This parameter refers to the number of FFT points used to calculate the PSD estimate. That is, nfft is the length of FFT and it determines size of PSD. Assuming that the value of length of FFT (nfft) is L, there are (L/2)+1 points in the PSD.
So, how this parameter determines size of feature vectors? In this study PSDs were considered feature vectors of sounds. If we decide that how many points are there in PSD, we determine size of our feature vectors. According to results of experimental studies, we decided that PSDs with 513 points should be obtained as feature vectors in this study. For this reason, value of nfft parameter was determined as 1024.
2.3. Feature Extraction of Respiratory Sounds
In this paper, AR-Burg, ARMA, FFT-Welch methods were applied to each of the inhalation and exhalation sound segments for power spectral density (PSD) estimation. Vectors which consist of value of these PSD were obtained as features of sounds. Fig. 5 shows PSDs of normal healthy person’s inhalation and exhalation sound segments.

PSDs of inhalation and exhalations sound segments belonging to healthy person
Fig. 6 indicates PSDs of asthmatic patient’s inhalation and exhalation sound segments.
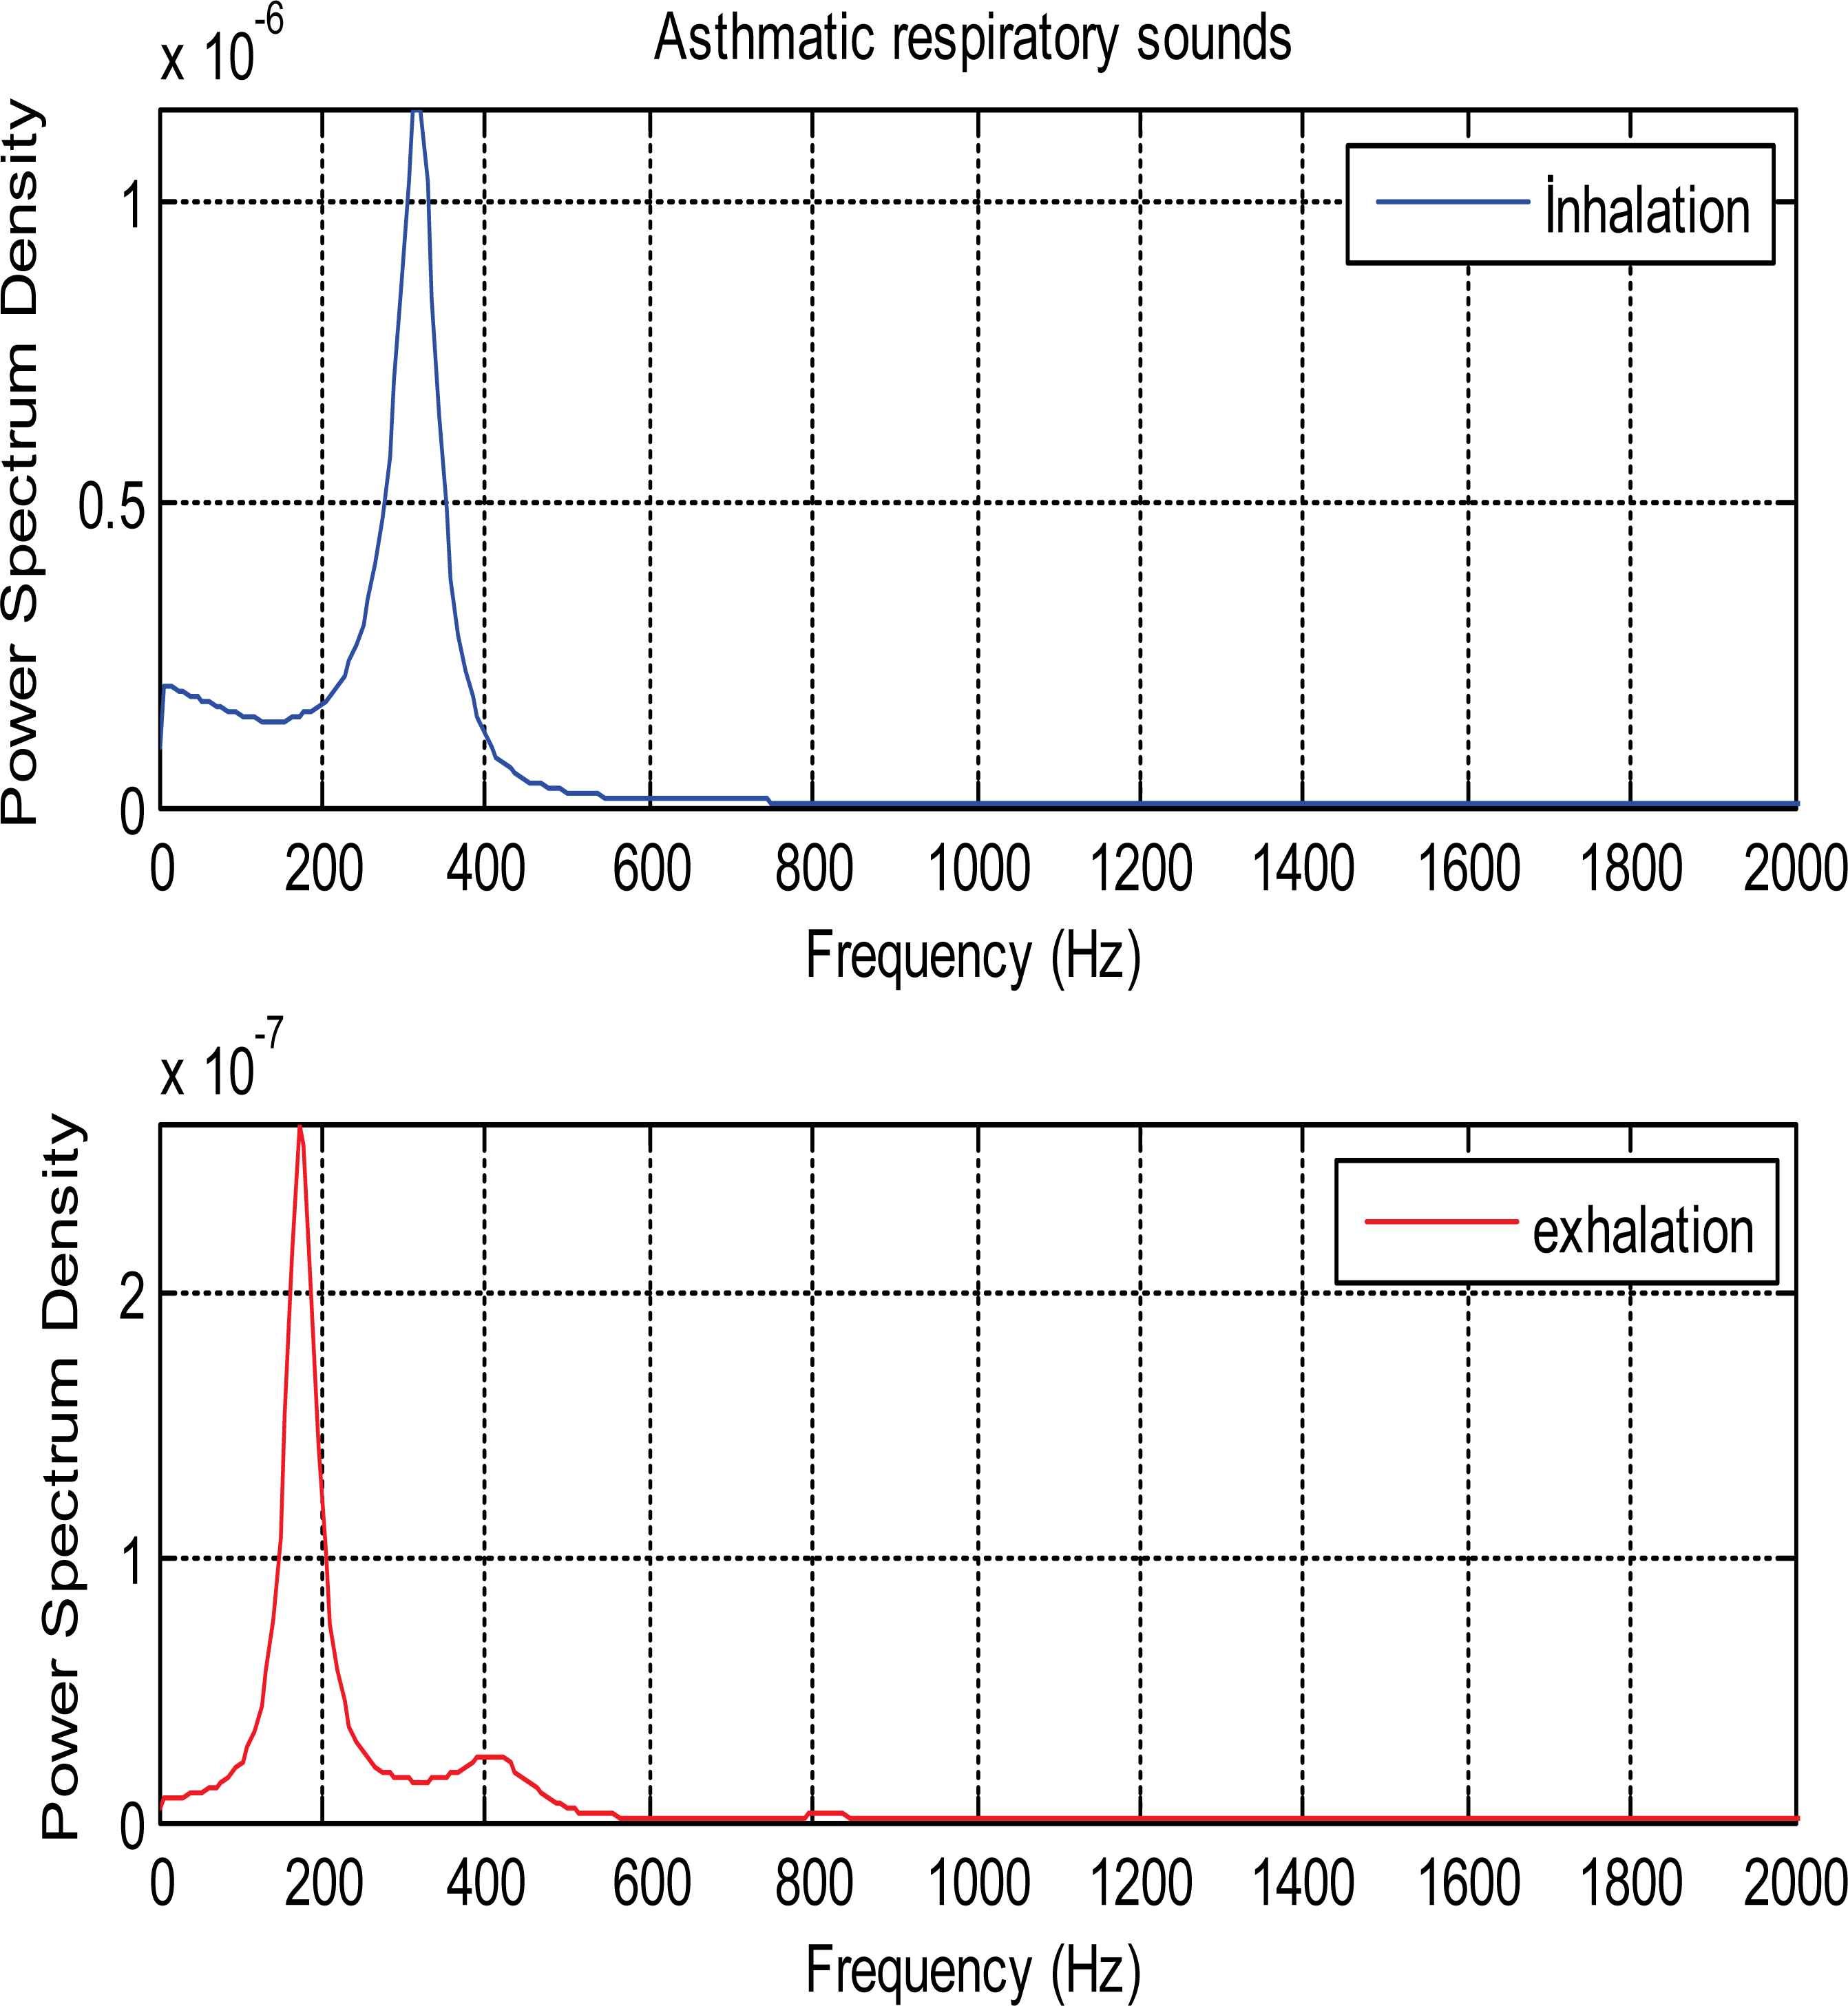
PSDs of inhalation and exhalation sound segments belonging to asthmatic patient
PSDs of patient who had COPD disease is seen as in Fig. 7.

PSDs of inhalation and exhalation sound segments belonging to COPD patient
PSDs of inhalation and exhalation sounds relate to patient with HP are shown in Fig. 8. PSDs in all figures are calculated Ar-Burg method.
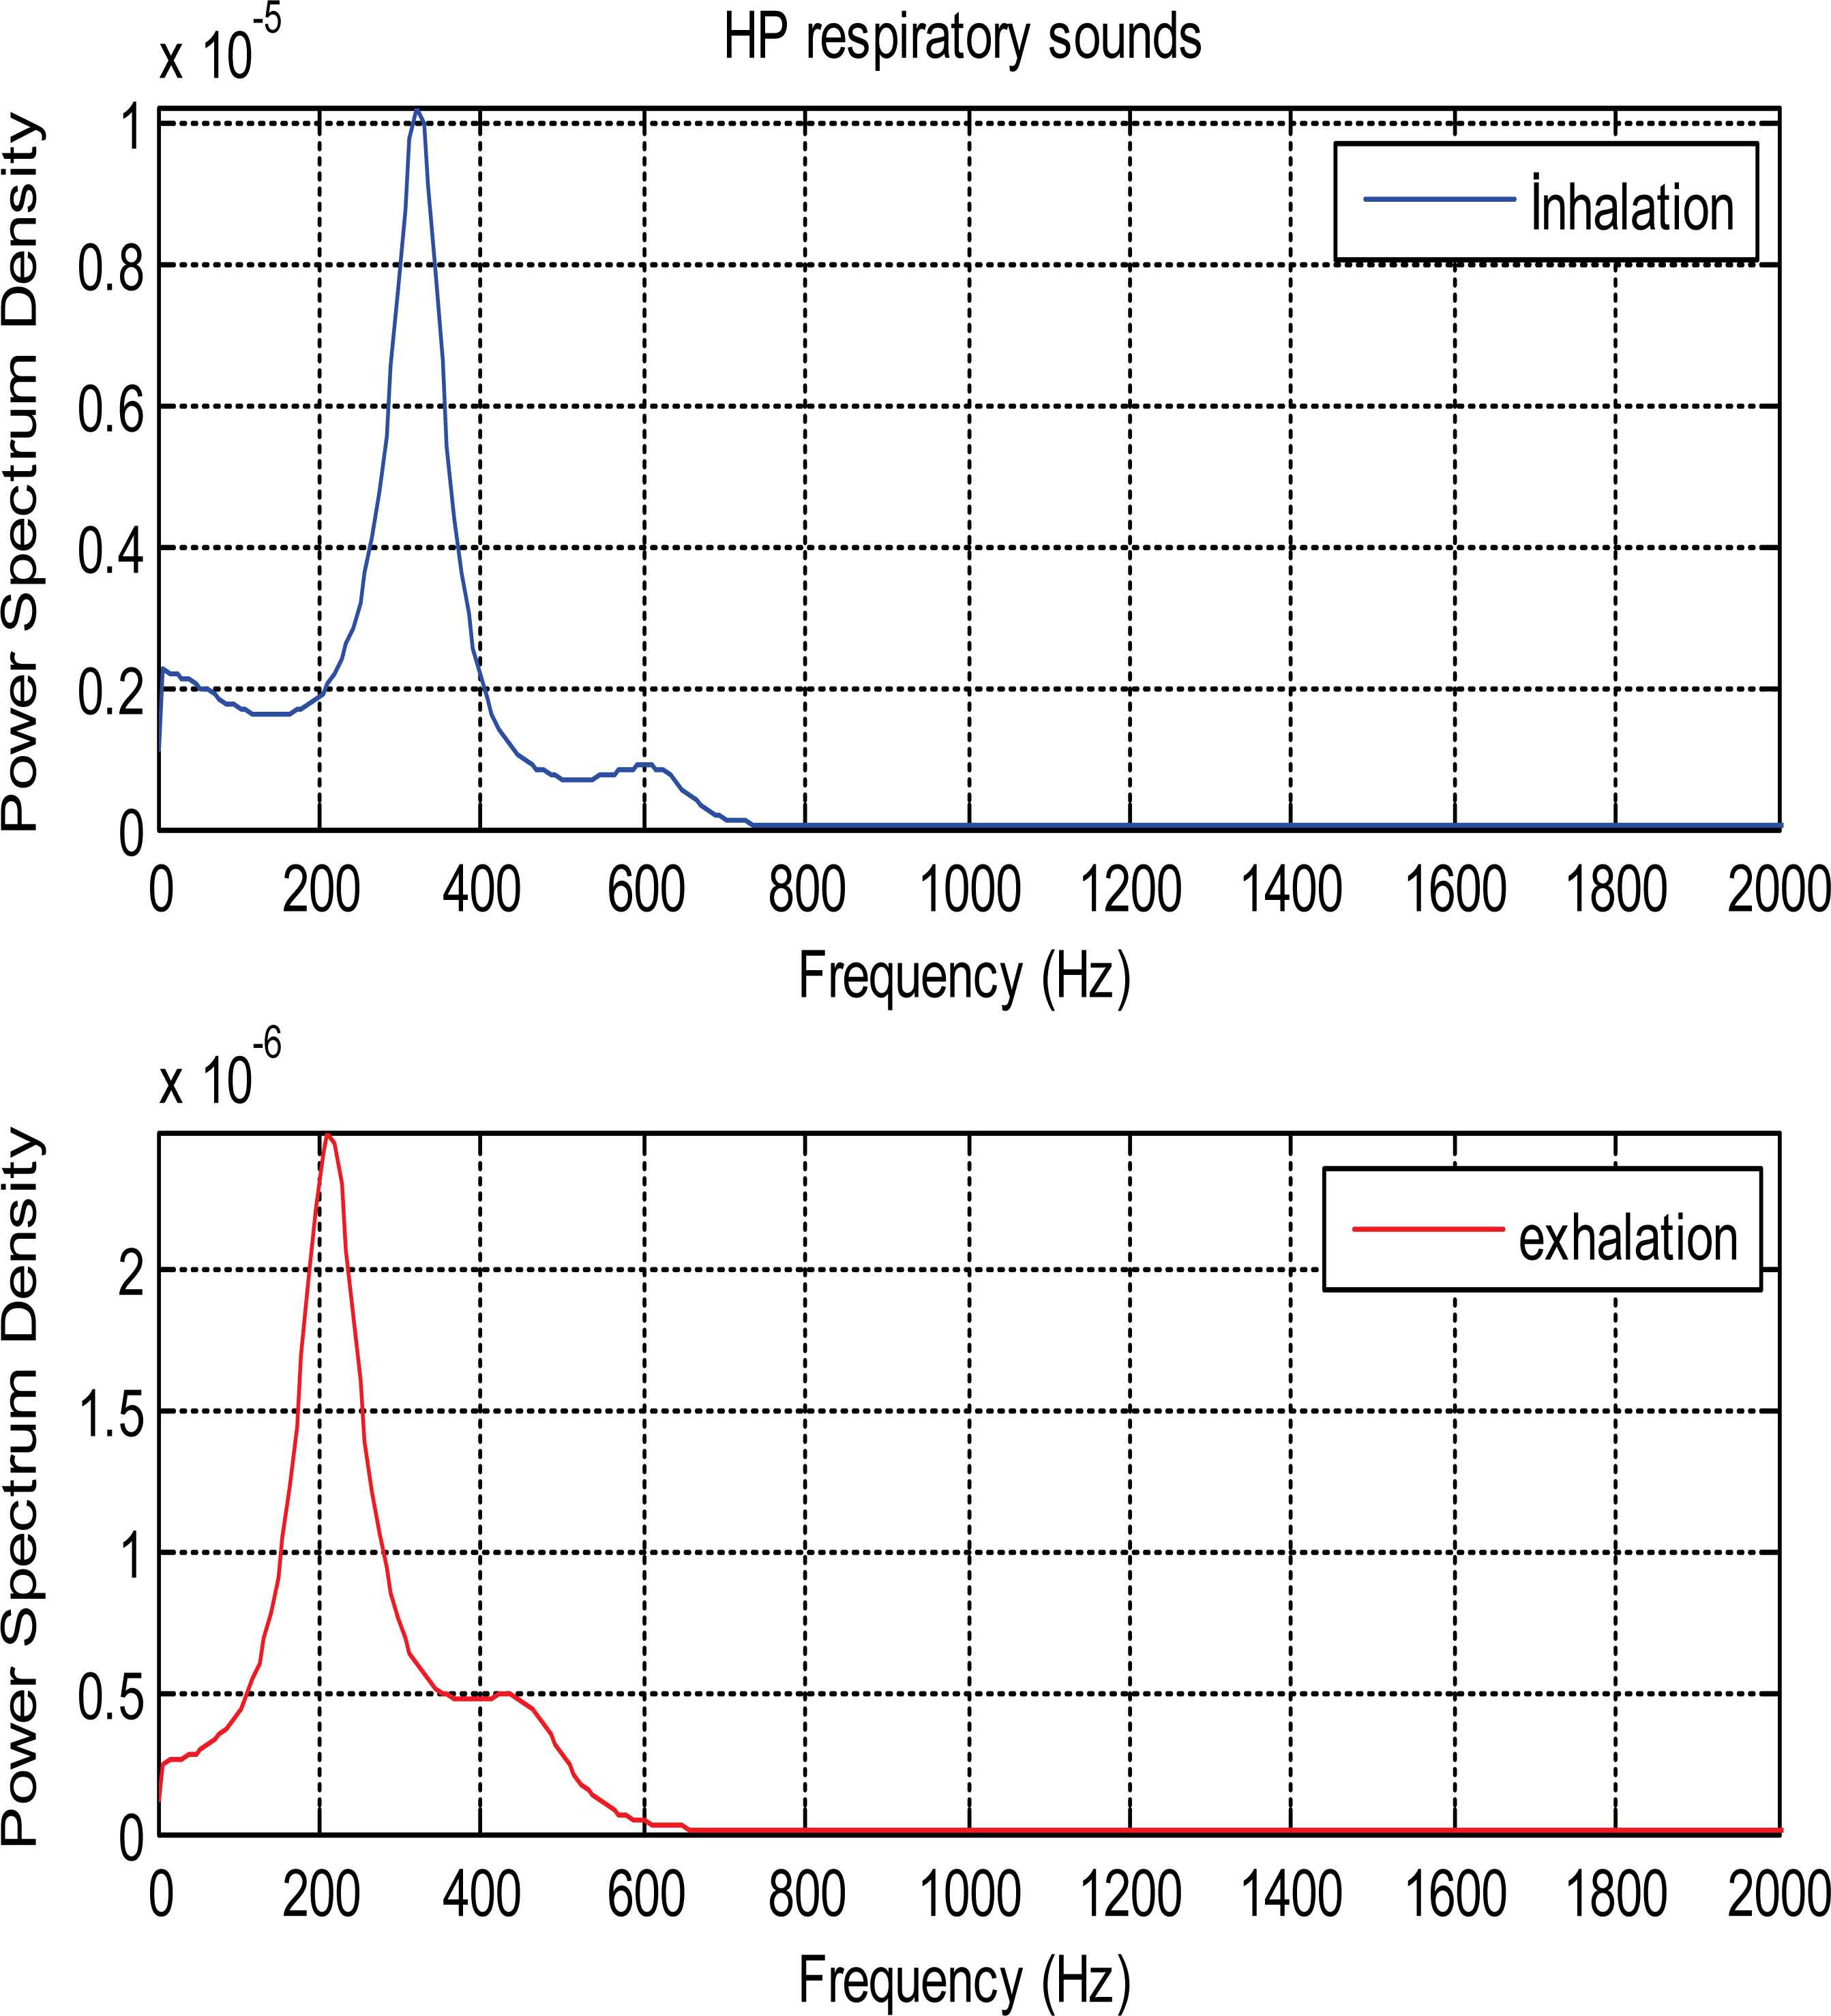
PSDs of inhalation and exhalation sound segments belonging to HP patient
As it is seen from the Fig. 5 and Fig. 6, PSDs of normal and asthmatic respiratory sounds are accumulated between 100 and 600 frequency range. It is understood from these figures that PSDs of exhalation sounds belonging to healthy person and asthmatic patient show more diversity than PSDs of inhalation sounds. Fig.7 and Fig.8 show that PSDs of respiratory sounds related to COPD and HP patients are scattered up to 1000 Hz.
PSDs of inhalation sounds of COPD and HP patients show differences according to that of healthy person. In addition, PSD of exhalation sounds of HP patient are different from that of healthy person.
Because the nfft values were chosen as 1024 for all methods, PSDs with 1024/2+1 (513) points were obtained as feature vectors. The dimension of feature vectors is too big for an effective classification. For the successful and short time classification process, dimension of features vectors should be reduced. In order to reduce the dimensionality of the extracted feature vectors, we divided 0-2000Hz frequency band of PSDs into intervals as presented in Table 1.
| İntervals Name | Frequency İntervals |
|---|---|
| F1 | 1000-2000 |
| F2 | 500-1000 |
| F3 | 250-500 |
| F4 | 125-250 |
| F5 | 62.5-125 |
| F6 | 31.25-62.5 |
| F7 | 0-31.25 |
Frequency intervals of PSDs
Division of the frequency bands into intervals was carried out using decomposition rule of discrete wavelet transform (DWT). In discrete wavelet transform, signal is passed through both the high and low pass filters simultaneously. Cut-off frequencies of these filters are designed as one-fourth of the sampling frequency. For the 8000 Hz sampling frequency, DWT produce frequency intervals like Fig. 9. H represents high pass filter and L represents low pass filter in Fig. 9.

Ranges of frequency bands in discrete wavelet decomposition
In many studies, wavelet coefficients of frequency intervals produced by DWT have been used as features of respiratory sounds. But, in this study, decomposition rule of DWT was only used to determine the useful frequency intervals.
For our respiratory sounds with 8000 Hz sampling frequency, computed PSDs are scattered 0Hz-2000Hz frequency bands. Therefore, for each PSD, our frequency intervals are F1, F2, F3, F4, F5, F6 and F7. These intervals were generated using decomposition rule of DWT. Since the respiratory sounds do not have any useful frequency and power components in low frequencies, we discarded F6 and F7 frequency intervals. First five frequency intervals were selected to be used to create feature vectors.
Statistical features were extracted from the PSD values belonging to first five frequency intervals. These statistical features;
- 1.
Mean of the absolute values of the PSD values in each selected frequency interval.
- 2.
Maximum of the PSD values in each selected frequency interval.
- 3.
Standard deviation of the PSD values in each selected frequency interval.
- 4.
Ratio of the absolute mean values of adjacent frequency intervals.
Feature 1 (mean) and feature 2 (maximum) features represent the frequency distribution of the sound signal. Feature 3 (standard deviation) and feature 4 (ratio of the absolute mean values) describe the amount of changes in frequency distribution [1].
Kandaswamy et al. (2004) [1] extracted these features from the wavelet coefficients and obtained high performance. So, we used the same statistical features for classification.
Feature vectors of the sound segments were created using these statistical features as seen in Table 2. 5 mean values, 5 max values, 5 standard deviation values and 4 ratio of the absolute mean values are the features of our sound segments.
| Features Numbers | Features |
|---|---|
| 1,2,3 | mean(abs(PSD Values in F1)) |
| max(PSD Values in F1) | |
| std(PSD Values in F1) | |
| 4,5,6 | mean(abs(PSD Values in F2)) |
| max(PSD Values in F2) | |
| std(PSD Values in F2) | |
| 7,8,9 | mean(abs(PSD Values in F3)) |
| max(PSD Values in F3) | |
| std(PSD Values in F3) | |
| 10,11,12 | mean(abs(PSD Values in F4)) |
| max(PSD Values in F4) | |
| std(PSD Values in F4) | |
| 13,14,15 | mean(abs(PSD Values in F5)) |
| max(PSD Values in F5) | |
| std(PSD Values in F5) | |
| 16 | mean(abs(PSD Values in F1)) |
| mean(abs(PSD Values in F2)) | |
| 17 | mean(abs(PSD Values in F2)) |
| mean(abs(PSD Values in F3)) | |
| 18 | mean(abs(PSD Values in F3)) |
| mean(abs(PSD Values in F4)) | |
| 19 | mean(abs(PSD Values in F4)) |
| mean(abs(PSD Values in F5)) |
Feature Vectors
After the feature extraction phase, feature vectors consist of these 19 values applied as input parameters into ANN.
2.4. Classification Using Artificial Neural Network
ANN is an interconnected assembly of simple parallel processing elements, units, nodes or neurons, whose functionality is loosely based on animal neuron [30]. ANN has parallel processing in these neurons and connections with weights between neurons. ANN has to be trained for updating the weights and biases in order to produce the desired mapping. ANN consists of two phases as training and testing. At the training phases, the feature vectors are applied as input to the input layer of network and the network updating the weights and biases, to capture the relationship between the input patterns and desired outputs. The combined inputs are then modified by a transfer functions. This transfer functions can be a threshold function with only passes information if the combined input reaches a certain level, or it can be a continuous function of the combined input. This training phase often takes many hours. The ANN testing phase is real-time which refers to how the network globally processes at its inputs buffer and creates a respond at the output buffer. So, ANN is mostly used to solve complex problems of pattern classification and optimization tasks [1, 31]. ANN is widely used in biomedical field for modelling, data analysis, and diagnostic classification [1, 32–34]. The most frequently used training algorithm in classification problems is the back-propagation (BP) algorithm [1].
In this paper, ANN was used for classification of normal and different pulmonary disorders. İnput layer contains one layer and the numbers of node in this layer are 19. The hidden layer had one layer and 15 nodes for inhalation sounds, 18 nodes for exhalation sounds which gave maximum classification accuracy, the output layer consisted of one layer and 6 nodes for the classification. Used ANN structer is shown in Fig. 10.
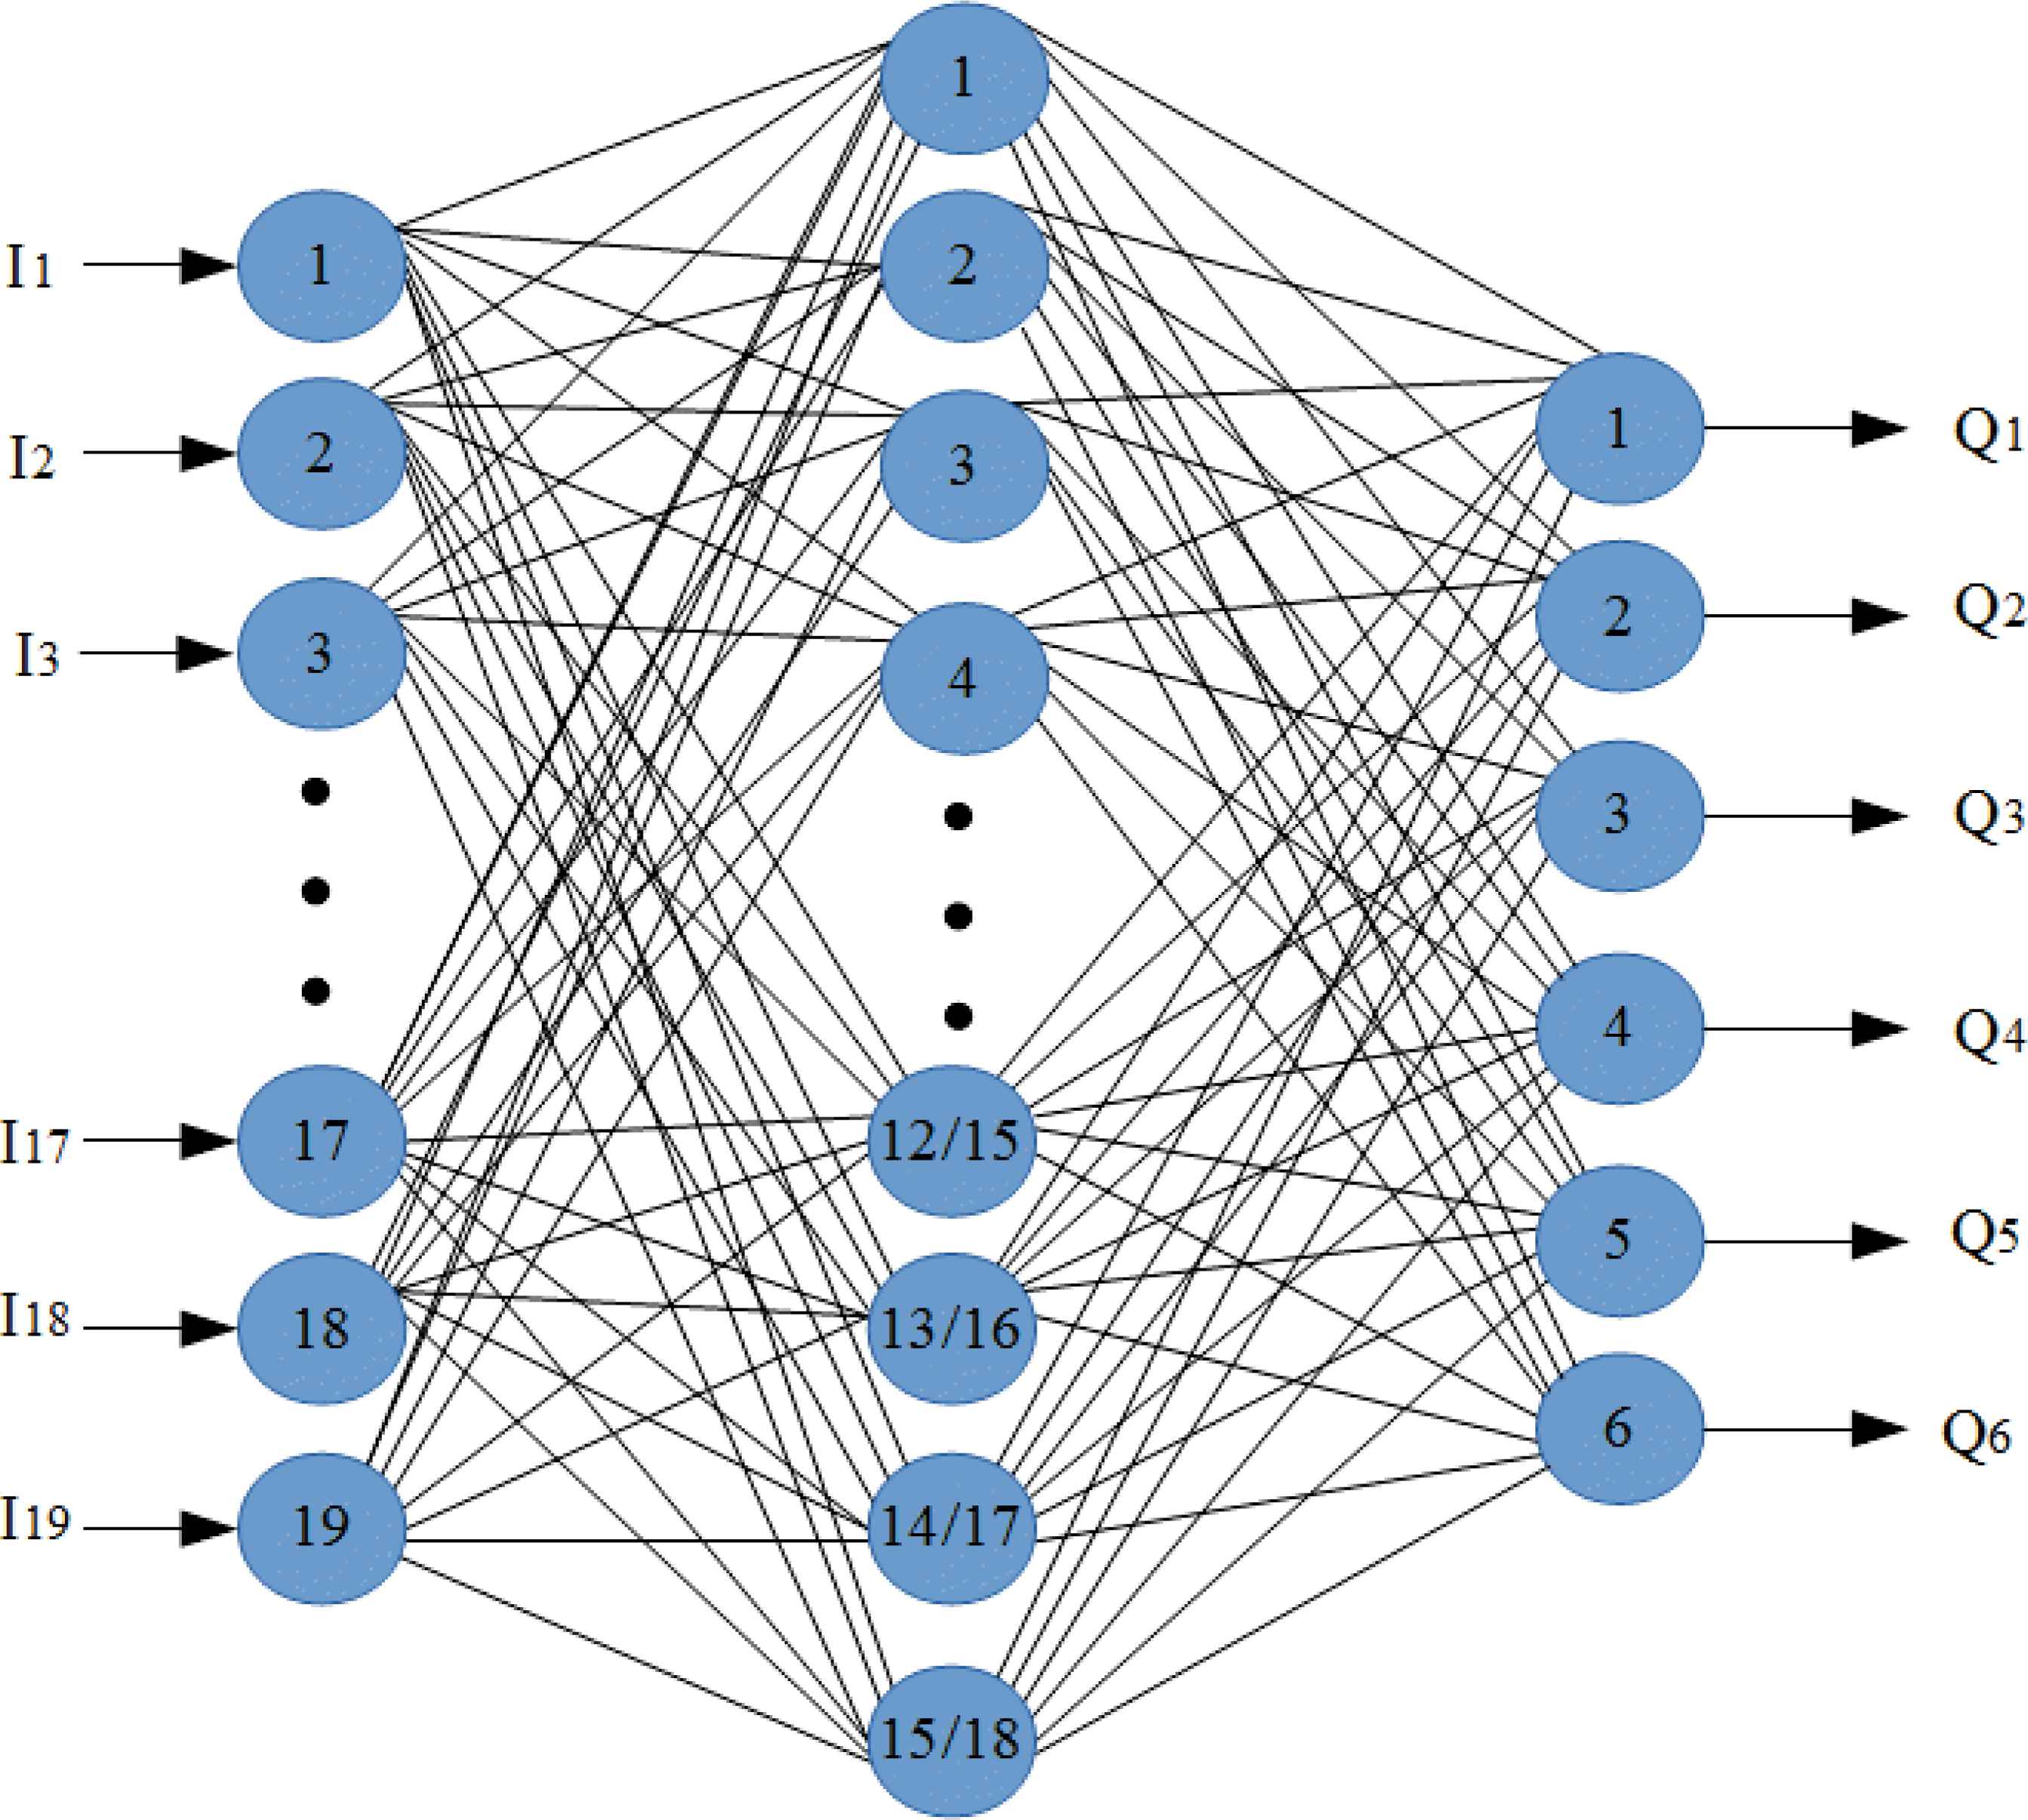
Used ANN structure
Orange canvas toolbox [35] was used for ANN. This toolbox is available for free at www.ailab.si/orange. Version of used toolbox is 2.7.
Q1, Q2, Q3, Q4, Q5 and Q6 outputs represent mild asthma, moderate asthma, severe asthma, normal, COPD and HP.
3. Results and Discussions
The spectral analysis of segmented respiratory sounds belonging to healthy and patients with pulmonary disorders was performed using FFT, AR and ARMA methods. PSDs were computed on each inhalation and exhalation phase of respiratory cycles in right basal and left basal. Frequency bands of power spectra were decomposed into 7 frequency intervals by using DWT decomposition rule as mentioned in section 2.3. Statistical features namely mean, max, standard deviation and ratio of mean values of adjacent frequency intervals were extracted from PSD values belonging to each of first five frequency intervals. Feature vectors consisted of these statistical feature values were created for each of respiratory sound segments. These values of features were normalized before classification process.
Artificial Neural Network (ANN) was used to classify normal and different pulmonary disorders. Inhalation and exhalation sounds were classified into six classes (severe asthma, moderate asthma, mild asthma, COPD, HP, and Normal).Classification process was separately performed for right basal and left basal as well as inhalation (breathing in) and exhalation (breathing out) phasese of sound segments. Orange toolbox [35] was used for ANN.
Neural Network Learning in orange toolbox implements a multilayer perceptron. Learning is performed by minimizing an L2-regularized cost function with scipy’s implementation of Limited Memory Broyden Fletcher Goldfarb Shanno (L-BFGS) [35]. Parameters of the neural network in orange toolbox are number of nodes in the hidden layer, regularization factor and maximum number of iterations.
Regularization factor is to control overfitting. Overfitting means that classifier guarantees classification of training data perfectly. But, for the new data points (test data), it cannot guarantee perfect classification. Therefore, overfitting problem should be prevented as much as possible. Regularization factor is also to control trade-off between fitting the data and keeping network weights small. Higher values of it make weights to be too smaller. In this study, we applied regularization values ranging between 0.1 and 1. Since the amount of sound data is not very large, regularization factor with 0.1 values has been enough for high classification accuracy. For the same reason, maximum number of iterations has been selected as 1000. This value has been sufficient for high-performance classification. The low value of the maximum iteration also provides us the advantage of the low training time.
The performances of ANN for different spectral analysis methods (AR, ARMA and FFT) were evaluated according to classification accuracy (CA), specificity and sensitivity.
Classification Accuracies (CA) according to different spectral analysis is indicated using ANN in Table 3.
| Method | Classification Accuracy (%) | ||
|---|---|---|---|
| Inhalation | Exhalation | ||
| RIGT BASAL | AR-Burg | 85.67 | 78.33 |
| ARMA | 84.00 | 84.67 | |
| FFT-Welch | 82.00 | 72.33 | |
| LEFT BASAL | AR-Burg | 93.00 | 78.33 |
| ARMA | 85.33 | 80.33 | |
| FFT-Welch | 89.00 | 72.67 | |
Classification accuracies of six class using ANN
Table 3 shows that percentages of correct classification using AR method are better than those of other used spectral analysis methods for inhalation sounds related to 2 basal. Also as shown in table 3, ARMA method have the highest performance for exhalation sounds.
For distinguishing respiratory sounds associated with 6 different pulmonary conditions, analysis and classification of inhalation sounds in left basal produce more promising results than exhalation sounds. As a result of analysis and classification of exhalation sounds belonging to 2 basals, roughly equal performances were obtained.
It was also observed that AR-Burg, ARMA and FFT-Welch methods worked well especially on inhalation sound signals. When these methods were applied to exhalation sounds, it is seen that they were moderately well to detect pulmonary diseases.
In the medical decision-making process, receiver operating characteristic (ROC) curve method is one of the performance evaluation criteria used to distinguish different pulmonary diseases. The most common use of the ROC curve is the calculation of the area under the ROC curve (AUC) [36]. Possible values for AUC vary from 0.5 to 1.0 [37, 38]. Value of 0.5 refers to diagnosis irresistible [37, 38]. Value of 1.0 refers to the diagnosis can be perfect [37, 38].
The following ratings are used in the interpretation of the area under the curve.
- •
Between .90 and 1.00 is perfect,
- •
Between .80 and .90 is good,
- •
Between .70 and .80 is moderate,
- •
Between 60 and .70 is weak,
- •
Between .50 and .60 is unsuccessful.
Table 4 shows the AUC values when FFT, AR and ARMA methods are used for analysis and ANN is used for classification of respiratory sounds.
| Method | Area Under ROC Curve (%) | ||
|---|---|---|---|
| Inhalation | Exhalation | ||
| RIGT BASAL | AR-Burg | 97.14 | 81.63 |
| ARMA | 96.63 | 91.19 | |
| FFT-Welch | 95.07 | 78.96 | |
| LEFT BASAL | AR-Burg | 99.54 | 91.80 |
| ARMA | 93.59 | 97.0 | |
| FFT-Welch | 98.89 | 90.14 | |
Area under roc curve
It is well understand from table 4 that the values of the AUC are supportive of the classification results.
FFT, AR and ARMA spectral analysis techniques can be considered as diagnostic test used to distinguish healthy individuals and patients. In this case, it can be said that the separation capabilities of these techniques are perfect for distinguishing different pulmonary sounds according to AUC values.
Tables containing confusion matrix, specificities and sensitivities are shown in the remainder of this section. Class1, class2, class3, class4, class5 and class6 which are seen in tables represent mild asthma, moderate asthma, severe asthma, normal, COPD and HP respectively.
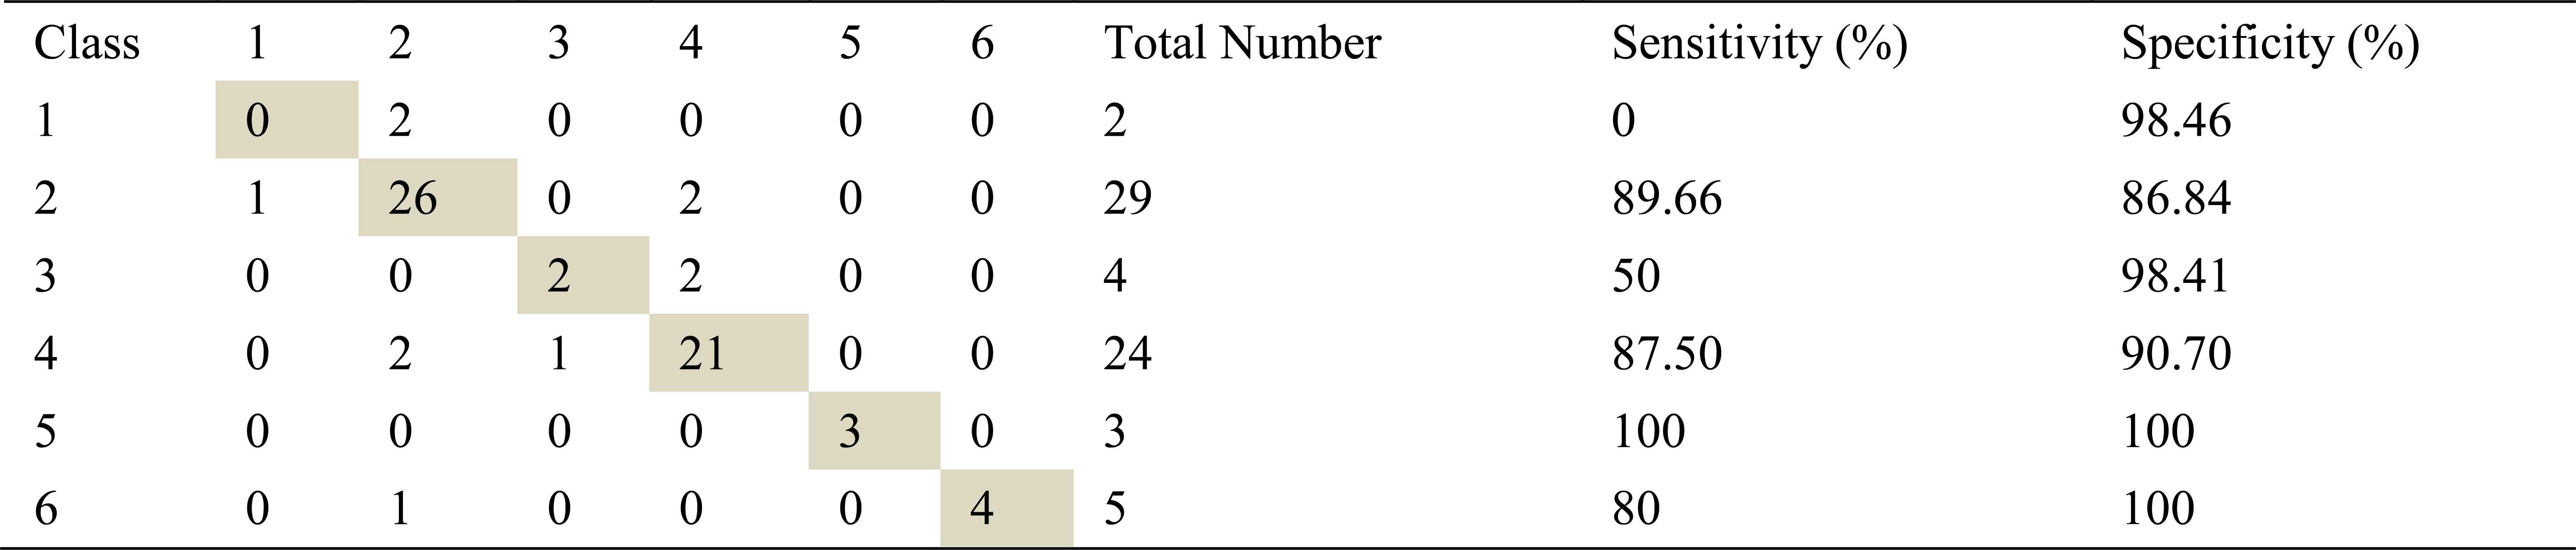
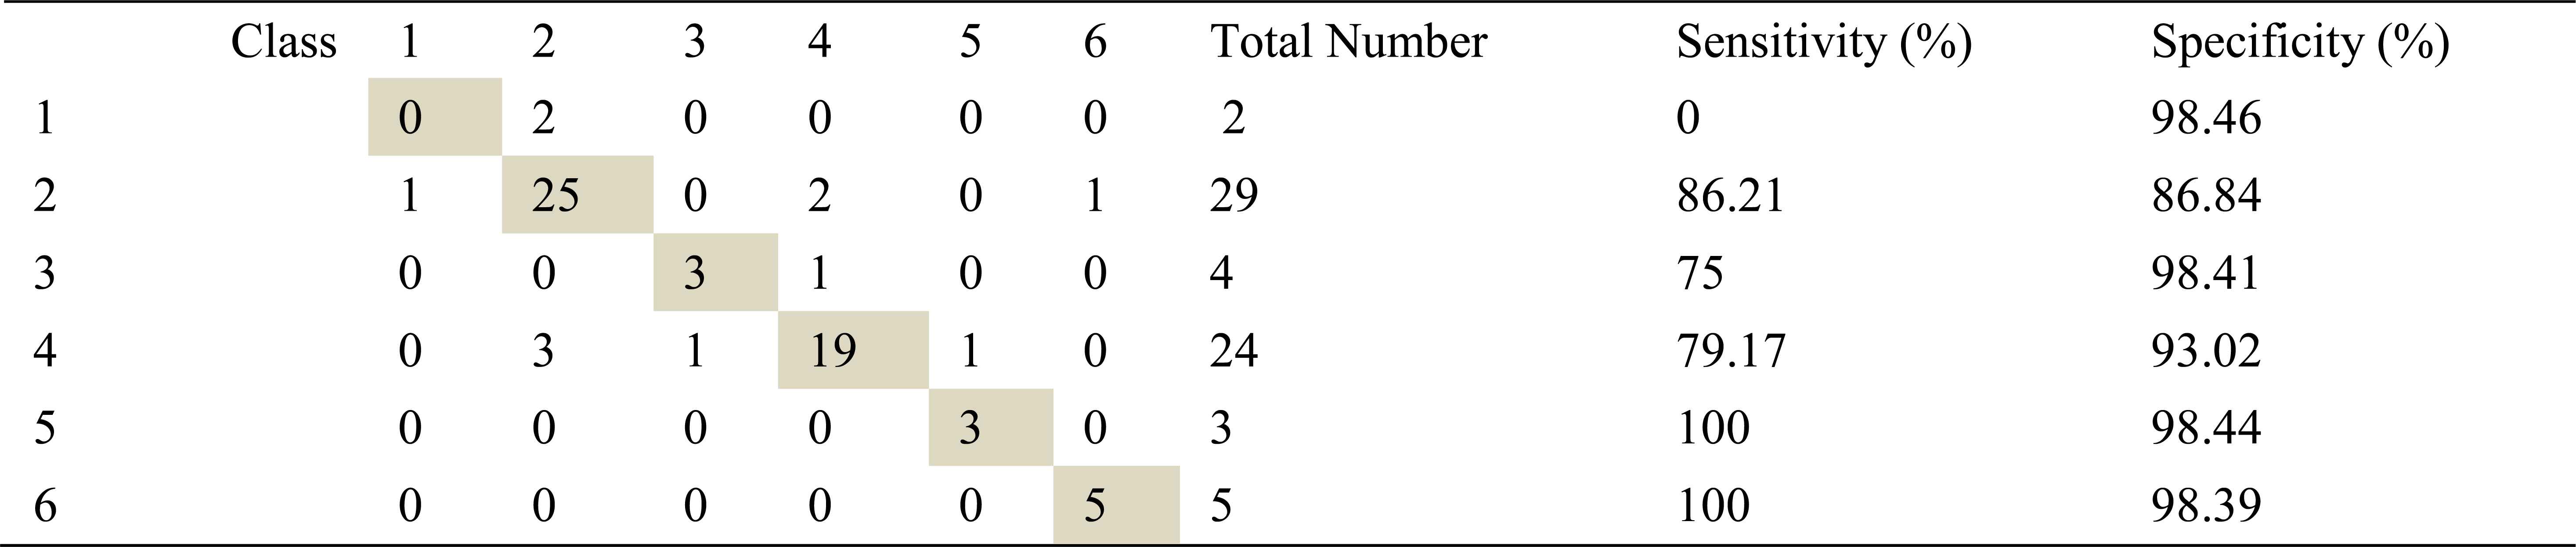
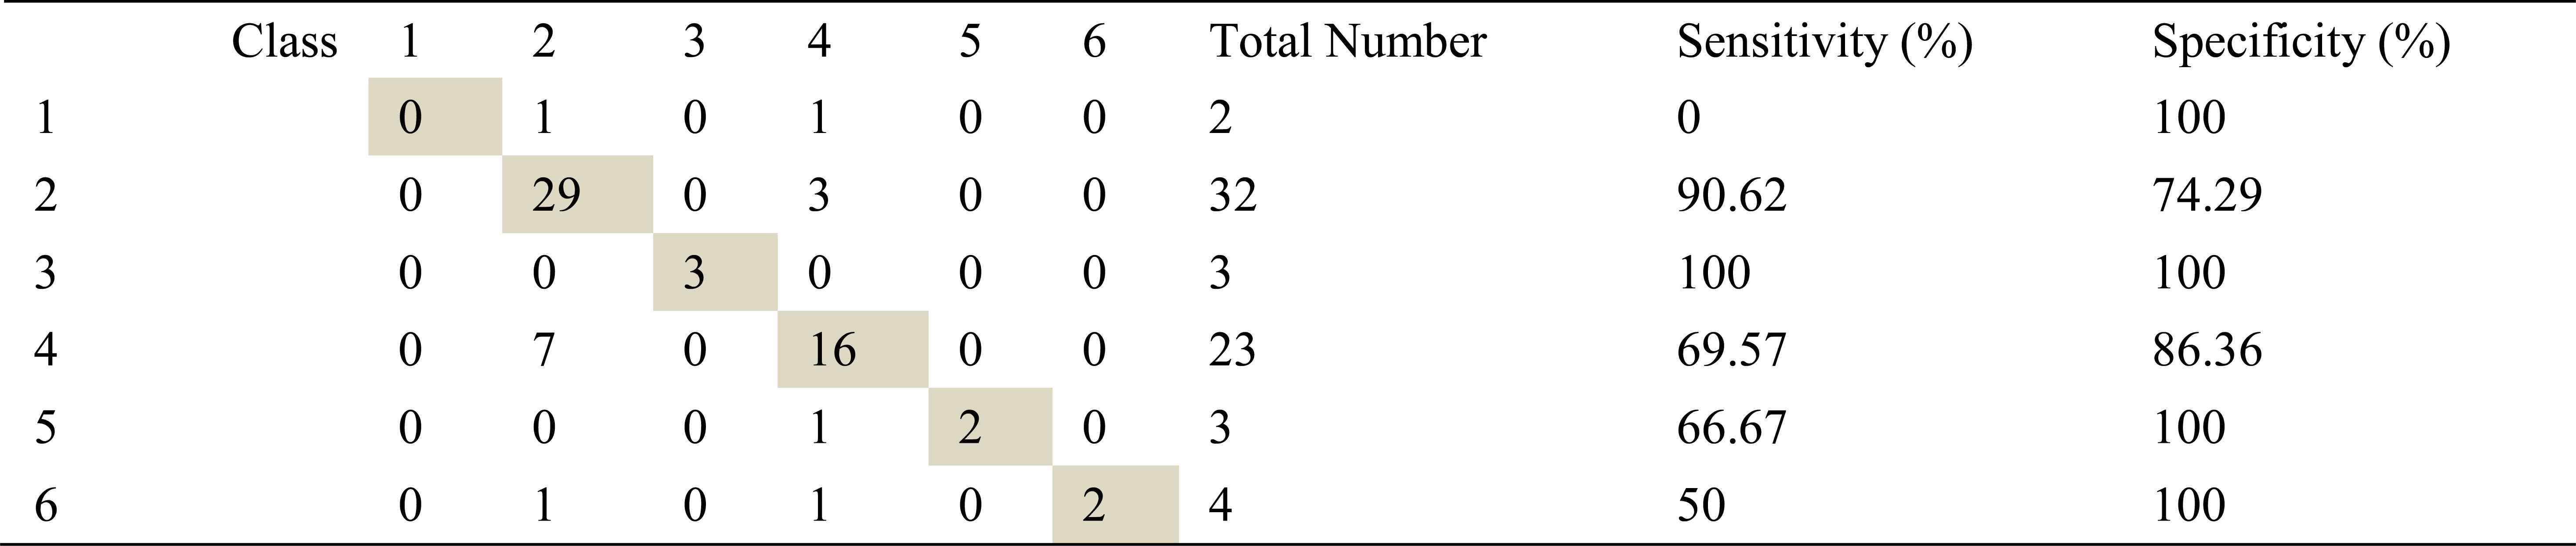
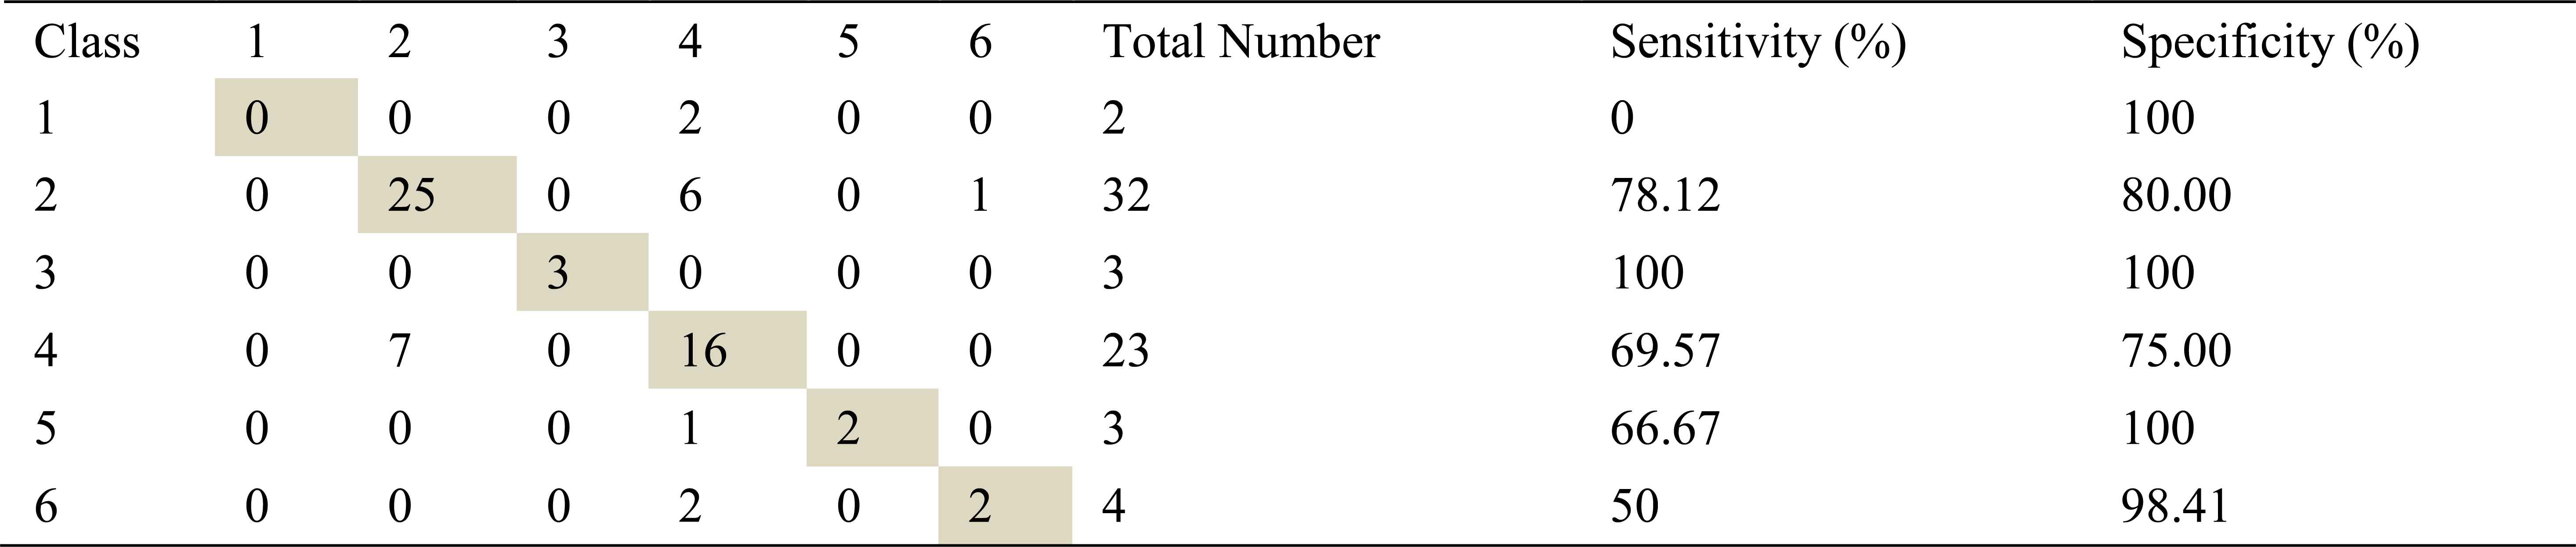
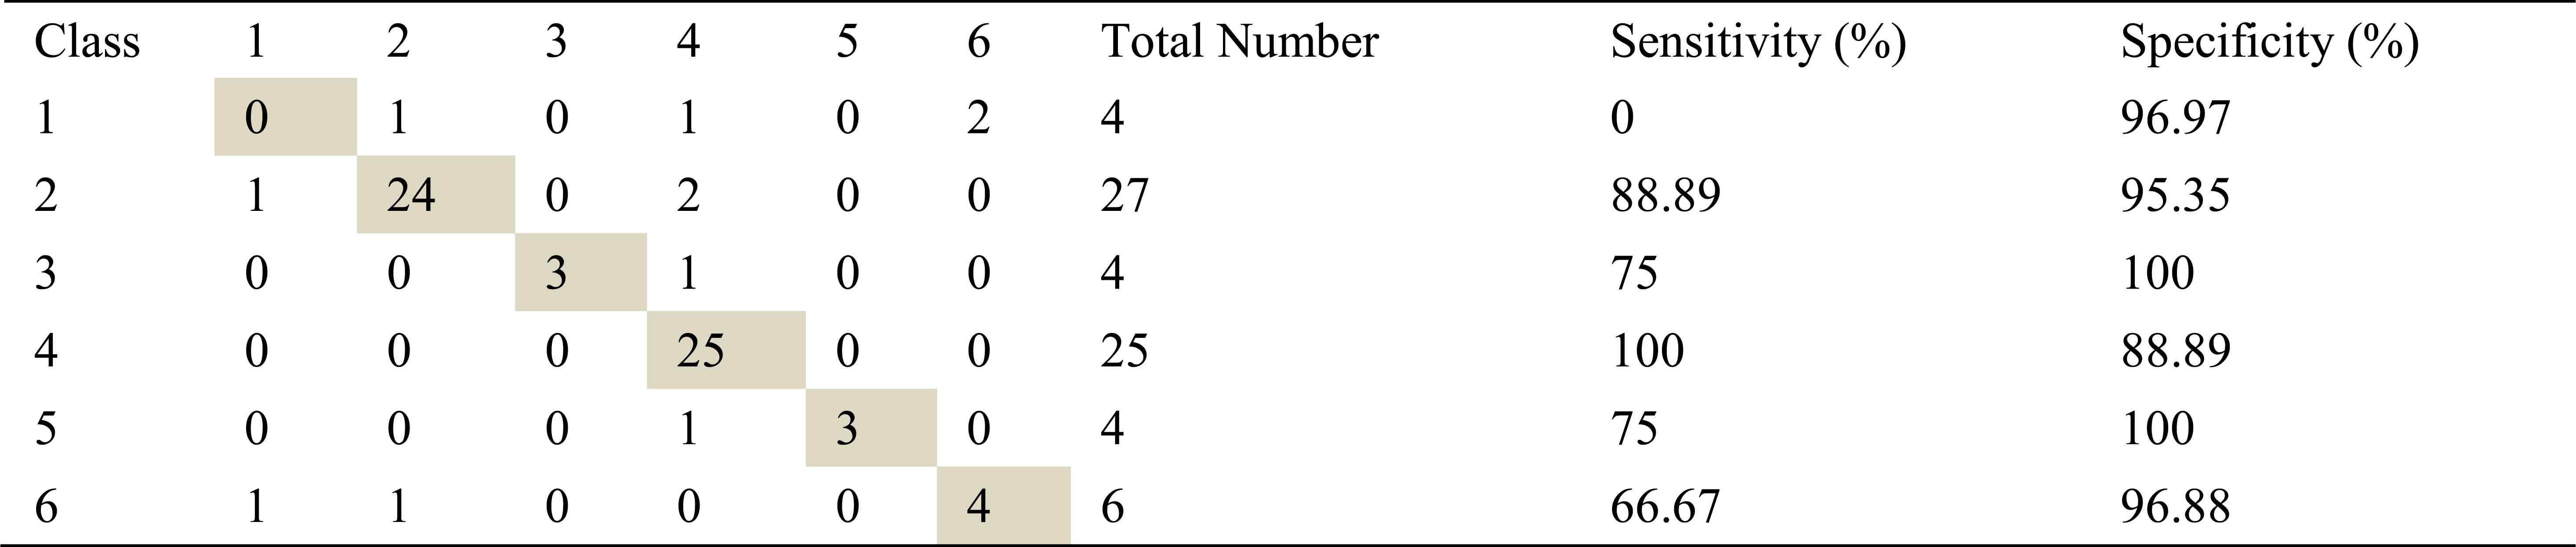
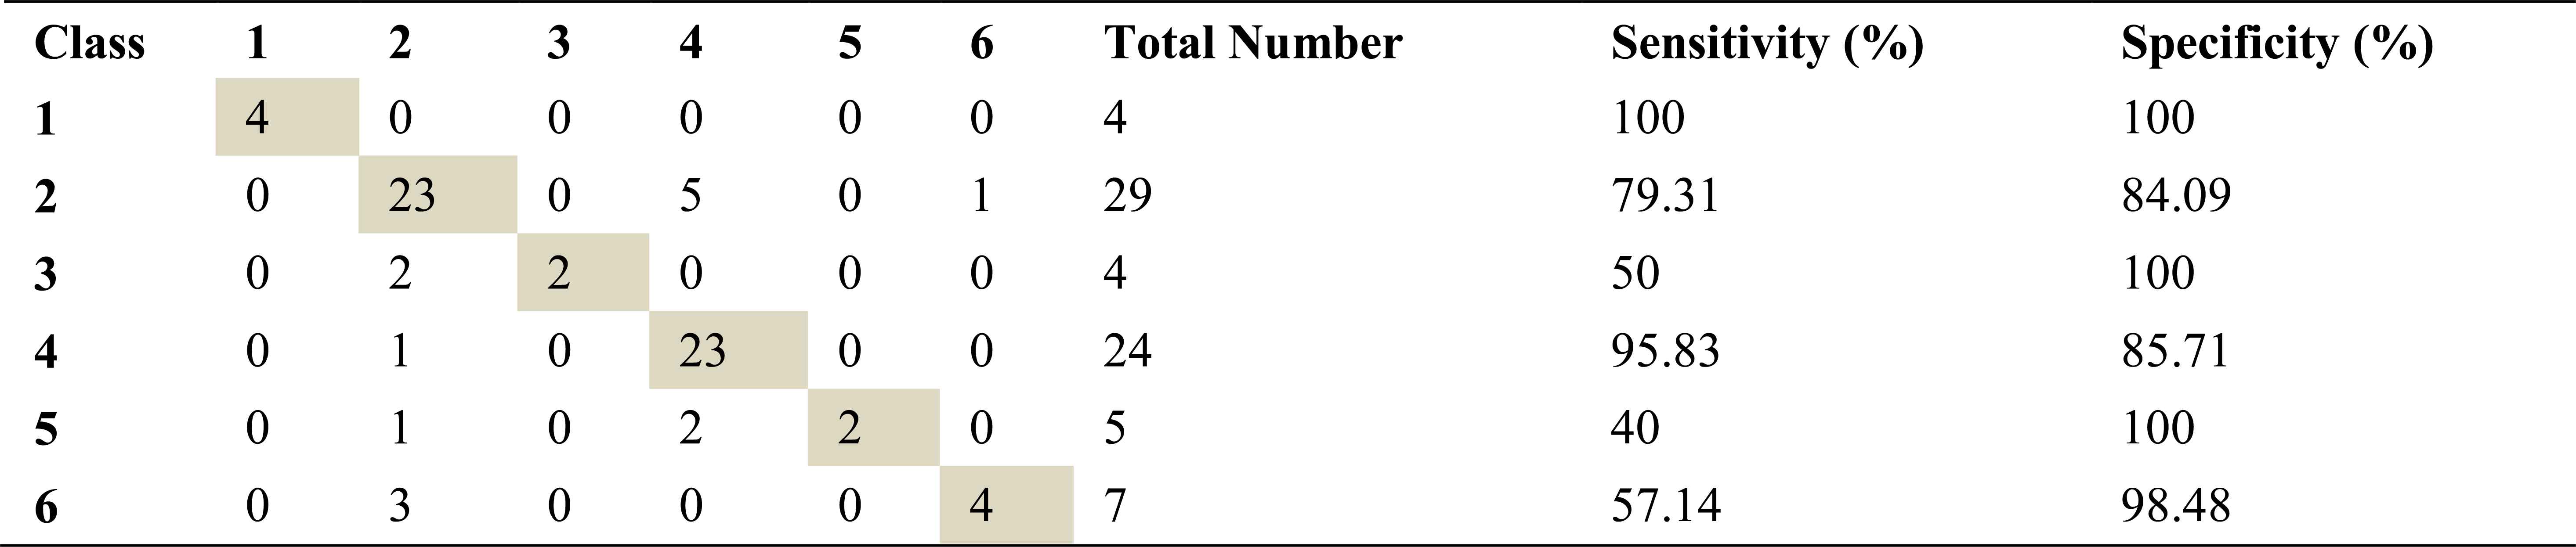
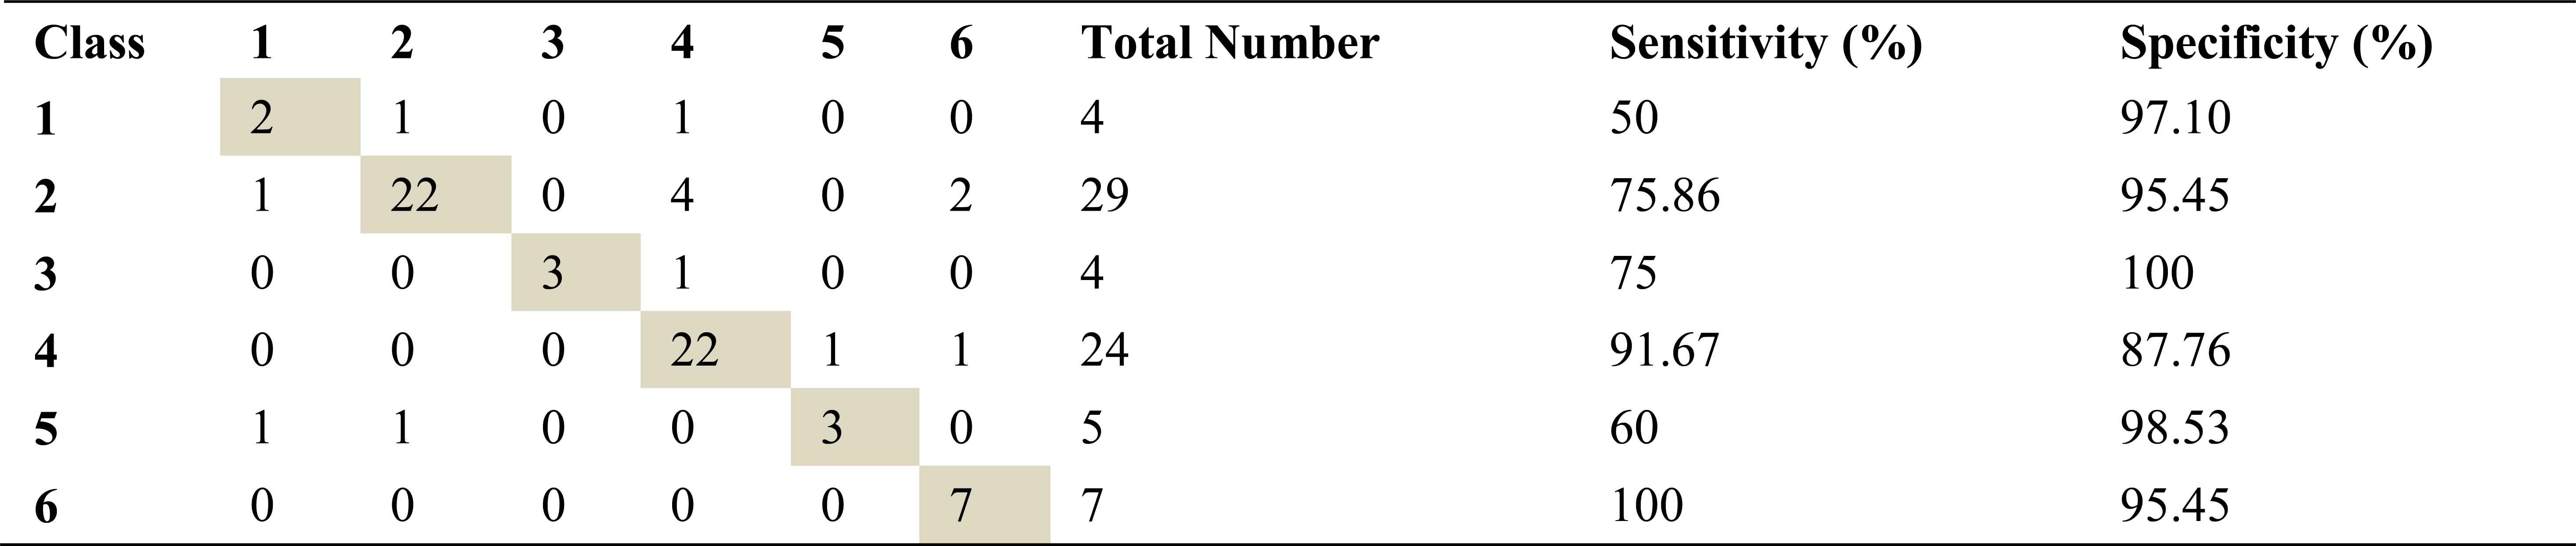
Confusion matrix, specificities and sensitivities belonging to right basal inhalation sounds are shown in table 5, table 6, table 7 and those of right basal exhalation sounds are shown in table 8, 9 and 10.
Confusion matrix, sensitivity and specificity values using AR-Burg method and ANN for right basal inhalation sounds
Confusion matrix, sensitivity and specificity values using ARMA method and ANN for right basal inhalation sounds
Confusion matrix, sensitivity and specificity values using Welch method and ANN for right basal inhalation sounds
Confusion matrix, sensitivity and specificity values using AR method and ANN for right basal exhalation sounds

Confusion matrix, sensitivity and specificity values using ARMA method and ANN for right basal exhalation sounds
Confusion matrix, sensitivity and specificity values using Welch method and ANN for right basal exhalation sounds
Total number of right basal inhalation sound segments is 67. As shown in Table 5, table 6 and table 7, 57 sound segments were classified correctly when AR method was used. The number of correctly classified sound segment has been 56 and 55 when ARMA and FFT methods have been used. When sensitivities and specificities are observed, the following inferences can be made for the right basal inhalation sounds.
- ✓
AR-Burg and ARMA methods works especially well for asthma, normal, COPD and HP classes.
- ✓
When FFT-Welch method was used with ANN, it yields %100 correct classification accuracies for COPD and HP classes.
As in inhalation sounds, total number of right basal exhalation sound segments is 67. When we used AR-Burg, ARMA and FFT-Welch methods, numbers of correctly classified sound segment were 52, 56 and 48 respectively. We have seen from the results (Table 8, Table 9 and Table 10) that AR and ARMA methods work well for asthma and mild asthma classes. In addition, we have seen from the same tables that ARMA method also works well for normal class. FFT-Welch method has low percentages of classification accuracy and sensitivity. Thereby we can say that this method did not seem to work well for pulmonary diseases. However, we also say that this method and other used methods are quite successful for mild asthma class.
By looking at sensitivity and correct classification rates we can say that any spectral analysis method does not work successfully for analyzing of right basal sounds belong to severe asthma. In addition, analysis and classification of İnhalation sounds belong to right basal give more useful information about COPD and HP diseases. Furthermore, exhalation sounds of right basal give quite useful information about asthma and mild asthma diseases.
Confusion matrix, specificities and sensitivities belonging to left basal inhalation sounds are shown table 11, table 12, table 13.

Confusion matrix, sensitivity and specificity values using AR method and ANN for left basal inhalation sounds
Confusion matrix, sensitivity and specificity values using ARMA method and ANN for left basal inhalation sounds

Confusion matrix, sensitivity and specificity values using Welch method and ANN for left basal inhalation sounds
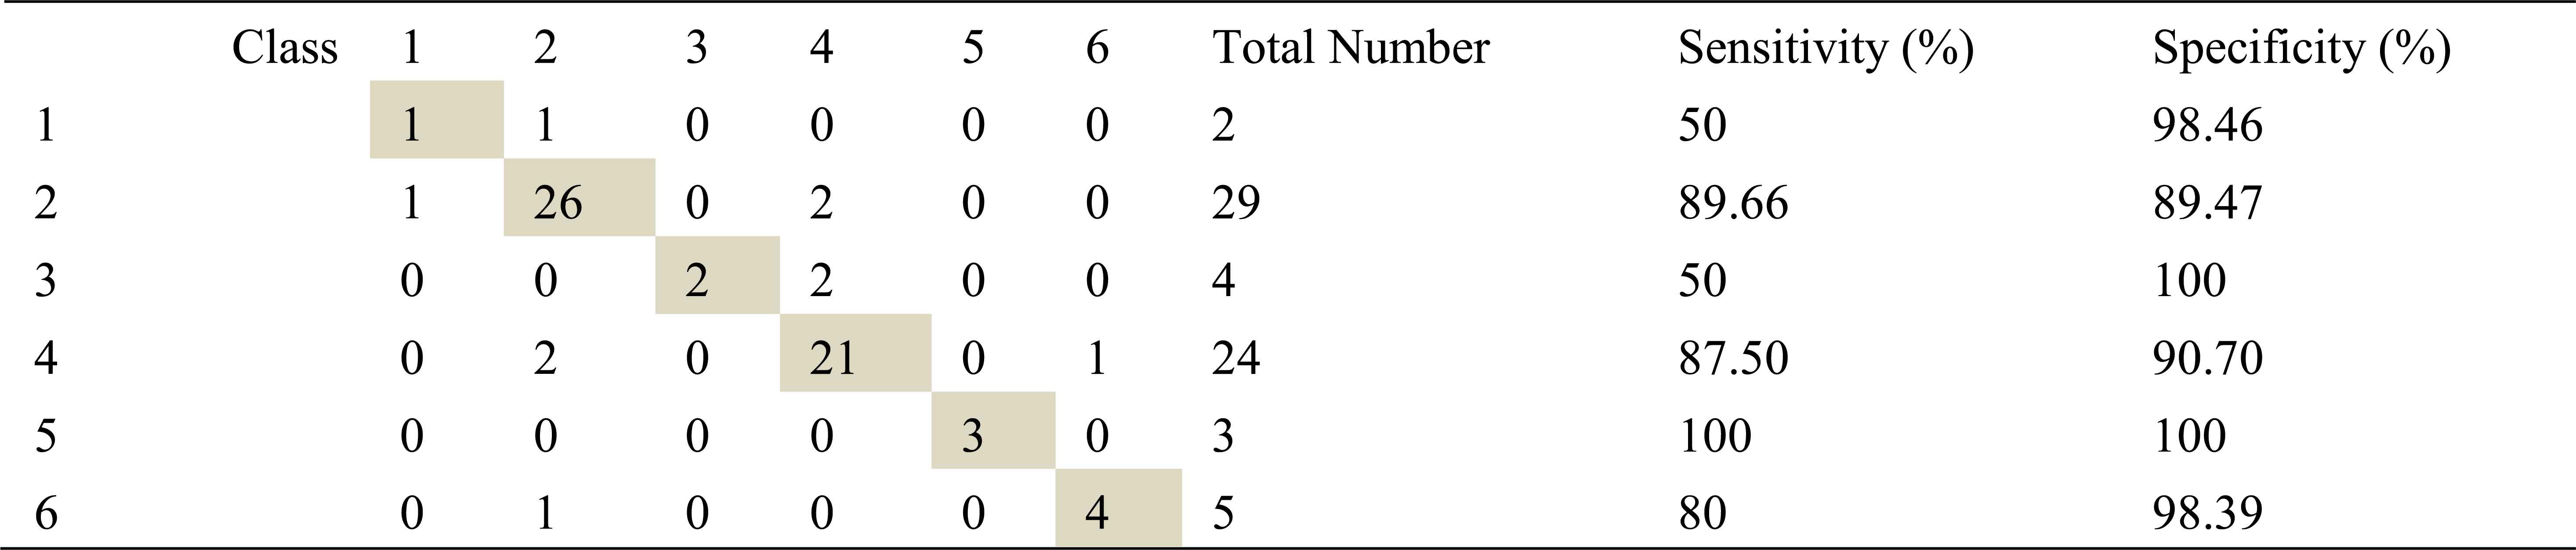
Total number of the left basal inhalation sound segments is 70. 65 sound segment samples were classified correctly using AR-Burg method. It works well for almost all classes. It doesn’t work well for only severe asthma class. 59 samples and 62 samples were correct classified using ARMA and FFT-Welch method respectively. ARMA method for moderate asthma class has the best classification accuracy as %100.
FFT-Welch method is one of the best methods for COPD class. Another best method for this class is AR-Burg method.
Table 14, table 15 and table 16 show that confusion matrix, specificities and sensitivities belonging to left basal exhalation sounds.
Confusion matrix, sensitivity and specificity values using AR method and ANN for left basal exhalation sounds
Confusion matrix, sensitivity and specificity values using ARMA method and ANN for left basal exhalation sounds

Confusion matrix, sensitivity and specificity values using Welch method and ANN for left basal exhalation sounds
Total number of the left basal exhalation sound segments is 73. When we used ARMA method as spectral analysis method, 59 of these sound segments were classified correctly. This method yields high accuracies for normal and severe asthma classes. 58 and 55 sound segments were correct classified using AR and FFT-Welch method respectively. ARMA method for normal and HP classes has the high sensitivity as 91.67 and %100. FFT-Welch method didn’t work well for mild asthma and COPD classes. In fact, the analysis by this method gives %0 percentage of correct classification.
As seen from the all tables that best percentages for severe asthma classes were obtained, when the left basal exhalation sounds were analyzed.
Our results reveal that AR method is the best methods for analysis of inhalation sounds and ARMA method is the best method for analysis of exhalation sounds. If spectral analysis of left basal inhalation sounds is ignored, FFT method has the lower success than AR and ARMA methods in spectral analysis of respiratory sounds for diagnosing pulmonary disorders. This situation can be explained by several reasons. For example, FFT is a poor spectral estimator and has large variance. AR, ARMA methods avoid the problem of leakage and usually provide better frequency resolution than the FFT method.
Also our results show that analysis and classification of inhalation sounds generally give more useful information about COPD and HP diseases. In particular, the analysis of exhalation sounds belonging to left basal provides detection of severe asthma disease. Furthermore, exhalation sounds of right basal give quite useful information about asthma and mild asthma diseases.
If AR, ARMA spectral analysis methods and ANN classifier work together on respiratory sounds analysis, they can give us useful information about various pulmonary conditions.
4. Conclusion
Spectral Analysis of respiratory sounds is significant for diagnosing of pulmonary disorders. In the literature, many studies have obtained over % 80 performances for distinguishing respiratory sounds using spectral analysis methods. However, most of these studies have been performed on respiratory sounds associated with 2 pulmonary conditions. These conditions are healthy and pathological or normal and abnormal. Very few study adopted multi pulmonary conditions. Also, in many studies, one feature extraction and analysis method has been adopted. That’s why, in this study, we analyze and classify respiratory sounds related to 6 different pulmonary conditions. In addition, unlike the other studies, we used different spectral analysis techniques for analysis of sounds.
Analysis and extraction of characteristic features was carried out by AR, ARMA parametric model-based methods and FFT non-parametric method. ANN structure was used to classify sounds into 6 groups. As a result of this study, it was noticed that the best diagnostic performance was obtained as %93. This high ratio was achieved by analyzing and classifying left basal inhalation sounds using AR method and ANN classifier. In addition to this successful ratio, well diagnostic performances such as %85.67, %84.67, % 80.33 was obtained.
In the last stage of this study, used feature extraction methods were compared depending on classification accuracy, specificity and sensitivity in diagnosing pulmonary disorders. As results, we can say that AR method is the best methods for analysis of inhalation sounds and ARMA method is the best method for analysis of exhalation sounds. Also, throughout the study, it is seen that AR and ARMA methods generally are better than classic spectral analysis method FFT for analyzing of respiratory sounds.
References
Cite this article
TY  - JOUR
AU  - F. Z. Göğüş
AU  - B. Karlık
AU  - G. Harman
PY  - 2016
DA  - 2016/08/01
TI  - Identification of Pulmonary Disorders by Using Different Spectral Analysis Methods
JO  - International Journal of Computational Intelligence Systems
SP  - 595
EP  - 611
VL  - 9
IS  - 4
SN  - 1875-6883
UR  - https://doi.org/10.1080/18756891.2016.1204110
DO  - 10.1080/18756891.2016.1204110
ID  - Göğüş2016
ER  -