
An Application of Value Analysis for Lean Healthcare Management in an Emergency Department
- DOI
- 10.1080/18756891.2016.1204117How to use a DOI?
- Keywords
- Healthcare; DEMATEL; Lean management; Patient perceived value; Group decision making
- Abstract
This paper investigated the value concept of lean management to improve the performance of an emergency department (ED). This paper aims to analyze on patient perceived value (PPV) to apply lean management principles in the ED. The DEMATEL (Decision Making Trial and Evaluation Laboratory) method has been suggested to specify the influence degrees of these values in ED. The results show that the “availability of equipment” value has remarkable influence on the other values.
- Copyright
- © 2016. the authors. Co-published by Atlantis Press and Taylor & Francis
- Open Access
- This is an open access article under the CC BY-NC license (http://creativecommons.org/licences/by-nc/4.0/).
1. Introduction
Lean production is a technique which sets on the philosophy of targeting to eliminate waste and to increase production efficiency in a system. The business, which doesn’t specify the rising of productivity as one of basic goals in the growing competitive environment, will be forced with regard to competitive in long term. The decline of productivity can be led to decreasing of business’ market share, sales and profit. Therefore, productivity can be admitted as one of the most important performance indicators of business. After the second war, Eiji Toyoda and Taiichi Ohno pioneered to lean production concept in Japan. Japan achieved current economic superiority in short time after other Japan businesses and industries had implemented the lean production too. Lean management principles (Value, value stream, flow, pull, perfection) have been implemented firstly in automotive industry in Japan and then expanded to the other industries and countries. Anymore, these principles have been applied to service sector such as health, bank and logistics in nowadays.1
The main goal of lean management is to eliminate or reduce of non-value adding works, which must not be done under the current work circumstances, to increase the system productivity. Value concept, which is the first step of lean management principles, must be determined accurately in order to implement the lean management principles. Value concept that the producer creates for customers can only be specified by the customers according to the lean management perspective. The producers must firstly improve the communications with their customers. The wastes will be eliminated after the customers specified the value. The more accurate value definition provides the better lean management. Seven wastes, which are defects, overproduction, transportation, unnecessary processing, waiting, inventory, and unnecessary movement, should be considered while defining the value in a system.
Improving efficiency and quality, and reducing costs are some of the fundamental goals of healthcare institutions. When these institutions struggle to implement these goals, they must develop the service, which provides more care to patient safety, minimizes or eliminates the waste and errors, and decreases the waiting times in the healthcare institutions. Patients can be satisfied due to the aforementioned services that might be applied in the healthcare institutions.
The basic objective of this paper is to analyze on PPVs that can be done to apply the lean management principles in an ED of a public hospital. In this scope, PPVs in the ED can be determined according to a questionnaire responded by an expert team.
The rest of this paper is presented as follows: The related literature review is presented in Section 2. The recommended multi-criteria decision making model is summarized in Section 3. Following that, the implementation of the recommended method is demonstrated on value concept of lean management in an ED in Section 4. A sensitivity analysis is realized in Section 5. Finally, the paper ensures conclusions and directions for future research in Section 6.
2. Literature Review
Literature review of this paper is discussed about three parts that are applications of lean management principles in ED, DEMATEL, and PPVs, respectively.
Kim et al. presented that the healthcare sector can achieve the same successful output that the manufacturing industries have obtained using lean production methods. They implemented the value stream mapping (VSM) to show information and material flow among processes of a hospital.2
Joosten et al.3 provided an overview of lean implementation efforts to improve healthcare delivery. They stated that lean thinking reduces the waiting times in healthcare but it will be fail in the long period. Dickson et al.4 considered patient flow, patient satisfaction, waiting time etc. measurements from before and after lean application in four EDs, which include 2 community and 2 academic EDs. The results showed that the waiting times of patients are decreased in three of EDs by using VSM despite increasing patients in all EDs. Dickson et al.5 presented the application including a six-step process of lean education, ED observation, patient flow analysis, process redesign, new process testing, and full application. Measurements including patient satisfaction, expense per patient, ED length of stay (LOS), and patient volume were compared by using VSM about two years.
Richard6 critically reviewed eighteen papers describing the application of lean in fifteen EDs in Australia, Canada, and the United States. He considered an analytic approach that achieved six core questions about the influences of lean on an ED patient care, processes, employees, and work structures. Lean provided important improvement chances despite some theoretic, practical and methodological concerns. Vermeulen et al.7 examined that the program decreased waiting times on ED but its utilities were diminished when compared with that of control sites, which were exposed to system-wide initiatives such as public reporting and pay for performance. This paper proposed that further assessment of the effectiveness of lean approach in the ED were guaranteed before widespread implementation.
Buyukozkan et al.8 proposed the fuzzy AHP (analytic hierarchy process) to assess the recommended service quality framework in a healthcare sector. Ho9 presented the fuzzy AHP to define weight assessment on evaluation indexes according to the customers in Health Management Center. Aktas et al.10 proposed the AHP to determine the importance degrees of the service quality parameters in the hospitals.
The value concept is adopted as a basic step to establish lean healthcare management. The value concept is the first phase of lean management. If it is determined accurately, the lean management ensures many benefits in the system. But the wrong value concept selection triggers the other phases of lean management. A value concept in the system affects to the other value concepts. The highest non-value adding works is eliminated from the system in the lean management. As it can be seen in above works, many prior researches haven’t extensively considered the value concept for lean healthcare management. They determined a value concept by helping a case study or judgments of experts. These approaches are simply affected by subjectivity of humans. A multi criteria decision making method is proposed to overcome this limitation and to present a better way. The prior researches haven’t also considered the influence of a value concept on the other value concepts. It is important issue because the goal of lean management is to eliminate possibly non-value adding works so that it is to establish a productive system. We present the DEMATEL method to show the relations between the all value concepts in the system.
It is very common to employ the DEMATEL approach to evaluate criteria in the last decades. The DEMATEL approach has been used in various problems such as business process management evaluation11, logistics12, human resource selection13, vehicle fleet maintenance management14, facility layout problem15, supplier selection16, electronic design automation17, school selection18. The prior works use the DEMATEL method for many applications but this paper is the first application in the lean management field.
The concept of ‘customer perceived value’, which is also called as ‘customer value’ or ‘perceived value’, appeared as the describing company issue in the 1990s. It has progressed to attract wide research theme in the current century. Understanding where value presents from the viewpoint of the customer has become crucial for most firms, because higher customer satisfaction leads to achieve customer retention and loyalty, a stronger competitive advantage, greater market share.19 Chang and Wang20 investigated the relationship between customer’s satisfaction and loyalty by considering the impacts of customer perceived value. Chen and Hu21 defined how customer perceived value based on determinant attributes of service quality presented in the coffee outlet industry. Schultz et al.22 aimed to identify the patient perceived value of non-financial obstacles impeding patients with insurance coverage from receiving medication therapy management services. Some authors23–25 studied to analyze the effects of patient perceived value in order to improve hospital services.
Due to an increasing number of healthcare organizations, the chances of option are increasing for customer (patient). The defining of the patient perceived value is very important for healthcare organizations. Currently, not only state-owned health organizations but also privately owned health institutions provide services. Value analysis is crucial to present an effective health management in this competitive environment. The value step, which is the most important and fundamental step on the implementation of lean management, should be analyzed more clearly and efficiently. The studies related to the value will be a forefoot for continuous improvement activities. It will constitute the first step for the healthcare that intends to the implementation of lean management. Although there are many studies on the identification in the literature, any study does not reconcile the patient perceived value to lean management with the using of DEMATEL method in group decision making environment. This study reinforces the effectiveness of implementation by using a multi criteria decision making method in addition to continuous improvement techniques of lean management. In this study, the value concept can be determined according to patients’ needs by the expert team with using DEMATEL method. DEMATEL approach will be the key role for identifying value that varies the perception from one patient to the other patients. While value analysis in the literature aims generally to improve sales, marketing and profit of a firm, this study presents the value analysis to apply a successful lean management in an ED.
3. DEMATEL Method
This paper considers employing DEMATEL method for lean implementation in an ED. The impact of each criterion on other criteria is established with DEMATEL by considering dependent relationships between these criteria.
DEMATEL method, which can define the relationships among the effects and causes of criteria into interdependent and complicated problems, has been developed by Science and Human Affairs Program of the Battelle Memorial Institute of Geneva between 1972 and 1976.26,27 DEMATEL method has been widely used for the various problems most recently. Graph theory based the DEMATEL method enables us to construct and solve problems visually so that we may separate the relevant factors into cause and effect groups in order to better understand the causal relationships.28
The fundamental steps of the DEMATEL method are demonstrated as follows: 14,28
Step 1: Define the weighted average matrix. Suppose that there are h experts to solve a complex problem in the observed questionnaire and n factors that are to be considered. Each expert should define the level of influence of factor i to the factor j by using Table 1. The comparative analysis of couple of factors i and j by expert k provides us a n×n non-negative answer matrix
| Definition | Numerical values |
|---|---|
| No influence | 0 |
| Low influence | 1 |
| Medium influence | 2 |
| High influence | 3 |
| Very high influence | 4 |
The influence levels of criteria.
Based on defined answer matrices from each of the all h experts, we can compute the weighted average answer matrix A as follows:
Matrix A represents not only the direct influence caused by a specific factor, but also the direct influence it takes from other factors.
Step 2: Compute the normalized direct-relation matrix. We can obtain a normalized direct relation matrix M from the matrix A by using a simple formula as follows:
Matrix M is called the normalized direct relation matrix. The formula
Step 3: Compute the total relation matrix.
Step 4: Define a threshold value and achieve the impact-relations digraph map. The threshold value can be defined by averaging of values in total relation matrix. In this study, the cause for employing the average of the values is to get away the decision maker’s bias. To achieve a convenient impact-relations digraph map, decision makers or experts through discussion must define a threshold value for the degree of influence. The specified factor that has an influence in matrix T smaller or equal than the threshold value should be filtered out and doesn’t show the relationships with another. The factors that have an influence in matrix T are higher than the threshold value should be chosen and indicated into the impact-relations digraph-map.14
4. Value Analysis with Using DEMATEL in the ED
A real life application is analyzed in order to provide the better understanding of the proposed approach. Fig. 1. shows a flow diagram for the analysis of PPVs in ED. In this study, value analysis procedure begins to assign the four experts committee comprising of one academic expert in lean management domain, two nurses and one doctor. They have work experience more time than five years. They deal with many patients every day so that they know what the patients want. This application is performed in an ED of a public hospital which is located in Turkey. The managers of the ED want to establish the lean healthcare management. However, they have some concerns about defining of the patient perceived value. Value concept that is the first step of lean management principles must be determined accurately in order to implement the lean management principles so that a decision in the beginning of the lean management process application can be triggered to its next steps. To evaluate the specified criteria, this paper proposed the DEMATEL approach in group decision making environment which presented in Section 3. Value analysis process in the ED includes assigning of expert decision makers to evaluate criteria, determining criteria about value analysis, determining impacts of a criterion on other criteria. PPVs in the ED of the public hospital can be defined according to a survey responded by an expert team of four decision makers E1, E2, E3 and E4. Value analysis in the ED can be presented as six basic criteria by the expert team. These are hygiene (C1), accuracy (C2), caring (C3), timeliness (C4), skill of staff (C5), and availability of equipment (C6) in Table 2. The DEMATEL method can be used to define the interdependence among each criterion. The importance degree of decision makers are assigned in order to show their differences in the group decision making problem so that the importance degrees of E1, E2, E3 and E4 decision makers can be defined as (0.35,0.30,0.20,0.15).
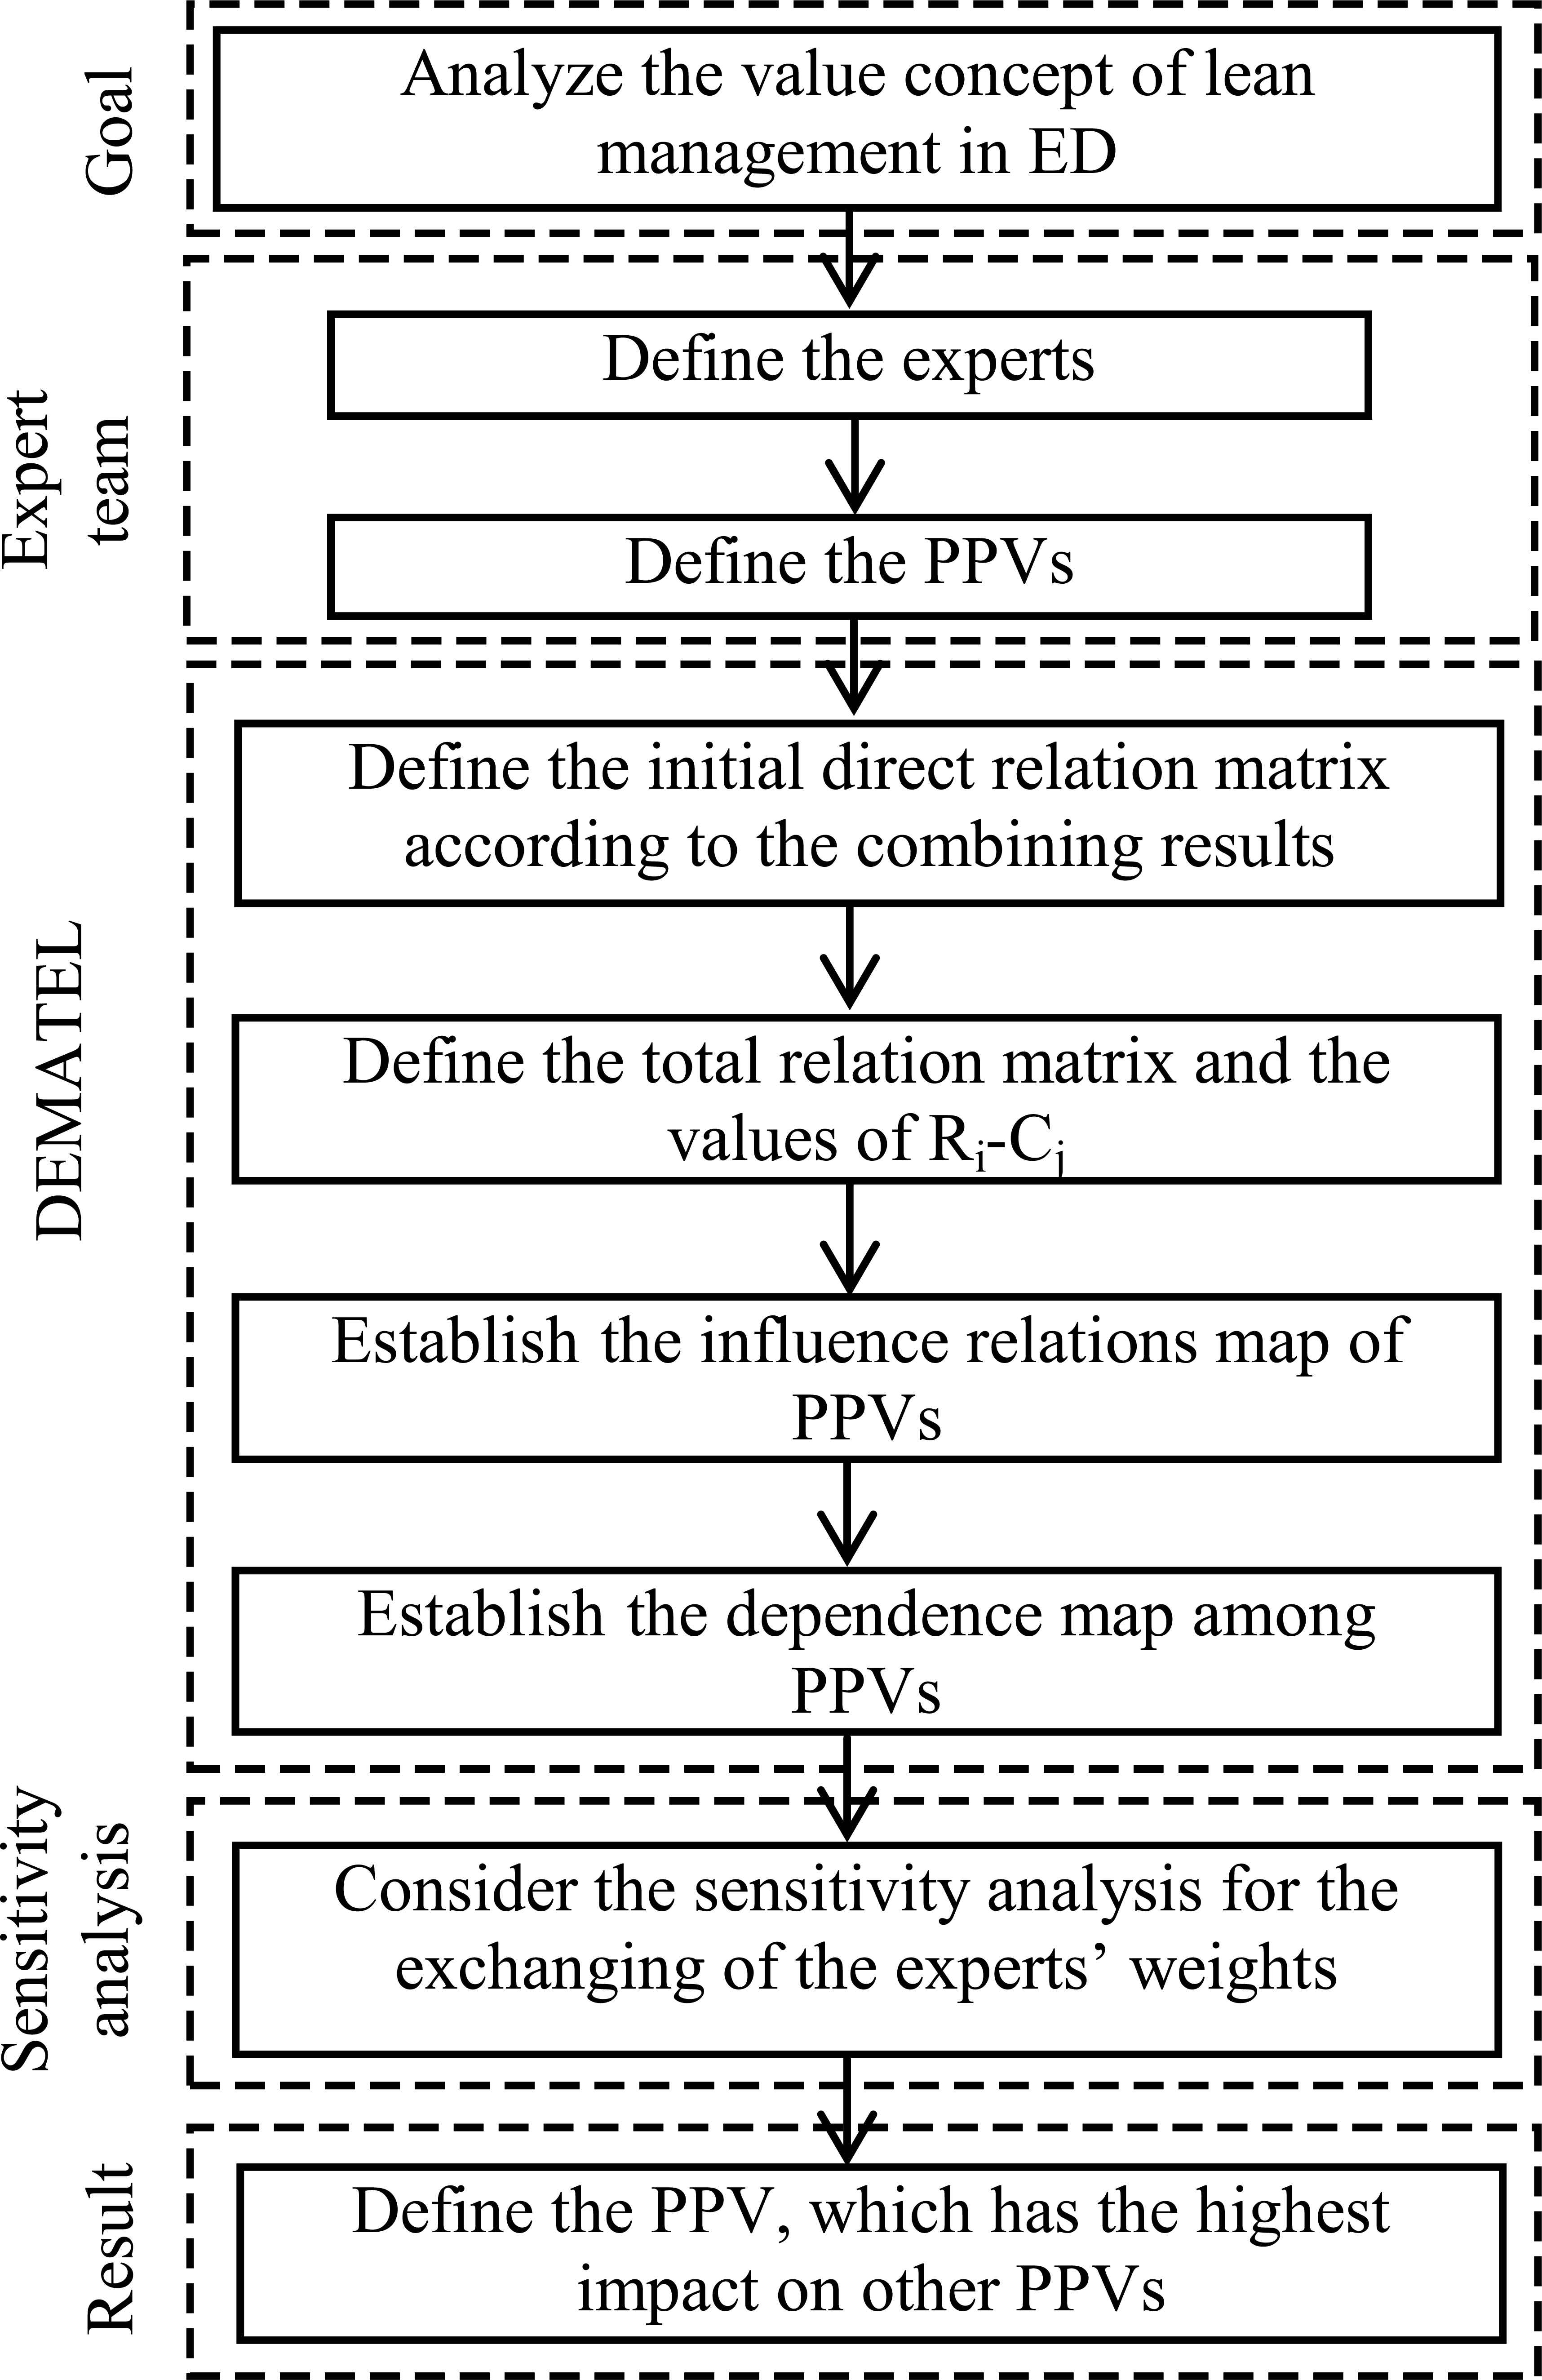
The flow diagram for the analysis of PPVs in ED.
| Values | Description |
|---|---|
| Hygiene (C1) | Hygiene of the staff and ED |
| Accuracy (C2) | Accuracy of the presented information such as cost, diagnose of the disease |
| Caring (C3) | Kindness to patients, understanding the requirements of patients |
| Timeliness (C4) | Competence to ensure the service on time |
| Skill of staff (C5) | Experience, achievement and ability of staff |
| Availability of equipment (C6) | The availability of equipment in the ED to present a favorable service |
PPVs in the ED.
The initial direct relationship matrix presented by four decision makers is exhibited in Table 3 so that it shows each criterion has direct influence on other criteria. These evaluations are transformed by helping of Table 1. The direct relation between criteria C2 and C3 for expert 1 (E1) in Table 3 is shown with numerical value 3. This means that the availability of C2 influences the availability of C3 as high influence degree.
| E1 | E2 | |||||||||||
|---|---|---|---|---|---|---|---|---|---|---|---|---|
| C1 | C2 | C3 | C4 | C5 | C6 | C1 | C2 | C3 | C4 | C5 | C6 | |
| C1 | - | 2 | 1 | 2 | 1 | 1 | - | 1 | 0 | 0 | 2 | 3 |
| C2 | 1 | - | 3 | 3 | 3 | 3 | 4 | - | 4 | 2 | 4 | 1 |
| C3 | 1 | 2 | - | 3 | 1 | 0 | 2 | 4 | - | 3 | 4 | 0 |
| C4 | 2 | 2 | 3 | - | 2 | 2 | 4 | 2 | 3 | - | 3 | 2 |
| C5 | 2 | 2 | 3 | 2 | - | 3 | 4 | 4 | 4 | 3 | - | 2 |
| C6 | 3 | 2 | 2 | 2 | 2 | - | 4 | 2 | 2 | 3 | 4 | - |
| E3 | E4 | |||||||||||
| C1 | C2 | C3 | C4 | C5 | C6 | C1 | C2 | C3 | C4 | C5 | C6 | |
| C1 | - | 0 | 0 | 3 | 0 | 0 | - | 3 | 3 | 2 | 3 | 2 |
| C2 | 3 | - | 3 | 3 | 3 | 3 | 2 | - | 2 | 2 | 2 | 2 |
| C3 | 3 | 2 | - | 3 | 2 | 2 | 2 | 2 | - | 2 | 2 | 2 |
| C4 | 0 | 1 | 1 | - | 3 | 1 | 0 | 1 | 2 | - | 1 | 2 |
| C5 | 4 | 0 | 3 | 3 | - | 2 | 4 | 3 | 3 | 2 | - | 3 |
| C6 | 4 | 3 | 3 | 3 | 1 | - | 3 | 4 | 3 | 2 | 3 | - |
The initial direct relation matrix of four experts.
Eq. (1) is utilized to aggregate the opinions of four experts so that the weighted average answer matrix A is presented in Eq. (2). The normalized direct relation matrix is calculated by using Eqs. (3)–(4) and is presented in Table 4. The total relation matrix is calculated by using Eq. (5) and Table 5 presents the degree of total relation among the criteria. The terms of T, Ri, Cj, and Ri-Cj can be calculated by using Eqs. (6)–(8) and the values of Ri-Cj are shown in last column of Table 5. Ri-Cj is a good parameter to prioritizing the criteria. The criterion getting higher value of Ri-Cj has higher impact on other criteria and also higher importance degree so that the final result can be identified from two views.
| C1 | C2 | C3 | C4 | C5 | C6 | ||||||
|---|---|---|---|---|---|---|---|---|---|---|---|
| C1 | 0.000 | 0.104 | 0.057 | 0.115 | 0.100 | 0.111 | |||||
| C2 | 0.176 | 0.000 | 0.226 | 0.183 | 0.226 | 0.161 | |||||
| C3 | 0.133 | 0.186 | 0.000 | 0.204 | 0.161 | 0.050 | |||||
| C4 | 0.136 | 0.118 | 0.176 | 0.000 | 0.168 | 0.129 | |||||
| C5 | 0.237 | 0.168 | 0.237 | 0.179 | 0.000 | 0.179 | |||||
| C6 | 0.251 | 0.179 | 0.168 | 0.179 | 0.183 | 0.000 | |||||
The normalized direct relation matrix for the combining result of four experts.
| C1 | C2 | C3 | C4 | C5 | C6 | Ri-Cj | |
|---|---|---|---|---|---|---|---|
| C1 | 0.410 | 0.434 | 0.440 | 0.485 | 0.464 | 0.394 | -1.932 |
| C2 | 0.893 | 0.624 | 0.886 | 0.855 | 0.865 | 0.670 | 0.979 |
| C3 | 0.694 | 0.642 | 0.549 | 0.718 | 0.671 | 0.471 | -0.528 |
| C4 | 0.697 | 0.590 | 0.692 | 0.544 | 0.671 | 0.526 | -0.563 |
| C5 | 0.939 | 0.769 | 0.890 | 0.853 | 0.679 | 0.683 | 0.652 |
| C6 | 0.927 | 0.754 | 0.817 | 0.828 | 0.811 | 0.517 | 1.392 |
The values of Ri-Cj and the total relation matrix.
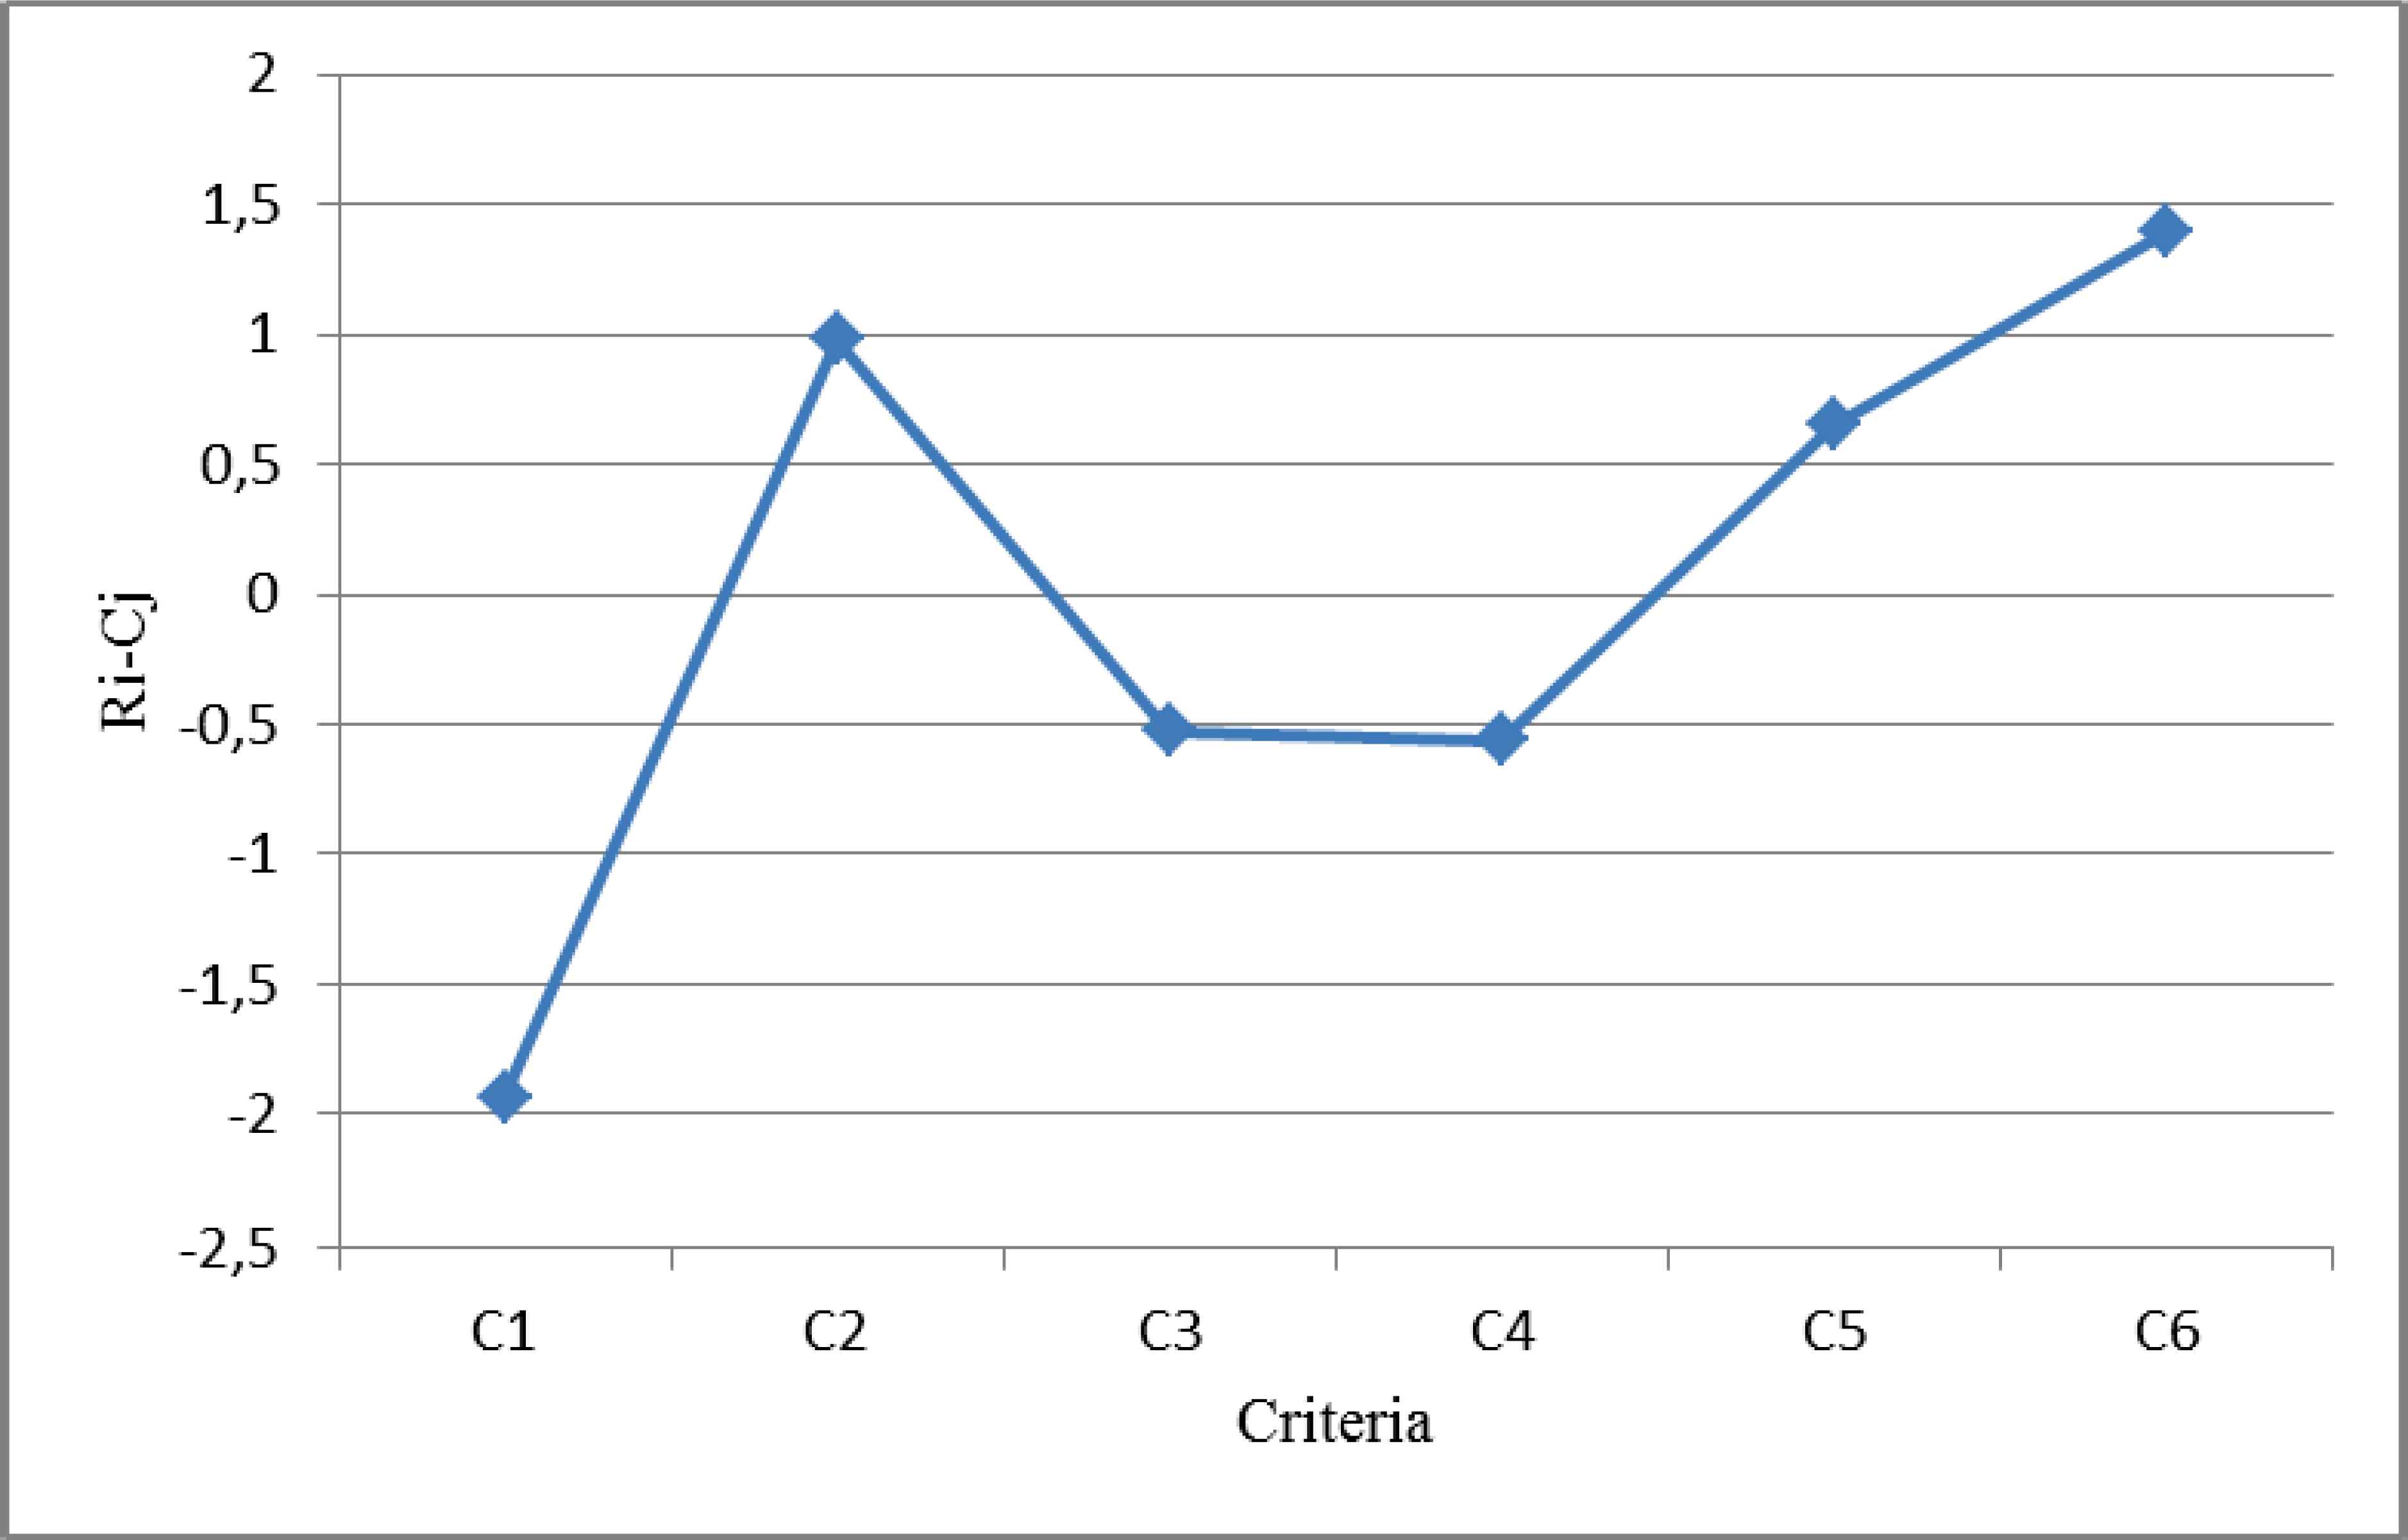
C1, C3, and C4 are net receivers due to negative values of their Ri-Cj and the related criteria receive more influence from another. C2, C5, and C6 are net causers due to positive values of their Ri-Cj and the related criteria have higher influence on another.
Each criterion affects to the other criteria and itself but the criteria, which have higher influence, are more significant. Table 5 shows that six value concepts influence to each other and themselves but small influence degree is negligible to define the PPVs. As it can be seen in Table 5, C1 influences C2 with 0.434 influence degree proportion but C2 influences C1 with 0.893 influence level proportion. This result means that C2 (accuracy) is more important than C1 (hygiene) in ED according to the patients. The “availability of equipment” criterion has the highest impact on other criteria according to value analysis of lean healthcare management so that it can be seen in Fig. 2. As a result, ameliorating the efficient of “availability of equipment” criterion will improve the efficient of the all system. Therefore, the “availability of equipment” criterion should be considered primarily while implementing the lean management in the ED. The successive principles such as value stream, flow will be proceeding based on “availability of equipment” value concept.
Influence relations map of the criteria.
C2 (accuracy), and C5 (skill of staff) criteria have higher influence on other criteria so that these criteria have higher values of Ri-Cj. Hence, C2 and C5 can also be determined as PPVs. The criteria are classified into two groups that include PPVs (C2, C5 and C6) and non-PPVs (NPPVs) (C1, C3, and C4). It can be recognized that the sum of values between NPPVs (2.572) is higher than that of the PPVs (2.082) according to the last row of Table 5 so that PPVs have higher impact to NPPVs according to “availability of equipment” value concept. Its calculation is as follows:
It means that if the success of PPVs is ameliorated, the success of NPPVs can be significantly simplified. It can be recognized to consider C2, C5 and C6 criteria as PPVs.
It is necessary to optimize “availability of equipment”, “accuracy”, and “skill of staff” criteria to improve the efficiency of ED, respectively.
Impact relations map of interdependences provides better understanding the relationship between each criterion in the structure of the model. We used a threshold value and it is suggested by the expert team. Threshold value, which filters out negligible effects in the matrix T, is suggested as 0.700 by the expert team. The each elements tij of matrix T, which are smaller or equal than the threshold value 0.700, is defined to zero, while other elements tij of the matrix T, which are larger than the threshold value 0.700, show that i criteria affects j criteria. Fig. 3 indicates the impact relations map of interdependence between the observed criteria.
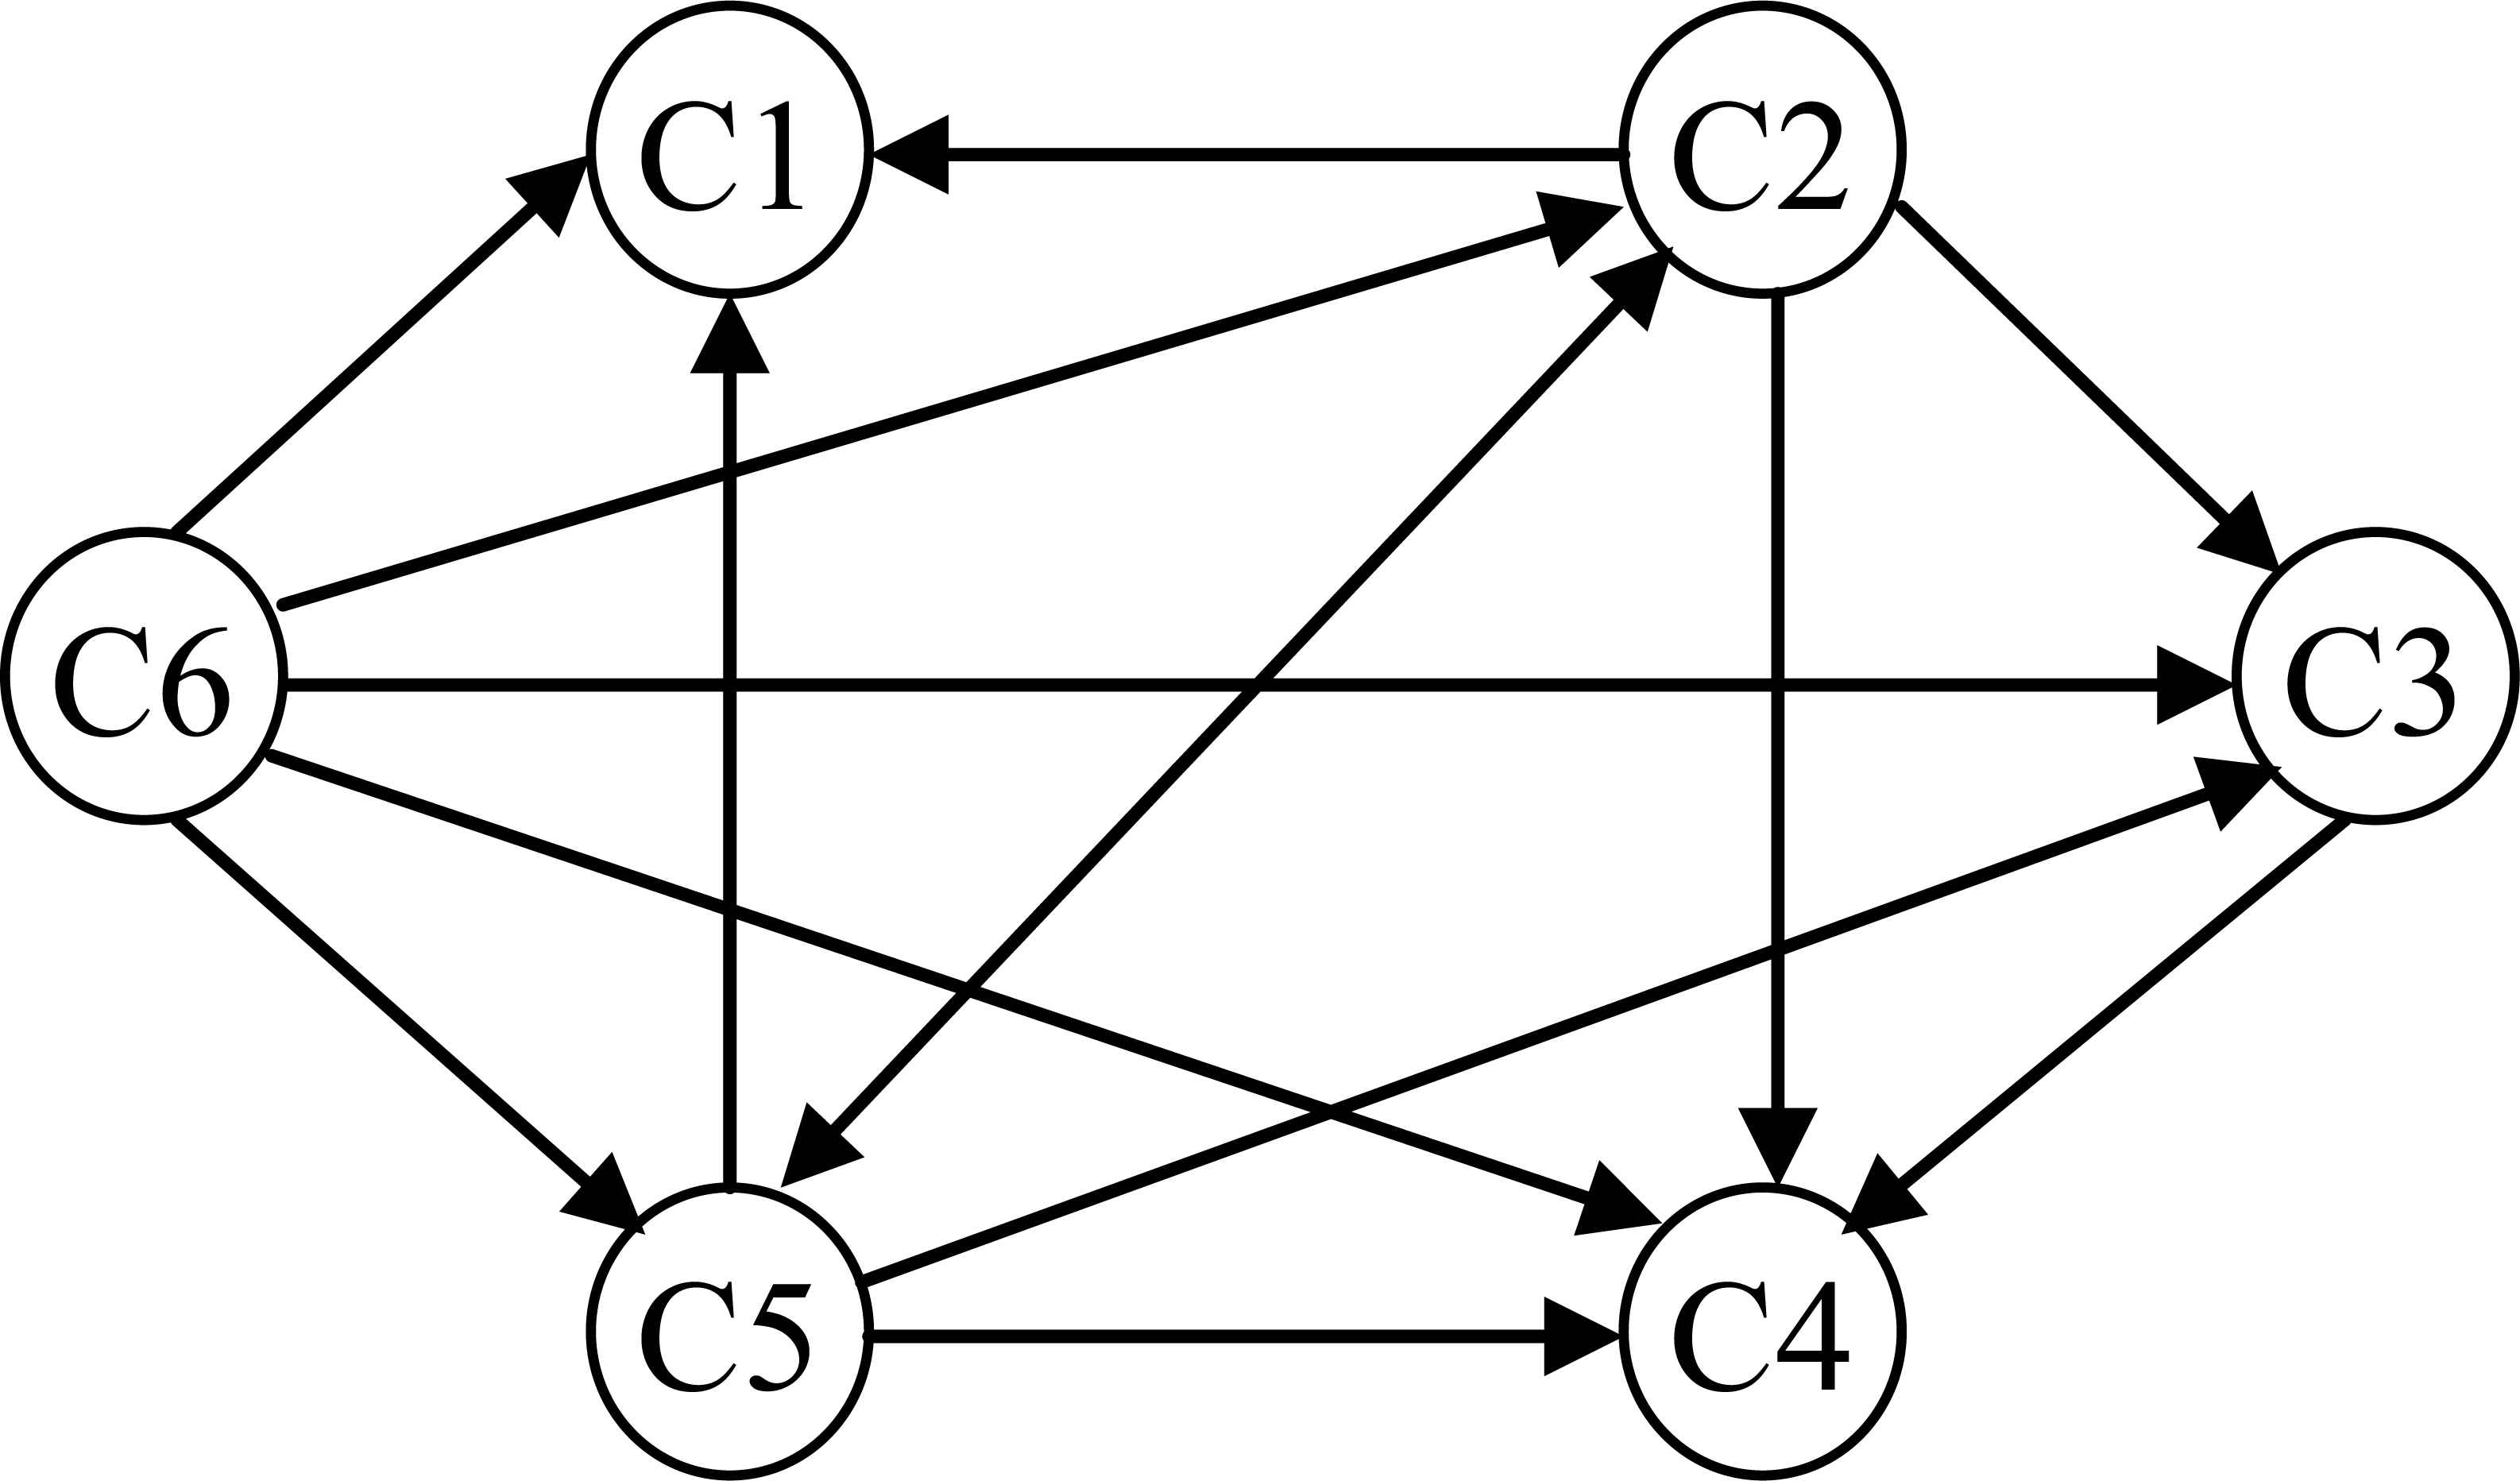
Dependence map among criteria.
5. Sensitivity Analysis
The sensitivity analysis aims to exchange each expert’s weight with another expert weight while the weights of other experts remain unchanged. 6 different calculations are performed with four experts.
This sensitivity analysis investigates the effect of exchanging of each expert’s weight on criteria influence relations. For example, E1-2 means that the weights of expert 1 and expert 2 are exchanged so that new weights of E1 and E2 are 0.30 and 0.35, respectively. With the updated weights of experts, the new final influence relations of criteria are obtained as indicated in Fig. 4. It is obvious that the values of Ri-Cj are sensitive for exchanging of each expert’s weight according to Fig. 4.
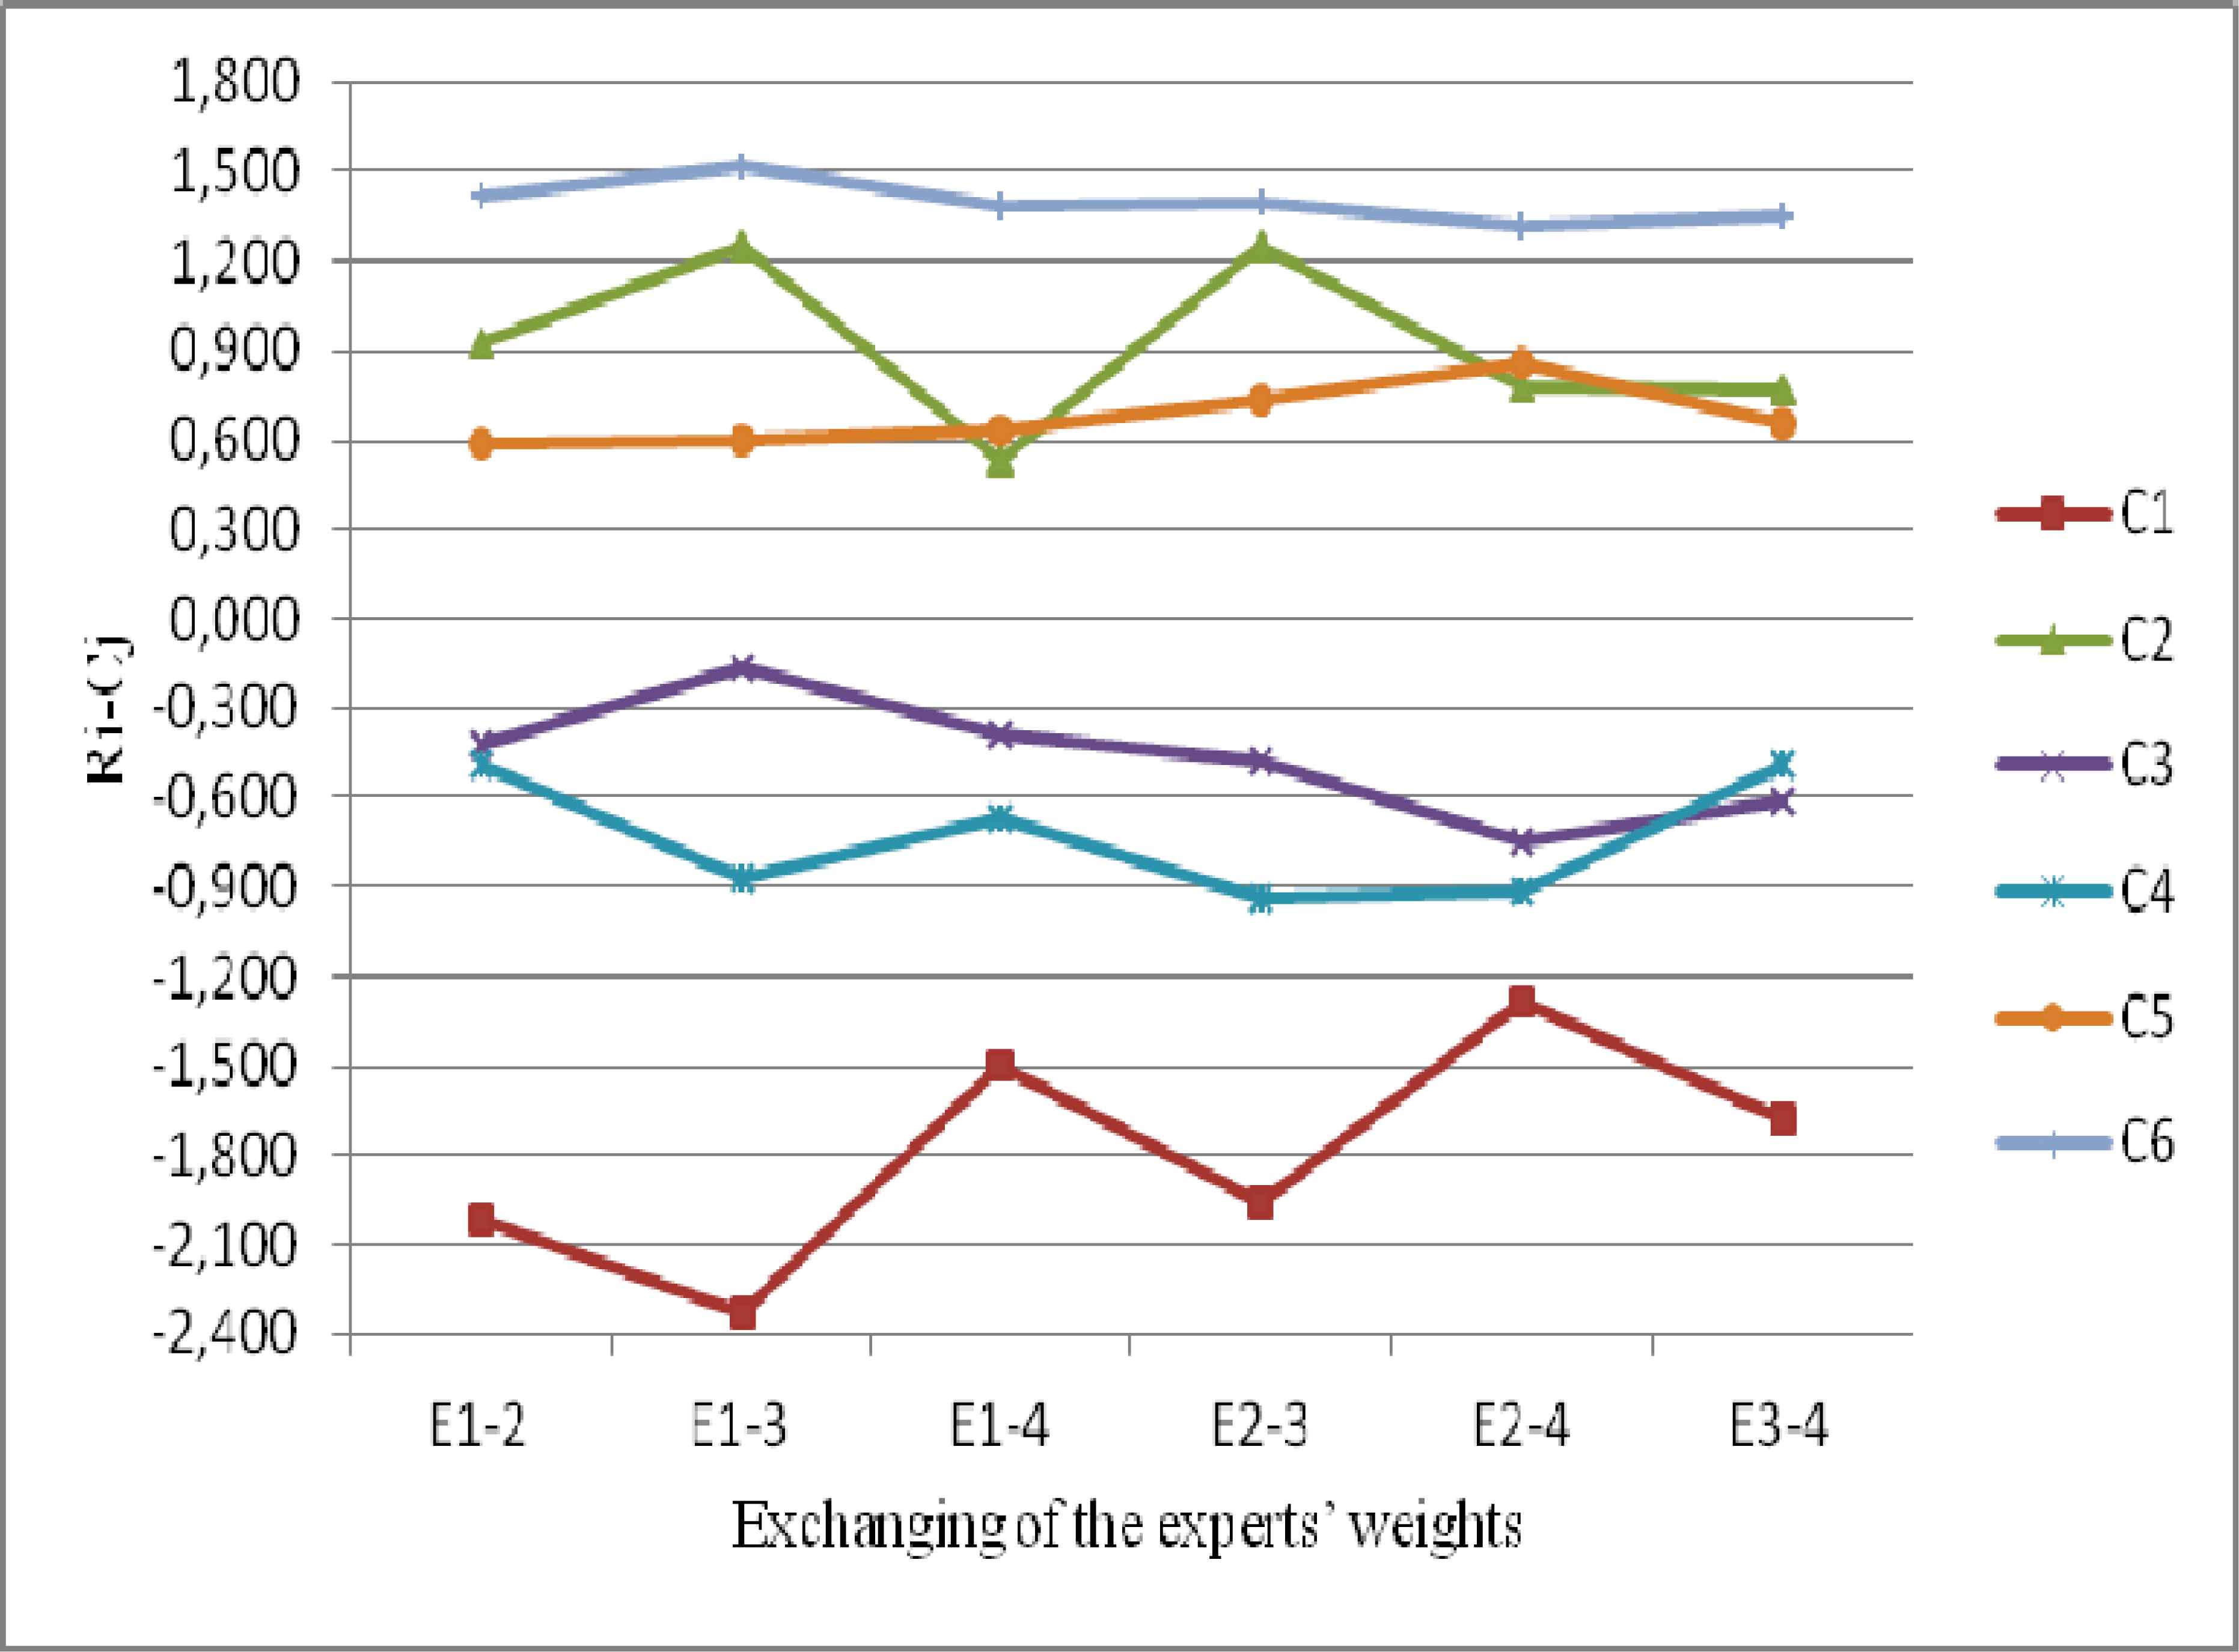
Sensitivity due to exchanging of the experts’ weights.
C6 criterion has higher importance degree for six different calculations due to higher values of Ri-Cj. C1 criterion has lower importance degree for six different calculations due to lower values of Ri-Cj. C1, C3, and C4 are net receivers (NPPVs) and C2, C5, and C6 are net causers (PPVs) so that it can be identified from results. C6 remains higher importance degree in all computations so the managers of the ED must firstly improve C6 (availability of equipment) criteria for lean healthcare management.
6. Conclusion and Future Research
Healthcare institutions must present the service based on value concept of patients so that waste will be eliminated or minimized with using accurate value concept. The value concept is the most crucial and basic phase on the application of lean management. There is no study about how to define the value concept though it is called the purification of waste and the customer oriented. The prior researches determined a value concept by helping a case study or judgments of experts so that these approaches are simply affected by subjectivity of humans. A multi criteria decision making method is proposed to overcome this limitation and to present a better way. This paper is the first in the field of identifying the patient perceived value with using DEMATEL approach in an ED of a public hospital. The prior works haven’t also considered the influence of a value concept on the other value concepts. This paper presents the DEMATEL method to show the relations between the all value concepts in the system. The value concept step will be analyzed more clearly and efficiently. The proposed approach will be the key role for defining value that varies the perception from one patient to the other patients.
The patients’ needs associated with ED can be defined according to a questionnaire responded by an expert team. This study evaluates six criteria for value concept of lean management by using DEMATEL approach and presents that “availability of equipment” value has the highest impact on other values according to value analysis of lean healthcare management.
Future study can compare different multi criteria decision making methods such as analytic network process, AHP with the results from the proposed method. VSM, 5S, Visual Management, one-piece flow techniques can be suggested for the successive principles of lean management. This is one of the directions in our further study.
Acknowledgements
The authors would like to thank to the editor and anonymous reviewers whose insightful and constructive comments have improved the paper greatly.
References
Cite this article
TY  - JOUR
AU  - Burak Efe
AU  - Ömer Faruk Efe
PY  - 2016
DA  - 2016/08/01
TI  - An Application of Value Analysis for Lean Healthcare Management in an Emergency Department
JO  - International Journal of Computational Intelligence Systems
SP  - 689
EP  - 697
VL  - 9
IS  - 4
SN  - 1875-6883
UR  - https://doi.org/10.1080/18756891.2016.1204117
DO  - 10.1080/18756891.2016.1204117
ID  - Efe2016
ER  -