
A two-stage hybrid classification technique for network intrusion detection system
Aizawl, Mizoram, Tanhril, 796004, India: E-mail: jamal.mzu@gmail.com
E-mail: rinfelc@gmail.com.
- DOI
- 10.1080/18756891.2016.1237186How to use a DOI?
- Keywords
- Intrusion Detection Systems; Support Vector Machine; Artificial Neural Network; Machine Learning; NSL-KDD
- Abstract
Conventional Network intrusion detection system (NIDS) mostly uses individual classification techniques, such system fails to provide the best possible attack detection rate. In this paper, we propose a new two-stage hybrid classification method using Support Vector Machine (SVM) as anomaly detection in the first stage, and Artificial Neural Network (ANN) as misuse detection in the second. The key idea is to combine the advantages of each technique to ameliorate classification accuracy along with a low probability of false positive. The first stage (Anomaly) detects abnormal activities that could be an intrusion. The second stage (Misuse) further analyze if there is a known attack and classifies the type of attack into four classes namely, Denial of Service (DoS), Remote to Local (R2L), User to Root (U2R) and Probe. Simulation results demonstrate that the proposed algorithm outperforms conventional model including individual classification of SVM and ANN algorithm. The empirical results demonstrate that the proposed system has a reliable degree of detecting anomaly activity over the network data. Simulation results of both stages are based on NSL-KDD datasets which is an enhanced version of KDD99 intrusion dataset.
- Copyright
- © 2016. the authors. Co-published by Atlantis Press and Taylor & Francis
- Open Access
- This is an open access article under the CC BY-NC license (http://creativecommons.org/licences/by-nc/4.0/).
1. Introduction
The modern communication system has converted connectivity applications into a digital system, industries, institution and organizations associated with a complex computer network that results in huge service to society in an admirable approach with accurate high-speed connectivity. These advancements lead to increase the risk of an intrusion attempt over the network system. Due to these rapid changes, network intrusion detection system is becoming challenging areas of research in computer network security.
As shown by Ref. 1, our network system suffers from various security vulnerabilities, which activate to deny, disrupt, degrade and destroy services and information resident in the network system. The primary aim of the network attack was to compromise the integrity, availability or confidentiality of the network system that is done through the data stream on a computer network by an intruder. Therefore, Intrusion detection system (IDS) is intended to detect malicious or unauthorized activities on the network and block the intruder traffic connection to prevent the system from further damage. IDS first analyzed all the network traffic and raised an alarm to assists the network administrator if malicious attempts are found.
An IDS is designed to monitors network activity to identify malicious events. It functions in three stages namely, prevention, detection, and reaction.2 Intrusion detection is the process of identifying and responding to malicious activity targeted at computing and networking resources.3 So, numerous techniques and controls are normally adopted to prevent the network system from unauthorized and malicious attacks by implementing a firewall, antivirus, etc. If the intrusion penetrates the network systems even after installing preventive software, IDS acts as a next line of protection for the system.
Intrusion detection system can be broadly categorized into two main categories, Signature Based System (SBS) also called misuse based and Anomaly Based Systems (ABS).4 SBS rely on pattern matching techniques, containing a signatures database of known attacks and tried to match these signatures against the analyzed data. When a match is found, an alarm is raised. On the other hand, ABS first builds a statistical model describing the normal network traffic that defines the normal baseline profile model and then flags any behavior that significantly deviates from the model.
Although SBS is effective against known intrusion types, except it cannot detect new attacks that were not predefined. ABS, on the other hand, approaches the problem by attempting to find deviations from the established baseline normal profile model against the analyzed data, which gave the ABS ability to detect new types of attacks. However, it may also cause a significant number of false alarms because the normal behavior varies widely and obtaining a complete description of normal behavior is often difficult.5
Most of the detection techniques employed by IDS are SBS, which try to search for patterns or signatures of the already known attacks.6 The advantage of such kind of system is that signatures can be developed for known attacks and that are faster compared to ABS. However, the main disadvantage of the SBS techniques is that it can only identify already known attacks, which results in a lack of detection of the new or unknown attack.
As both anomaly and misuse detection techniques have their limitation, we combine the two techniques to overcome their drawback and proposed a new model combining the advantages of the two techniques that ameliorate performance over the conventional models.
2. Related works
Research has been carried out by numerous researchers for designing both anomalies based and signature based intrusion detection system using individual classification techniques. These techniques fail to provide the best possible attack detection; resulting hybrid approaches a major challenge for researchers.
Machine Learning (ML) techniques have been widely used by researchers to design anomaly detection problems in the network system. ML-based anomaly detection techniques attempt to build a model over the historical records containing normal and abnormal behavior of network data and then try to classify whether a new network packet data is normal or attack traffic.
Various researchers have used NSL-KDD and KDD99 dataset to demonstrate their experiment. Parallel hybrid classification proposed in Ref. 7 combined Self-Organization Map (SOM) with the C4.5 classifier. SOM module was designed to model normal behavior, any deviation from the baseline model is treated as an intrusion, the C4.5 module designed as misuse detection simply classify those intrusion data into corresponding attack type, the final decision was made by designed module called Decision Support System (DSC). DSC analyze results from each module by simply adding the output and claimed 99.8% detection accuracy along with 1.25% false alarm on KDD99 datasets that contain numbers of redundant data. Most hybrid IDS system trained the designed model independently and then simply aggregates the results of the individual model for final results.8 A hybrid IDS for anomaly classification in huge scale datasets using detectors generated based on Multi-start Metaheuristic System and Genetic Algorithms is proposed in Ref. 9, the proposed model has taken motivation from Negative Selection-based Detector Generation. The evaluation results demonstrate its effectiveness in generating a suitable number of detectors with an accuracy of 96.1% detection rate along with high degree of 3.3 % false positive rate. Naïve Bayes algorithm is used in Ref. 10 for anomaly based detection, employing 41 standard features from KDD99 dataset, and achieved a detection rate of 95% after removing 90% instances of the original datasets. The simulation results demonstrate that Naïve Bayes outperform ANN based approach by producing higher detection rate, consuming less time with a low-cost factor. “Enhanced Support Vector Decision Function” for feature selection was used in Ref. 11, based on two important factors, the feature’s rank and the correlation between the features, experimental results show that the proposed algorithms deliver an acceptable outcome in classification accuracy, training and testing time. Artificial Neural Networks with K-mean clustering algorithm is used in Ref. 12 which results in detection accuracy of 92%; the method applied K-means algorithm to the training set to select an optimal set of samples and a multi-layered network with a backpropagation mechanism classification. Combinations of SVM, Decision Tree (DT) and Simulated Annealing (SA) are introduced for anomaly intrusion detection system.13 The author claimed that SVM and SA can find the best-selected features to increase the accuracy of anomaly intrusion detection over KDD99 dataset and DT with SA can obtain decision rule for new attacks that improve an accuracy of the classification. Comparisons of nine different ML algorithms14 concluded that no algorithm can detect all attacks, means that every algorithm has its drawback. Recently, Ref. 15 proposed intelligent Dynamic Swarm-based Rough Set feature selection with simplified swarm optimization showing 93.3% detection rate. In 2014 author16,17 proposed a new hybrid NIDS model with feature selection combining Adaboost.M1 with Decision Tree classifier. Evaluation over the dataset demonstrates the superiority of the proposed model over other conventional hybrid model for two and five classes. Six different ensemble methods were experimented for NIDS on NSL-KDD datasets and conclude that, the combinations of Principal Component Analysis (PCA), feature selection in hybridization of Random Forest with Nested Dichotomies and Ensembles of Balance Nested Dichotomies (END), outperform other tested model with detection rate of 99.5% and 0.1% false positive.18 Artificial Bee Colony (ABC)19 was used for the first time to solve the intrusion detection problems, a new network intrusion detection system based on ABC searching algorithm has been proposed and compared with five traditional benchmarks classifier (Naïves Bayes, SVM, Classification tree, K-NN and C4.5 classifier). The evaluation results are quite encouraging, but the individual anomaly classification technique still suffered from anomaly detection drawback, which is high false positive. So this paper applied a hybrid two stages classification using Anomaly-Misuse technique to overcome the situation faced by the individual classification method.
3. Dataset description
This paper used NSL-KDD dataset20 to demonstrate the superiority of our proposed system. NSL-KDD dataset was an enhanced version of the KDD99 datasets KDD Cup 9921 created by the Defense Advanced Research Projects Agency (DARPA) at the MIT Lincoln Laboratories located in the United States of America. The KDD99 contains a huge number of repeated records of 78% and 75% redundant data on training and test dataset. The redundant datasets can harm the result of evaluation to the much higher degree of detection accuracy. The necessary adjustment made on KDD99 datasets results in a new NSL-KDD datasets. Table 1, 2 & 3 illustrate the detail modifications made between KDD99 with attack name and types of attack found in NSL-KDD. NSL-KDD dataset is not perfect and still suffered from some problem criticized by McHugh5, but as our main effort is on anomaly based NIDS, it can still be used as a testbed dataset for carrying out various experiments on NIDS. The NSL-KDD dataset classified the different attacks into four broad categories as mentioned below:
- •
Denial of Service (DoS): A DoS attack is a type of attack in which the intruder objectives is to block normally authorized access to services offered by a host or a network. The primary aim was to exploit memory resources exhaustively and prevents serving legitimate network requests, and hence denying users access to a machine or network. e.g., smurf, neptune, ping of death, back, etc.
- •
Remote to Local (R2L): A remote to local attack is an attack aiming at gaining access to a local account from another host or network. In this type of attack, user sends packets to a machine over the internet, and the user does not have access to to expose the machines vulnerabilities and exploit privileges that a local user would have on the computer, e.g. ftp_write, phf, multihop, etc.
- •
User to Root (U2R): These attacks are exploitations in which the intruder starts off on the system with a limited user account or normal user privileges and attempts to abuse vulnerabilities in the system to gain root access (system administrator privilege), e.g. perl, rootkit, etc.
- •
Probe: Probe is an attack in which the hacker scans a machine or a network to gather information or find known vulnerabilities. The goal of this information gathering is to learn about computer and services that are present in a network with known vulnerabilities that may later be exploited so as to compromise the system in future, e.g. satan, portsweep, nmap, etc.
| Normal | Anomaly | Total | |
|---|---|---|---|
| Original Records | 972,781 | 3,925,650 | 4,898,431 |
| Distinct Records | 812,814 | 262,178 | 1,074,992 |
| Reduction Rate | 16.44% | 93.32% | 78.05% |
Redundant records found in the KDD99 training dataset.
| Normal | Anomaly | Total | |
|---|---|---|---|
| Original Records | 60,591 | 250,436 | 311,027 |
| Distinct Records | 47,911 | 29,378 | 77,289 |
| Reduction Rate | 20.92% | 88.26% | 75.15% |
Redundant records found in KDD99 test data.
| Attack Type | Attack Name |
|---|---|
| Denial of Service (DoS) | back, land, neptune, pod, smurf, teardrop. |
| Remote to Local (R2L) | guess_password, ftp_write, imap, phf, multihop, warezmaster, warezclient, spy. |
| User to Root (U2R) | buffer_overflow, loadmodule, perl, rootkit. |
| Probing | satan, ipsweep, nmap, portsweep. |
Four attack types with corresponding attack name in NSL-KDD datasets.
4. The proposed classification algorithms
4.1. Support Vector Machine (SVM)
The SVM model was first introduced in Ref. 22. The basic idea of SVM is to increase the dimensionality of the samples so that they can be separable. Therefore, despite the usual trend toward dimensionality reduction, in SVM the dimensionality is increased. The idea is to find a hyperplane to place samples from the same class inside it. SVM with linear and non-linear kernels have become one of the most promising supervised learning algorithm and able to construct a nonlinear separating that is implicitly defined by a kernel function. In this paper, we treated categorizing network traffic into normal and abnormal activity using LIBSVM23 C-Support Vector Classification (C-SVC) multi-class classification, formulated by Ref. 22 & 24.
In this context, let given training vectors xi ∈ Rn, i = 1, 2,...,l, belong to two classes, and an indicator vector y ∈ Rl such that yi ∈ {1, −1}. Then to separate the datasets from its origin one needs to solve the following primal optimization problem:
In our research, we used LIBSVM(version 3.20) available at http://www.csie.ntu.edu.tw/~cjlin/libsvm, which is an integrated tool for support vector classification and can handle a binary class or multiclass SVM using Ref. 22 and 24 algorithm.
4.2. Artificial Neural Network
An ANN usually called Neural Network (NN), is a mathematical model or computational model that tries to emulate the structure and functional aspects of biological neural networks.25 ANN is adaptive parallel distributed information processing models that consist of:
- •
a set of simple processing units (nodes, neurons)
- •
a set of synapses (connection weights)
- •
the network architecture (pattern of connectivity)
- •
a learning process used to train the network
NN have the potential to address many of the problems encountered by rule-based approaches.26 They are designed to classify statistically significant variations from their established behavior. To apply this approach to IDS, we would first introduce training data representing attacks to the NN to adjust automatically coefficients of this network during the training phase. In other words, it will be required to gather data containing attack behavior and train the network with those collected data. After training the network, a particular number of performance tests with real network traffic data and attacks should be conducted.27 Instead of processing program instruction sequentially, NN based models on simultaneously explored several hypotheses make the use of numerous computational interconnected elements, this parallel processing may involve time-saving in abnormal traffic analysis.28
4.2.1. Backpropagation
Backpropagation is one of the most commonly used supervised artificial neural network algorithm.29 Backpropagation Figure 1 aims to train the network to achieve a balance between the ability to respond correctly to the input patterns that are supplied for training the network and the ability to give reasonable responses to input that is similar to that used in training. The training of a network by backpropagation involves three stages: The feedforward of the input training pattern, the calculation and backpropagation of the associated error and the tuning of the weights so that the forward pass produces an output vector for a given input vector based on the current state of the network weights. Since the network weights are initialized to random values, it is unlikely that reasonable outputs will result before training. The weights are adjusted to reduce the error by propagating the output error backward through the network. This process is where the backpropagation NN gets its name and is known as the backward pass; backpropagation uses the following sequences:
- •
Calculate error values for each node in the output layer.
- •
Calculate the error for the middle layer nodes.
- •
Alter the weight values to progress network performance using the Delta rule.
- •
Calculate the overall error to test network performance.
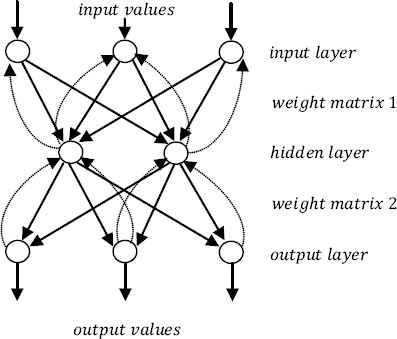
Backpropagation Neural Network.
The training set is repeatedly presented to the network, and the weight values are altered until the overall error is below a predetermined tolerance. Since the delta rule follows the path of greatest decent along the error surface, local minima can impede training.30
5. The proposed SVM-ANN (Anomaly-Misuse) hybrid designs
In this work, a network intrusion detection system utilizing both anomaly and misuse technique is proposed. The proposed architecture consists of data preprocess module, a detection and classification module integrating anomaly detection module (Stage-1) and misuse detection and classification module (Stage-2) followed by a final module called alarm module. Stage-1 used SVM to detect traffic anomalies that can be an intrusion and the stage-2 used ANN that further classifies attacks if they exist. The proposed hybrid intrusion detection system (Figure 2) illustrates the modules detail.
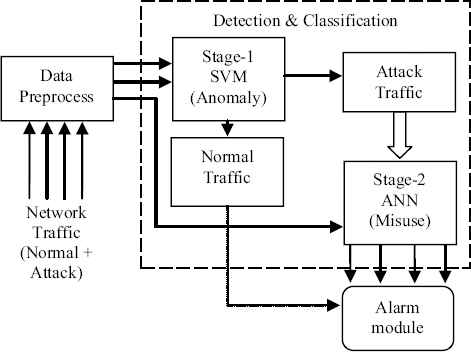
Diagram of the proposed model.
5.1. Data preprocess
The network traffic was first prepared and preprocessed in the data preprocess module. The two modules in stage-1 (SVM) and stahe-2 (ANN) classifiers have their supported data format, all the necessary conversion was performed by this module. Section 5.1.1 and 5.1.2 gives more detail explanation of the steps accomplished for stage-1 and 2 datasets. For our experimentation, we used full 41 features obtained from NSL-KDD datasets to demonstrate the superiority of our proposed architecture.
5.1.1. Dataset for first stage classifier (DFSC)
The NSL-KDD dataset was analyzed, after preprocessing and reducing redundant data, 161050 instances are selected for experimentation dataset. As shown in Table 4, trainsets get divided into five sets randomly, containing normal and attack data that appears in NSL-KDD dataset. The attacks included in NSL-KDD namely, back, land, neptune, pod, smurf, teardrop, satan, ipsweep, nmap, portsweep, guess_password, ftp_write, imap, phf, multihop, warezmaster, warezclient, spy, buffer_overflow, loadmodule, perl and rootkit. Two test datasets are selected randomly, 500 instances of unknown normal and 500 instances of the unknown attack were employed in the testset, unknown normal or attack means, the normal and attacks traffic data that has neither been used for training nor been seen by the network before. The datasets (Table 4) are used for training and testing stage-1 SVM (Anomaly) classifier.
| Dataset Name | No. of Feature | Normal | Attack |
|---|---|---|---|
| Trainset data 1 | 41 | 23665 | 8545 |
| Trainset data 2 | 41 | 21081 | 11129 |
| Trainset data 3 | 41 | 20206 | 12004 |
| Trainset data 4 | 41 | 24628 | 7582 |
| Trainset data 5 | 41 | 22101 | 10109 |
| Testset data 1 | 41 | 28084 | 4126 |
| Testset data 2 | 41 | 26854 | 5356 |
Distribution of data for first stage classifier.
5.1.2. Dataset for second stage classifier (DSSC)
DSSC consist of an attack instances, grouping all the 22 attack into four attack types, i.e., Denial of Service (DoS), Remote to Local (R2L), User to Root (U2R) and Probe. Detail attack types with corresponding attack name are described in Table 3. A trainset consists of 42000 instances employing examples of attack data. Testset consists of 42000 instances of attack data employing 500 unknown attack types; the fundamental idea was to test the reliability of proposed new hybrid algorithm against unknown or anomaly attack using misuse technique. Table 5 describes detail organizations of datasets for stage-2 ANN (Misuse) classification level for training and testing the network.
| Dataset Name | No. of feature | Attack category | Input |
|---|---|---|---|
| Train | 41 | DoS | 36110 |
| R2L | 102 | ||
| U2R | 9 | ||
| Probe | 5779 | ||
| Test | 41 | DoS | 35612 |
| R2L | 101 | ||
| U2R | 8 | ||
| Probe | 6279 | ||
Distribution of data for second stage classifier.
5.2. Detection and classification
In this section, we design two-stage network intrusion detection system using SVM as an anomaly at stage-1 and ANN as misuse at stage-2. The block diagram of the proposed model is shown in Figure 2. The NSLKDD datasets with full 41 original features are used to demonstrate the superiority of the proposed system. The network traffic mixed with normal and attack first passes through the stage-1 (SVM) which classifies the data into normal and attack classes. Stage-2 (ANN) modeled with attack traffic; further classify attack traffic into 4 similar attack groups. The two-stage architecture reduces the computational complexity while using the full features datasets, resulting higher degree of accuracy with low probability of false alarm rate
5.2.1. Stage-1: Anomaly detection module (SVM)
Multiclass-SVM (stage-1) anomaly classifier using Radial Basis Kernel Function was first modeled based on the training set seen in section 5.1.1 containing both normal and attack traffic. The test datasets that include unknown normal and attack are used to verify the anomaly module. The attack seen on the original datasets were grouped into two classes, i.e., normal and abnormal or anomalies. Anomalies are defined as the abnormal network behavior in the network. Detection of such activities is the main purpose of this module. The classification results were either normal or abnormal; all the abnormal traffic were passed to the next stage classifier where misuse technique did further detection and classification.
5.2.2. Stage-2: Misuse detection and classification module (ANN)
In this module, ANN (stage-2) classifier as misuse detection technique using the feedforward network with Resilient Backpropagation training function was modeled. The purpose of this module is to classify further the attack data from stage-1 into corresponding 4 classes classification strategies, i.e., Denial of Service (DoS), Remote to Local (R2L), User to Root (U2R) and Probe. In ML, misuse technique was first trained with the attack traffic to create a model that defines the baseline profile for attack traffic only. On the trained model, a testset was supplied to test whether the traffic is normal or abnormal. An alarm module was triggered if a match is found.
5.3. Alarm module
The purpose of this module is to interpret events results on both stage-1 and stage-2 module. It is the final module of the proposed architecture that reports the intrusion detection activity to the administrator or end user.
6. Experimental results
In this section, the superiority of the proposed method is carefully evaluated throughout experiments using the NSL-KDD datasets via normal classification, attack classification, false positive rate, false negative rate, true positive rate, detection accuracy and error rate. To evaluate the performance of the proposed method LibSVM (Matlab) and Neural Network Tool (Matlab) is used with Windows XP Professional as the test bed operating system on Intel i5 650 @ 3.20GHz processor, 4GB of RAM.
6.1. Stage 1 - Classification using SVM (Anomaly)
The SVM algorithm with Radial Basis Kernel Function was first trained for each training datasets. The datasets vector consists of 41 features, which is a full feature seen from NSL-KDD datasets as stated in section 5.1.1 DFSC is used to evaluate stage-1 anomaly classifier. DFSC contain 2 classes, i.e., normal and attack. After applying Radial Basis Kernel Function SVM to 5 different datasets with 2 common test datasets. Different kernel and parameter were evaluated to find the optimal solution, kernel and parameters are experimented aiming to improve the detection performance of the proposed model. The multiclass SVM was tested with parameter γ varied from 0.01 to 0.0001. When γ is 0.01, the multiclass SVM model loses its detection accuracy. As parameter γ decrease, the decision boundary of multiclass SVM becomes more flexible resulting the higher degree of detection accuracy, increase in parameter γ results to have a high false alarm. Thus, it appears appropriate to set parameter γ to 0.0001 for SVM with RBF kernal. Table 6 & 7 describes the detail simulation results obtained after setting the SVM model with appropriate γ on the datasets.
| Name | Train set 1 | Train set 2 | Train set 3 | Train set 4 | Train set 5 |
|---|---|---|---|---|---|
| Normal classification | 26854 | 26854 | 26738 | 26854 | 26838 |
| Attack classification | 5280 | 5346 | 5296 | 5310 | 5350 |
| False positive Rate (%) | 1.42 | 0.19 | 1.12 | 0.86 | 0.11 |
| False negative Rate (%) | 0 | 0 | 0.43 | 0 | 0.06 |
| True positive Rate (%) | 100 | 100 | 99.57 | 100 | 99.94 |
| Accuracy (%) | 99.76 | 99.97 | 99.45 | 99.86 | 99.93 |
| Error rate | 0.0024 | 0.0003 | 0.0055 | 0.0014 | 0.0006 |
SVM classification results on testset-1 based on various transet.
| Name | Train set 1 | Train set 2 | Train set 3 | Train set 4 | Train set 5 |
|---|---|---|---|---|---|
| Normal classification | 28081 | 28039 | 27842 | 28059 | 27960 |
| Attack classification | 4088 | 4121 | 4096 | 4103 | 4123 |
| False positive rate (%) | 0.92 | 0.12 | 0.73 | 0.56 | 0.07 |
| False negative Rate (%) | 0.01 | 0.16 | 0.86 | 0.09 | 0.44 |
| True positive Rate (%) | 99.99 | 99.84 | 99.14 | 99.91 | 99.56 |
| Accuracy (%) | 99.87 | 99.84 | 99.16 | 99.85 | 99.61 |
| Error rate | 0.0013 | 0.0016 | 0.0084 | 0.0015 | 0.0039 |
SVM classification results on testset-2 based on various trainset.
As shown in Table 4, the total input data of trainset 1 is 32210 records, 23665 normal and 8545 records as an attack. After applying SVM classification on trainset DFSC with C-SVC with RBF function (γ 0.0001), we get the classification result as trainset 1= 99.95%, trainset 2=99.95%, trainset 3=99.97%, trainset 4=99.90% and trainset 5=99.99%. In Table 6 & 7, highest accuracy achieved rate is 99.87 %(set 1) with 0.92% false positive and 99.97% (set 2) with 0.19% false positive rate which is extremely low false alarm rate. Each training set gets evaluated with two testset-1 and testset-2, simulation results shown in Figure 3 demonstrate that trainset-1 with testset-1 and trainset-2 with testset-2 scores 99.87 % having 1614 support vectors and 99.97 % having 1389 support vectors with an error rate of only 0.0013 and 0.0003, low false positive of 0.92% and 0.19%. Figure 4 & 5 demonstrate ROC curve for a trainset-1 with the testset-1, trainset-2 with the testset-2 showing comparative results.
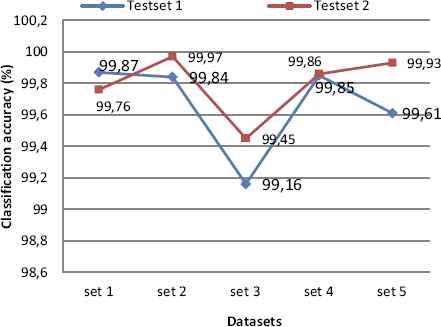
SVM classification accuracy on the testset.
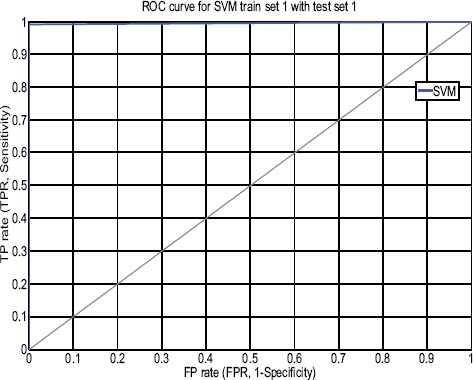
ROC curve for SVM (stage-1) testset-1 with trainset-1.
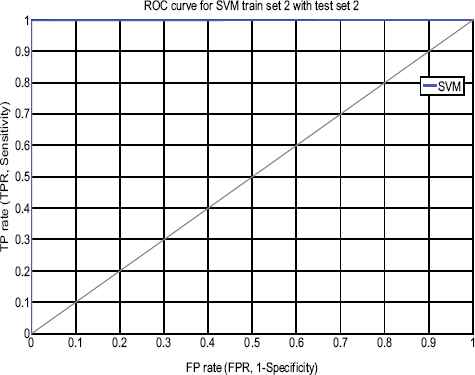
ROC curve for SVM (stage-1) testset-2 with trainset-2.
Evaluation of each simulation results was carefully monitored and measured based on numerical evaluation stated in Ref. 31 i.e., Accuracy rate, false positive rate (FPR), false negative rate (FNR) and true positive rate (TPR) using the following equations (2), (3), (4), (5), (6), (7) and ROC curve which is the key point to measure and determine reliability of the proposed system.
False positive are normal data that the system used to detect as attack data. The false positive alarm rates, calculated as the number of normal instances that were classified as attack divided by the total number of normal instances. False negative alarm rate, calculated as the total number of attack instances that were classified as normal divided by the total number of attack instances. Recall or Sensitivity or True positive rate, calculated as the proportion of positive cases that were correctly identified divided by total positives.
6.2. Stage 2 - Classification using ANN (Misuse)
In the second stage, ANN algorithm modeled to classify the attack type instances into an attack group of four classes, i.e., DoS, R2L, U2R and Probe. After testing different networks and parameter, a Multilayer feedforward network is found to be the best. The number of hidden layers and number of nodes in the hidden layer was determined based on the process of trial and error. After evaluating on different training functions, it is been observed that a Resilient backpropagation performed to be the best for our work. While training with Resilient backpropagation, if the generated output result doesn’t satisfy the target output result, the error from the distortion of the target output was adjusted which leads to re-train or stop training the network depending on the value of error occured. Once the training is over and satisfies, the weight value is stored to be used in recall stage. Training and testing datasets are obtained from section 5.1.2 DSSC datasets.
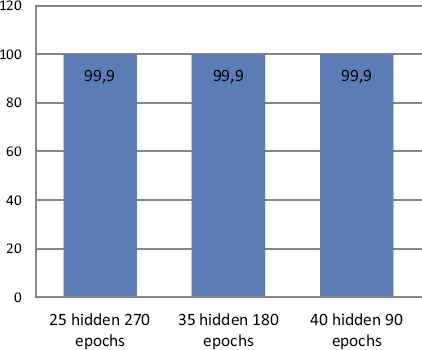
In this section, the neural network was first trained with the training data employing only attack instances creating a network model that is again simulated with a supplied testset data. Various ANN network type was tested with corresponding training functions. Thus, it appears appropriate to set ANN using the feedforward network with Resilient backpropagation training functions. Table 8 and Figure 6-10 describe the evaluation results of testing phase simulated on ANN model, scoring 99.9% detection accuracy at 25 hidden layer with 270 epochs (best validation performance of 0.001455 in Figure 7), 35 hidden layer with 180 epochs (best validation performance of 0.0012271 in Figure 8) and 40 hidden layer with 90 epochs (best validation performance of 0.0022577 in Figure 9). As shown by Figure 10 and simulation results on Table 8, it appears to set ANN (feedforward network with Resilient backpropagation training functions) with 35 hidden layers with 180 epochs perform best detection accuracy of 100%, 87.1%, 87.5% and 100% for DoS, R2L, U2R and Probe attack types with low false positive rate of only 0.1%.
ANN (stage-2) classification accuracy on testset.
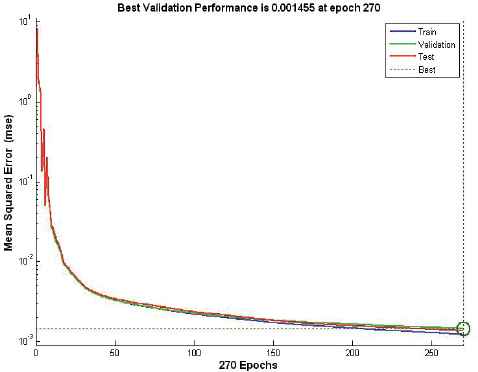
Performance of stage-2 classifier with 25 hidden layers at 270 epochs.
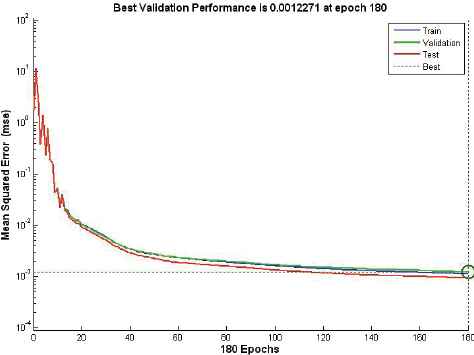
Performance of stage-2 classifier with 35 hidden layers at 180 epochs.
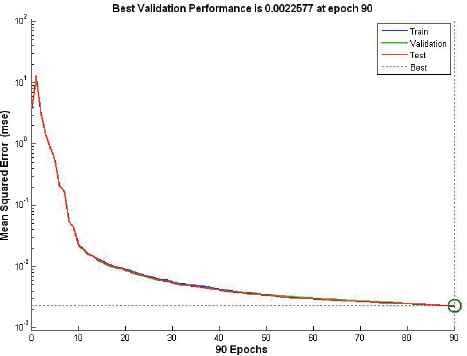
Performance of stage-2 classifier with 40 hidden layers at 90 epochs.
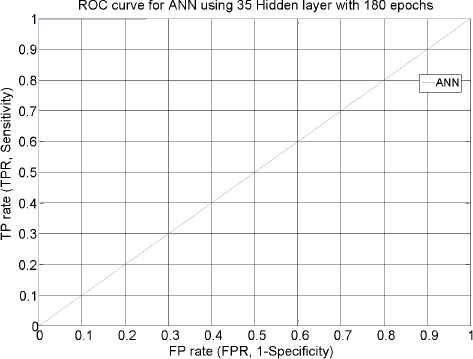
ROC curve for ANN stage-2 (35 hidden layers with 180 epochs).
| Test data | Attack category | 25 Hidden layer 270 epochs | 35 Hidden layer 180 epochs | 40 Hidden layer 90 epochs |
|---|---|---|---|---|
| 1 | DoS | 100% | 100% | 100% |
| R2L | 84.2% | 87.1% | 76.2% | |
| U2R | 75% | 87.5% | 87.5% | |
| Probe | 99.7% | 100% | 99.8% | |
| Avg. Ac | 99.9% | 99.9% | 99.9% | |
Simulation results of ANN multilayer feedforward network with Resilient backpropagation on testset.
Misuse detection on stage-2 results a comparative evaluation outputs, this was achieved through the design of the two-stage classification where stage-1 filtered out the normal traffic and stage-2 get trained only with the attack instances to classify those known and unknown attack instances to their corresponding attack groups from the testset. The trainset and testset used in this stage are based only an attack instance. Therefore, the evaluation result shows that misuse detection technique is always better in generation of low false positive rate with an accurate detection of known attack.
6.3. Hybrid classification (two-stage) anomaly-misuse compared to single stage classification
This section combines the whole datasets DFSC from subsection 5.1.1 and DSSC from subsection 5.1.2. Both SVM and ANN were tested separately with the corresponding training and test datasets using 5 – classes (Normal, DoS, R2L, U2R and Probe). After training and testing the individual anomaly module, 98.72% of detection rate with 0.7% probability of false alarm was achieved by SVM using the same function and parameter as section 6.1. The individual misuse detection module with ANN scores weighted average of only 86% detection rate along with the high false positive rate of 5.6%. As shown in Table 9, the weighted average of our proposed hybrid (two-stage) classification outperforms single and conventional hybrid classification technique, scoring high probability of detection accuracy 99.95% with low false positive rate of only 0.2%, while the individual classification of both SVM and ANN results much lower results. However, the evaluation results shows that the individual classification using SVM gives better performance compared to the ANN.
| Classification Algorithm | Individual SVM | Individual ANN | Proposed hybrid model(Two-stage) SVM - ANN |
|---|---|---|---|
| Normal | 99.9 % | 81.3 % | 99.91 % |
| DoS | 66.6 % | 93.6 % | 100 % |
| R2L | 79.2 % | 0 % | 77.4 % |
| U2R | 0.1 % | 0 % | 88.6 % |
| Probe | 77.1 % | 99.7 % | 99.9 % |
| Avg. FPR | 0.7 % | 5.6 % | 0.2 % |
| Avg. AC | 98.72 % | 86 % | 99.95 % |
| Dataset | DFSC+DSSC | DFSC+DSSC | DFSC+DSSC |
| No. of features | 41 | 41 | 41 |
Comparisions of individual model with the proposed Two-stage (Hybrid SVM-ANN) classification accuracy.
The proposed model was also compared with current state-of-art using the same dataset as shown in Table 10. It is been observed that the proposed model outperform other tested models in terms of the important evaluation parameter like AC and FPR. Hybrid model32 results lower rate of only 94.78% detection rate along with high rate of 5.2% FPR using serial classification technique. The conventional hybrid classification model33 perform better than the other two models by scoring 96.95% of AC along with only 0.35% FPR. Conventional parallel model7 results in 95.6% of AC along with 4% of FPR. Figure 11 compares performance of the proposed model and various conventional model based on ROC curve.
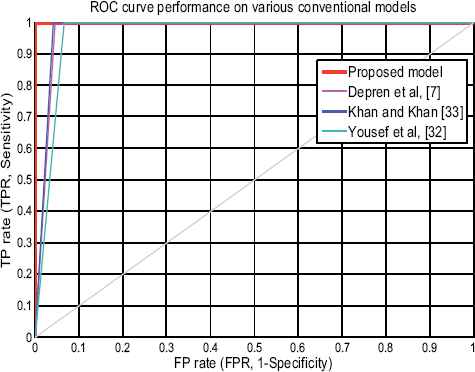
Performance of various models based onROC curve.
| Classification Algorithm | Conventional hybrid model (Two-stage) [33] | Conventional hybrid model (Two-stage) [32] | Conventional Hybrid Model (Two-stage Parallel) [7] | Proposed hybrid model (Two-stage) SVM - ANN |
|---|---|---|---|---|
| Weighted Avg. AC (%) | 96.95 | 94.78 | 95.6 | 99.95 |
| Weighted Avg. FPR (%) | 0.35 | 5.2 | 4 | 0.2 |
| Dataset | DFSC+DSSC | DFSC+DSSC | DFSC+DSSC | DFSC+DSSC |
| No. of features | 41 | 41 | 41 | 41 |
Comparisions of conventional model hybrid IDS classification model.
7. Conclusion and discussion
In this paper, a new intelligent network intrusion detection system using two-stage (Anomaly-Misuse) hybrid classification technique have been proposed and tested. Stage-1 used one SVM to detect traffic anomalies that can be attack and the stage-2 used one ANN that classifies attacks if they exist. A full 41 dimension features of NSL-KDD data set was used throughout the experiment.
Different functions and parameter are tested in both algorithms (stage-1 & stage-2). The evaluation results show that high detection rate 99.97% with a low false positive rate of only 0.19% achieved by stage-1 anomaly detection (Figure 5 & Table 7). Table 8 demonstrates that 99.9% detection accuracy with only 0.1% false positive rate achieved at stage-2 misuse detection and classification (Figure 10). This was achieved through the design of a classification model using SVM with Radial Basis Kernel Function at the first-stage (Anomaly) and Neural Network using Multilayered Feedforward Neural Network with Resilient Backpropagation at the second-stage (Misuse).
The key idea of the proposed two-stage classification is to combine the advantage of both Anomaly and Misuse classification technique, the proposed two-stage classification technique helps in reducing the computational complexity in both stages resulting an improvement on detection rate for anomaly intrusion detection.
Finally, we have found that the proposed two-stage system (Table 9) outperformed single-stage classification technique using the whole datasets from section 5.1.1 & 5.1.2 with 5 classes, resulting 99.95% detection accuracy with the low false positive rate of only 0.2%. Individual classification using SVM results in 98.72% accuracy along with 0.7% false positive while single-stage ANN results in 86% detection rate with the relatively high false positive rate of 5.6%.
We have concluded that this study gives evidence for improvements on anomaly intrusion detection. The combinations of SVM-ANN (Anomaly-Misuse) have proven their effectiveness to detect new attacks over single and conventional hybrid classification technique. Figure 3 -11 demonstrate that our work contributes to design a new classification model to achieve higher detection accuracy along with the lower probability of false alarm rate (false positive).
As shown in Table 9 & 10, the proposed new hybrid model is found to be comparative for classification that outperform the recent conventional model, i.e., Parallel hybrid model7 results 95.6% AC along with high rate of 4% FPR, hybrid model32 results 94.78% AC with high probability of 5.2% FPR, conventional hybrid model33 results 96.95% AC along with lower rate of only 0.3% FPR. The compared conventional model are various proposed hybrid model for IDS that uses the same datasets for evaluation and help us to conclude that our proposed hybrid approach delivers better detection accuracy among the existing models.
In future, creating self-captured datasets with 2 and 5 class will be the focus of our studies, employing more classification algorithms with different feature selection algorithms to explore the impact of feature selection and noisy-data on classification accuracy of a different learning algorithm for the network intrusion detection system.
References
Cite this article
TY  - JOUR
AU  - Jamal Hussain
AU  - Samuel Lalmuanawma
AU  - Lalrinfela Chhakchhuak
PY  - 2016
DA  - 2016/09/01
TI  - A two-stage hybrid classification technique for network intrusion detection system
JO  - International Journal of Computational Intelligence Systems
SP  - 863
EP  - 875
VL  - 9
IS  - 5
SN  - 1875-6883
UR  - https://doi.org/10.1080/18756891.2016.1237186
DO  - 10.1080/18756891.2016.1237186
ID  - Hussain2016
ER  -