
Thumb-tip Force Prediction Based on Hill’s Muscle Model using Electromyogram and Ultrasound Signal
- DOI
- 10.2991/ijcis.11.1.18How to use a DOI?
- Keywords
- Thumb-tip force; electromyography; thumb training system; muscle model
- Abstract
The use of prostheses is necessary to restore lost limbs to a level of functionality to enable activity of daily living. Many prostheses are now using myoelectric based control techniques to operate. However, to develop a model based controller for the system remains a challenge as accurate model is necessary. This study investigates the use of electromyogram and ultrasound signal to predict thumb tip force based on Hill’s Muscle model. The results obtained has shown a significant improvement in the prediction of thumb tip force as much as 31.45% of average RMSE over the benchmark model that leverages on biomechanics model and active marker to characterize the muscle.
- Copyright
- © 2018, the Authors. Published by Atlantis Press.
- Open Access
- This is an open access article under the CC BY-NC license (http://creativecommons.org/licences/by-nc/4.0/).
1. Introduction
Over the last two centuries, the industrial era has grown significantly. People globally, are working in the major industry sectors including transport, manufacturing, mining, building and construction, agriculture, fisheries and many other areas. The hazards and hardships associated in many of these industries often outweigh the desire and need to earn a living. Accidents and other risks in the industry are increasing each year, along with greater focus on safety and security considerations. In Malaysia, almost 42000 workplace accident cases were reported in 2014, where, 560 accidents resulted in fatalities.1 The risk of performing dangerous activities can often lead to accidents, and potentially, leading to some form of disability. Global conflicts (i.e. war, civil unrest, protests, etc.), and especially motor vehicle accidents are a leading cause of significant loss of life and disabilities. Motor vehicle accidents continue to increase each year with many of its victims facing a life of disability resulting from an amputation. Malaysia recorded 25,101,192 vehicle accidents in 2014, resulting in 6674 fatalities.2 Diseases such as diabetes, are also affecting our vascular system and it has evolved as one of the most commonly diseases. Diabetes, if not treated, can also result in severe infection and ulceration, which may lead to amputation.3 Malaysia has the highest number of recorded cases of diabetes, with 17.5% of its population, up until 2015, being affected in South East Asia and is expected to rise.4
Medical science rarely can replace an amputated limb without a donor or by using a prosthetic replacement. Using a donor limb may enable full or partial functionality (motion) to return depending on the nature of the loss. If there is the possibility of gaining a level of functionality back again, it is usually through physiotherapy and a lengthy rehabilitation program. This will aid, in the recovery of the amputee.5 However, this will usually occur over an extended period. Until medical science can help patients with non-functioning limbs, (i.e. using donor limbs, or performing corrective surgery to repair nerve damage inside the limb), using prostheses is the only solution at this stage.
Prosthetic limbs are able to last decades, providing a means for the amputee to at least, continue to function albeit not fully in all cases.6 Current prosthetic units do not remain as passive or static given they are artificial units. Biomedical scientists and engineers are working hard to improve prosthetic units and the capability to move by human intention (i.e. instructions using body language, verbal communications and the mind).7,8,9 The present robotic prostheses available from Bebionic10 are operated using preprogramed buttons inside the prosthetic unit and operated easily via a switch, by the amputee. Thus intention-movement of prosthetic units enables amputees to manipulate and handle objects and experience a better quality of life.
Current prosthetic hands have improved to a level where amputees can control the fingers on a prosthetic hand. However, prosthetic hands are still not fully functional using human intentions alone. Most are controlled using a set of functions that can change the movement of all fingers into a set position or mode. This allows the amputee to use the prosthetic hand for certain work activities, by helping to grip an object by releasing and manipulating buttons.11 The set of functions can help with numerous activities, but the prosthetic hand is limited on what the amputee can do to a full extent. This limitation often prevents the amputee from enjoying a full quality life as before the accident or to obtain complex work given the disability/handicap associated with the lack of functionality and motion.
An electromyogram (EMG) signal is used in muscle research, where the signal is related to an electrical signal/impulse in the muscle, originating from neurons.12 In performing body movements, EMG signals are used to determine how much force originates and is created from the muscles that move specific parts of the body.13 The EMG signal is commonly used to estimate muscle activation, contributing to body movement and force.
The present research has focused on developing a model to control prosthetic hands allowing an electromyogram (EMG) signal classification to be received from the muscles and nerves, to move the prosthetic fingers, like normal fingers.14 The two approaches in applying EMG signals to move prosthetic fingers are; by applying machine learning classifications15 and through musculoskeletal modelling.16. Machine learning classifications work well based on research17 but may produce outliers in the input data that can skew and mislead the training process of the machine, causing deficient or irregular performance, if not properly trained. It is a challenge to analyze and detect outliers. Of all five fingers, the thumb is the only opposable digit having a high impact on the prosthetic unit, if not perfected to cater for the thumb. Normally, the thumb is used with the other fingers or individually. However, most of the tasks performed by the hand usually involve using the thumb. The paper focuses on modelling technique of thumb muscles to predict thumb-tip force in prosthetic thumb application using semi empirical approach.
In modeling thumb muscle, Hill’s muscle model18 is adopted and applied, where muscle length is one of important variables required. In the research paper,19 the authors utilized markers and cameras to measure muscle length. The approach may cause errors in muscle length measurement through muscle slippage underneath the skin. The distance and orientation of the camera may also lead to inaccurate measurement. In this research, ultrasound technology is used to acquire accurate muscle length.
In the subsequent section, the details of experimental setup, experimental procedure and requirement for the signal measurement will be presented. The following section will then present the result of signal measurement in term of its contribution in predicting the thumb tip force using Hill’s muscle model.
2. Experimental Procedure
2.1. Experimental setup
For the research, a dedicated portable thumb training platform was developed as shown in Fig. 1 to record thumb-tip force and thumb flexion angle measurements.
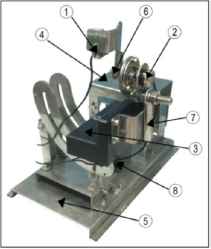
The portable thumb training system
Both the thumb-tip force and thumb flexion angle are important parameters in developing and verifying the Hill’s muscle model of the thumb. The platform is adjustable to accommodate different thumb and hand sizes and could provide the right hand posture to the subject in performing the experiment comfortably. Table 1 lists the description of the platform. The label of parts (P) listed in Table 1, are described as follows; (P1) is the force sensor used to measure thumb-tip force exerted by the subject. Due to the mechanics of the thumb flexion, the force sensor is placed on a sliding frame to accommodate a more natural movement of thumb tip when the thumb flexes. The measurement of the thumb tip force can be monitored on the display interfaced to the platform. (P2) is the potentiometer used to measure the thumb flexion angle. The adoption of single turn potentiomer is to reduce hysteris error in multi-turn type of potentiomenters. Both thumb tip force and flexion angle can be monitored on the display on real time basis. This is important as the force and flexion angle serve as guide for the subjects to track consistently in the experiment while measurement is done. (P3) and (P4) are palm and forearm rests respectively. The height of the forearm rest could be adjusted to ensure the hand is always perpendicular to the body so as to have a standard and correct hand posture. (P5) is the base that holds and stabilises the entire platform. (P6) is the thumb length adjuster that can be adjusted to the length of the subject’s thumb, where the thumb length is defined as in Fig. 2. (P7) is the palm width adjuster to accommodate different width of subject’s palm (refer Fig. 2).
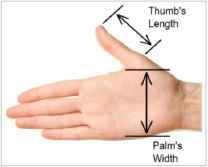
Thumb’s length and palm’s width
| Part (P) | Descriptions |
|---|---|
| 1 | Force sensor with slider to provide compliance to thumb tip motion |
| 2 | Single turn potentiometer |
| 3 | Palm rest |
| 4 | Forearm rest |
| 5 | Platform base |
| 6 | Thumb length adjuster |
| 7 | Palm width adjuster |
| 8 | Forearm rest height adjuster |
Platform specification
Table 2 describes the compliances for all the three adjusters in the platform; the thumb length, the palm width and the height of forearm rest relative to the table surface respectively.
| Part | Variable | Range |
|---|---|---|
| Thumb | Length | 3.5 to 4.5 cm |
| Palm | Width | 8.5 t0 10.5 cm |
| Forearm | Height | 13.8 to 21.6 cm |
List of compliances provided by the platform
The platform could provide a list of range of motions (ROMs). The range of flexion angle of the thumb is from +90° to –10° where +90° is the posture of the thumb digit being perpendicular to the pointer finger. Meanwhile 0° is the posture of the thumb flexes towards the pointer finger. The platform could also allow for pronation and supination of the forearm for different posture of thumb tip force measurement as well as to provide better comfort during the experiment especially when the hand is in the standard position. The adjustment for the forearm could range from 0° to +90° where at 0° the subject’s palm is facing inwards, and at +90° it faces downwards. Further explanation on the platform can be found in Ref. 20.
2.2. System interface
In order to have simultaneous, real-time data recorded for the thumb-tip force, thumb flexion angle, electromyogram and ultrasound signals from the muscles, the platform is interfaced to a computer using MATLAB/Simulink software and Arduino board that serves as data acquisition unit.
2.3. EMG measurement
In this study, four thumb muscles were selected namely Adductor Pollicis (AP), Flexor Pollicis Brevis (FPB), Abductor Pollicis Brevis (APB) and the First Dorsal Interosseous (FDI). They are intrinsic thumb muscles located on hand and measurable by ultrasound probe. Fig. 3 and Fig. 4 show the location of the muscles on human hand and the corresponding placement of the electrode pads verified by the radiologists.
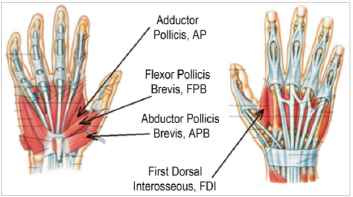
Intrinsic thumb muscles
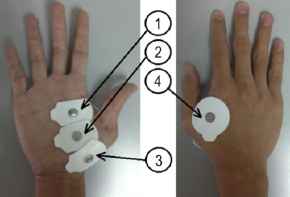
Positions of the electrodes; (1) AP, (2) FPB, (3) APB, (4) FDI
A bio-signal amplifier and data acquisition devices, g.BSamp by g.tec was connected to a computer to read and record the EMG signals measured from the muscles. The data was acquired together with the force sensor and potentiometer data that read thumb-tip force and thumb flexion angle respectively.
The bandwidth of the signal amplifier was set to be within 5 to 500Hz that was the range of EMG signal. This was done to eliminate any potential mechanical noise that existed at low frequency and stray noise at high frequency that may interfere the EMG signals. The force sensor and potentiometer were calibrated properly to make the measurement consistent and accurate. In order to ensure accuracy of the thumb sensor and potentiometer measurements, the sensors were calibrated from time to time by using actual thumb tip force and flexion angle data so as to establish the mapping between the magnitude of the measurands and the potential developed by the sensors. Thumb length and palm width were adjusted to complete system calibration and for the subject to get accustomed to the range of motion set in the experiment.
The subject was then requested to move his thumb according to instructions to enable measurable data to be obtained. The system pivot were set at 90°, 60°, 30° and 0° for the discrete thumb flexion angle measurements while the force applied were set at 0N, 5N, 10N and 15N. Each subject underwent 3 trials for each set of experiments and rested for approximately 5 minutes in between to prevent muscle fatigue.
2.4. Ultrasound measurement
In the experiment to measure the muscle lengths using the ultrasound signal, the set of postures and positions of the thumb and hand provided by the platform, were replicated based on the experiment designed to measure the EMG signal.
The ultrasound measurement was used to measure the muscle length of all four muscles when the thumb flexed at 0°, 30°, 60° and 90°. Figs. 5(a) and 5(b) illustrate the posture of the thumb on the platform at 0° and 90° respectively. The signal image from the ultrasound probe was displayed as muscle fibre on the computer screen and was used directly to measure the length of the respective thumb muscles. The ultrasound measurement was performed by two radiologists as it was a requirement in medical practise to increase data reliability and to avoid bias. As there was no standard thumb muscle measurement exist to the best of our knowledge, a standard measurement set of thumb data need to be established. A more precise technique of using magnetic resonance imaging (MRI) to measure thumb muscle length was adopted and the measured data acted as reference model to the measurement by the ultrasound.
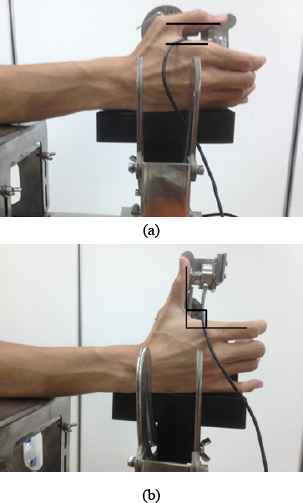
(a). Thumb flexion at 0° (b). Thumb flexion at 90°
MRI scanning was carried out on all the subjects before ultrasound measurements was taken. Each subject’s hand was scanned at a thumb flexion angle of 0° and 90° to measure the minimum and maximum lengths of the muscles by using dedicated wedges made by wood to maintain the flexion angle. The exact point of measurements and location of the muscles were also identified in the experiments. The developed platform cannot be brought into the MRI system as it is made from metal.
2.5. Controlled environment
It was important for the measurements to be taken in a controlled environment to ensure data consistency. Room temperature was set to 24 °C. The subject was asked to sit in an upright position with their elbow flexed at the right angle, thereby enabling the subject to rest their hand on the platform. The forearm was required to be placed on the forearm rest to prevent the onset of fatigue occurring during the experiment.
2.6. Subjects
Three male subjects were recruited to participate in the experiments to produce the required data. All subjects were right-handed, aged 25 years, having a height of 165 cm ± 10 cm and weight of 60 kg ± 10 kg. They were also cleared from any history of thumb injuries.
2.7. Hill’s muscle model
The governing equations to predict thumb-tip force incorporating EMG signals and muscle length were derived in detailed by.19 The equations were based on Hill’s muscle model as shown in Fig. 6.
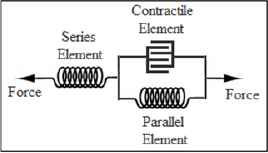
Hill’s muscle model
The normalised EMG signal, u(t) is first used in measuring muscle activation level, a(t) by Eq. (1),
In the case of non-measurable muscles where EMG signals cannot be recorded, the ratio of muscle activation equation is shown in, Eq. (2) as an example,
The force from the contractile element is produced from actin and myosin that is responsible to contract the muscle, while the force from the parallel element is a force that results from the refusal of the muscle to contract further after some elongation.
In applying the Hill’s muscle model, it is assumed that the force from the serial element, FSE which originated from the muscle tendon is to be neglected. On top of relatively smaller in size, tendon stiffness does not allow the tendon to deform significantly in the case of ROM under study.
Eq. (4) describes the force contractile element, FCE that is the product of three components; muscle activation, a, the normalised force length function, f1, and the maximum force of the contractile element, FCEmax.
The normalised force-length function, f1 is related to the force produced by the contractile element when the muscle is at a certain length. Normally, the maximum force of a contractile element occurs when the muscle is at its middle (i.e. central) length while its minimum is at both its highest and lowest lengths. This is the maximum force that can be achieved by the contractile element of a muscle. Eq. (5) describes f1,
The force generated by the parallel element, FPE, is shown in Eq. (6).
The maximum change in length of the parallel element, ΔLPEmax is described in Eq. (8),
Eq. (9) sums up the force predicted at the thumb tip,
2.8. Particle Swarm Optimization (PSO)
Particle swarm optimisation is a continuous technique introduced by Kennedy and Eberhart22 to identify unknown constants that cannot be measured. It is based on the concept of generating new solutions in the neighbourhood of two parents via attractions to two personal best, pbest positions in PSO problem. This allows greater diversity and exploration over a solution, and faster convergent due to its momentum effect. In this paper, the unknown constants are the degree of nonlinearity, A, shape parameter, S, Gaussian distribution, Ø, maximum force of contractile element, FCEmax, and the optimal length of contractile element LCE0. The PSO technique is used to find the best solution to the unknown constants and is applied to the Hill’s muscle model using muscle activation data which is generated from the EMG signal as well as the recorded muscle length data. By considering all the cases of different thumb flexion angles, the smallest root mean square error (RMSE) is desired by comparing the actual thumb-tip force against the one predicted by Hill’s muscle model.
3. Result and Analysis
The analysis of the data was done post completion of the experiments. Fig. 7 shows a sample of EMG signal that was fed through a moving average (MOV) filter.
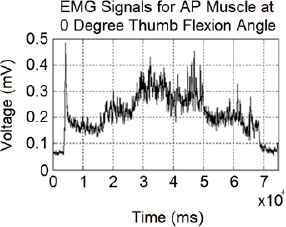
EMG signals from AP muscle at varying thumb tip force (per voltage)
For similar set of experiments, the data for muscle length were acquired with the help of the radiologists at Medical Imaging Unit, UiTM Hospital, Sg. Buloh. The muscle length from MRI measurement is used as reference to validate the ultrasound measurement as shown in Fig. 8 and 9.
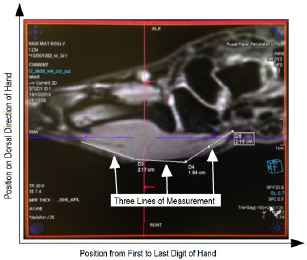
APB muscle measured by MRI machine
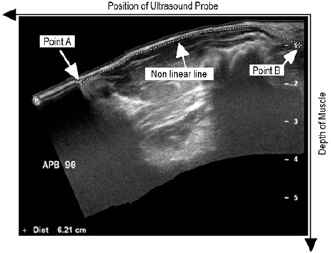
APB muscle measured by ultrasound probe
The lines marked in the MRI serves as guide to track and measure the muscle length using ultrasound probe. The measurement from ultrasound probe posed challenge where the probing has to be done on uneven surface of the skin as well as drifting of cross-sectional muscles when pressed by the probe. This is most likely be one of the factors that cause measurement error between MRI and ultrasound technique in muscle length measurement. Table 3 tabulates the measurement of muscle lengths for the three subjects.
| Sub | Muscle | 0° | 0° | 30° | 60° | 90° | 90° |
|---|---|---|---|---|---|---|---|
| MRI (cm) | Ult. (cm) | Ult. (cm) | Ult. (cm) | MRI (cm) | Ult. (cm) | ||
| Sub. 1 | AP | 3.51 | 3.52 | 4.31 | 5.64 | 5.93 | 5.93 |
| FPB | 4.76 | 4.72 | 5.17 | 5.39 | 5.60 | 5.60 | |
| APB | 4.75 | 4.75 | 5.37 | 5.83 | 6.09 | 6.02 | |
| FDI | 6.37 | 6.33 | 6.46 | 6.63 | 6.92 | 6.96 | |
| Sub. 2 | AP | 3.14 | 3.08 | 4.24 | 4.61 | 5.64 | 5.63 |
| FPB | 4.86 | 4.81 | 4.93 | 5.13 | 5.31 | 5.25 | |
| APB | 5.96 | 5.64 | 5.81 | 6.02 | 7.00 | 6.36 | |
| FDI | 5.17 | 5.24 | 5.34 | 5.44 | 5.69 | 5.66 | |
| Sub 3 | AP | 3.43 | 3.41 | 3.88 | 4.65 | 5.07 | 5.06 |
| FPB | 4.65 | 4.55 | 4.83 | 5.12 | 5.60 | 5.57 | |
| APB | 5.3 | 5.29 | 5.43 | 5.93 | 6.26 | 6.21 | |
| FDI | 5.07 | 5.08 | 5.35 | 5.68 | 6.46 | 6.01 | |
Muscle length measured from MRI and ultrasound (Ult.) signals
It could be observed from the table that the measurement of muscle lengths using ultrasound signal confirmed the MRI measurement with the degree of RMSE value overall to be 0.078cm.
By using the respective muscle gain values, Ki from the model published in the previous paper19 and the data obtained from the experiments the PSO algorithm was then executed to determine the optimal value for FCEmax, LCE0, Ø, S and A. The result is tabulated in Tables 4.
| Muscle | FCEmax(N) | LCE0 (cm) | Ø | S | A |
|---|---|---|---|---|---|
| AP | 260.281 | 5.366 | 0.723 | 0.010 | 0.724 |
| FPB | 207.790 | 4.993 | |||
| APB | 92.289 | 4.363 | |||
| FDI | 28.009 | 7.040 |
Optimised values of FCEmax, LCE0, Ø, S and A
The measured and generated data from PSO was applied to the Hill’s muscle model. As shown in Fig. 10(a) and 10(b), although the predicted thumb tip force (in grey) shows similar patterns or trends as the measured thumb tip force (in black), the predicted force seemed to suffer from some offsets. (except the measurement of thumb flexion angle at 0°). It was anticipated that the reason was due to the constant gain Ki used as multiplier in Eq. (9). Park et al.19 has made the gain constant perhaps due to the ROM under their investigation which covered the flexion angle from 0° to 45° only. Moreover the constant was first set by Pearlman21 who studied about thumb flexion at 0°. Therefore, new set of multipliers was introduced based on the flexion angle as in Eq. (10),
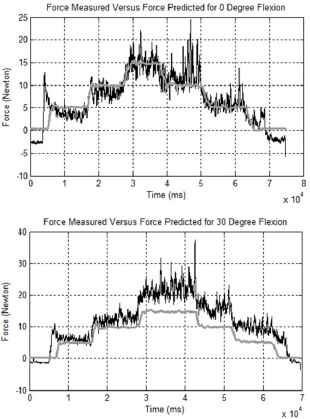
Plot of measured (black) vs. predicted (grey) thumb-tip force at 0° and 30°
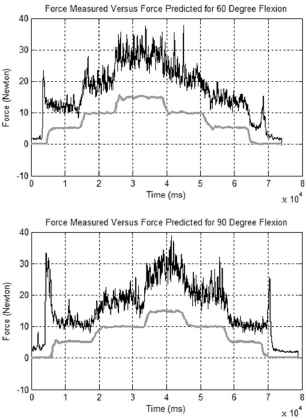
Plot of measured (black) vs. predicted (grey) thumb-tip force at 60° and 90°
The PSO was then trained again with a new set of variable multipliers. In order to measure the performance of the predicted thumb tip force, it was mapped against the actual thumb tip force for discrete and continuous force cases. The results are shown in Fig 11(a) and 11(b).
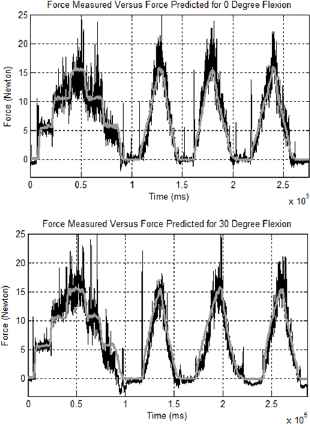
Plot of measured (black) vs. predicted (grey) thumb-tip force at 0° and 30° with new multiplier.
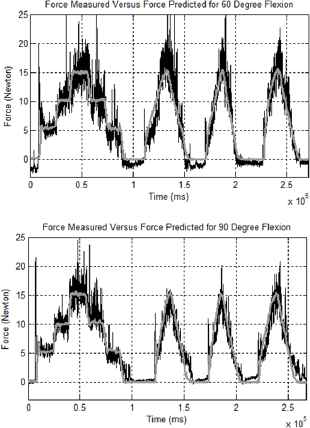
Plot of measured (black) vs. predicted (grey) thumb-tip force at 60° and 90° with new multiplier
It can be observed that the prediction of thumb tip force using the updated model gives a much better result. The result is further compared to the model developed in the previous paper19 as shown in Table 5.
| Flexion angle | Model developed | Park et al., 2012 |
|---|---|---|
| 0° | 1.784 | 1.866 |
| 15° | - | 3.299 |
| 30° | 1.862 | 3.453 |
| 45° | - | 4.425 |
| 60° | 1.822 | - |
| 90° | 1.349 | - |
RMSE performance of model developed as compared to model by Park et al.
Table 5 shows that for the 0° and 30° flexion angles, the new model developed performed much better than the previous model by Park et. al.19 The RMSE recorded is significantly low throughout the whole ROM. The improvement of 31.45% of averaged RMSE was accorded from the data. The RMSE performance of model proposed seems more consistent as the degree of flexion angle increases as compared to Park et. al. which RMSE increases throughout.
4. Conclusions
In developing model based controller for prosthetic thumb, the accuracy of the model is paramount. The paper has presented the use of EMG and ultrasound signals to characterize the muscles responsible for functional range of thumb flexion. These data are then use in the Hill’s muscle model to predict thumb tip force. The result has shown a significant improvement in term of RMSE over previous model developed by Park et. al. The direct measurement of muscle lengths using ultrasound signal has contributed significantly to the accuracy of the model as the previous approach relies on biomechanics model and active marker to estimate the muscle lengths. In the future work the proposed method could be adopted in estimating force for different part of the limbs and more subjects could be recruited to improve the model accuracy.
Acknowledgement
The work presented in this paper was carried out in the Biomechatronics Research Laboratory of International Islamic University Malaysia. The authors wish to gratefully acknowledge the grant funding from the Ministry of Higher Education Malaysia under Fundamental Research Grant Scheme.
References
Cite this article
TY  - JOUR
AU  - Shahrul Naim Sidek
AU  - Muhammad Rozaidi Roslan
AU  - Sabrilhakim Sidek
AU  - Mohd Shukry Mohd Khalid
PY  - 2018
DA  - 2018/01/01
TI  - Thumb-tip Force Prediction Based on Hill’s Muscle Model using Electromyogram and Ultrasound Signal
JO  - International Journal of Computational Intelligence Systems
SP  - 238
EP  - 247
VL  - 11
IS  - 1
SN  - 1875-6883
UR  - https://doi.org/10.2991/ijcis.11.1.18
DO  - 10.2991/ijcis.11.1.18
ID  - Sidek2018
ER  -