
A Comparison of Outlier Detection Techniques for High-Dimensional Data
- DOI
- 10.2991/ijcis.11.1.50How to use a DOI?
- Keywords
- data mining; outlier detection; high-dimensional data; evaluation measurement
- Abstract
Outlier detection is a hot topic in machine learning. With the newly emerging technologies and diverse applications, the interest of outlier detection is increasing greatly. Recently, a significant number of outlier detection methods have been witnessed and successfully applied in a wide range of fields, including medical health, credit card fraud and intrusion detection. They can be used for conventional data analysis. However, it is not a trivial work to identify rare behaviors or patterns out from complicated data. In this paper, we provide a brief overview of the outlier detection methods for high-dimensional data, and offer comprehensive understanding of the-state-of-the-art techniques of outlier detection for practitioners. Specifically, we firstly summarize the recent advances on outlier detection for high-dimensional data, and then make an extensive experimental comparison to the popular detection methods on public datasets. Finally, several challenging issues and future research directions are discussed.
- Copyright
- © 2018, the Authors. Published by Atlantis Press.
- Open Access
- This is an open access article under the CC BY-NC license (http://creativecommons.org/licences/by-nc/4.0/).
1. Introduction
Outlier analysis is of great interest to the data mining field. It refers to the task of identifying those patterns from the data whose behaviors do not conform to the expected one1,2. For the concept of outlier, there is no commonly accepted definition. Generally, an object is called an outlier or anomaly if its behavior is significantly different from the remainder in given data. In the literature, the outlier is often referred to as anomaly, discordant object, exception, aberration, surprise, peculiarity, depending on the specifical application scenes.1,2,3,4,5,6.
Outlier detection plays a great role in several domains, such as decision-making, clustering, and pattern classification, due to the fact that it can reveal rare but important phenomenon, and find interesting or unexpected patterns. By now, outlier detection becomes one of the most important issues in data mining, and has a wide variety of real-world applications, including public health anomaly, credit card fraud, intrusion detection, data cleaning for data mining and so on3,4,5. For example, an abnormal network transmission could imply a fact that the computer system is attacked by hackers or viruses. An anomalous transaction of credit card could be unauthorized used. An unexpected geological activity in nature could be a precursor of earthquake.
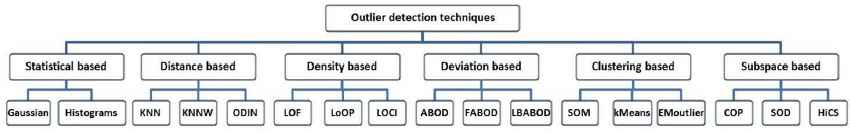
There are a large number of outlier detection algorithms provided in literature 1,2. The traditional outlier detection techniques can be typically grouped into six categories:statistical-based, distance-based, density-based, deviation-based, clustering-based and subspace-based methods. The categories and their representative techniques are showed in Fig. 1, and the applications of these outlier detection methods are listed in Table 1.
The methodologies of outlier detection
| Techniques | 1 | 2 | 3 | 4 | 5 | 6 | 7 |
|---|---|---|---|---|---|---|---|
| Statistical based methods | √ | √ | √ | √ | √ | √ | |
| Distance based methods | √ | √ | √ | √ | √ | √ | |
| Density based methods | √ | √ | √ | √ | √ | √ | |
| Clustering based methods | √ | √ | √ | √ | √ | ||
| Deviation base methods | √ | √ | √ | √ | √ | ||
| Subspace based methods | √ | √ | √ | √ | √ |
1-Intrusion Detection, 2-Fraud Detection, 3-Medical Health, 4-Industrial Damage Detection, 5-Sensor Networks, 6-Textual Anomaly Detection, 7-Image Processing
Applications of outlier detection
As an important issue in data mining, outlier detection attracts a great number of attentions from a variety of research fields, including machine learning and medical health. There are several surveys of outlier detection in the literature. For example, Hodge and Austin2 surveyed the outlier detection methods used in machine learning and statistics. Chandola et al.1 gave a broad review of outlier detection techniques according to different assumptions. The others mainly focuses on either specifical applications, such as network data 4 and temporal data 5, or particular learning techniques, such as subspace learning and ensemble learning 6.
In this paper, we place more emphases on the techniques of outlier detection for the complicated data with high-dimensionality. The rest of this paper is organized as follows. Section 2 presents the state-of-the-art outlier methods for high-dimensional data, including the neighbor ranking-based method, the subspace-based method and the ensemble learning-based method. Section 3 provides the evaluation measurements and datasets commonly used in outlier detection, followed by an experimental comparison of representative outlier detection methods in Section 4. Section 5 discusses the problems and challenges of outlier detection in future work. Finally, Section 6 concludes the paper.
2. Outlier Detection for High-dimensional Data
As mentioned above, outlier detection has turned out to be an import problem in many research fields, while it is not a trivial work to detect such rare behaviors from the high-dimensional data. On the one hand, the distance between the high-dimensional observations is very small, which will reduce the efficiency of distance-based outlier detection methods. On the other hand, for high-dimensional data, some irrelevant attributes may impede the separability of the outlier detection. Accordingly, In the following subsection we briefly review some outlier detection methods for high-dimensional data, including the neighbor ranking-based methods, the subspace learning-based methods and the ensemble learning-based methods.
2.1. Neighbor Ranking-Based Methods
As aforementioned analysis, for high-dimensional data, traditional similarity measurement such as the Euclidean distance function are usually meaningless, which will make distance-based outlier method less performance. One adaptation is to take the ranking of neighbors into consideration, since the nearest neighbor ranking of the objects is still meaningful to the nature of high dimensional data. The underlying assumption is that given two objects ob1 and ob2, if they were generated from the same mechanism, they would most likely become nearest neighbors or have similar neighbors 9.
As an example, Huang et al.10 developed an outlier detection algorithm called RBDA (Rank Based Detecting Algorithm). It takes the ranks of each object in its neighbors as the proximity degree of the object. Specifically, for each object p ∈ D in a given dataset D, let Nk(p) be the k nearest neighbors of p. The outlier degree of p is defined as follows:
Note that the neighbor ranking based methods are sensitive to parameter k of models, it is difficult to choose the right k for different applications. To cope with this problem, Ha et al.16 provided a heuristic strategy to select the value of k, along with an iterative random sampling procedure. The underlying assumption is that outlying objects are less likely selected than inlying objects in random sampling, and therefore, more inlierness scores should be given to the selected objects in each sampling. After several iterations of random sampling, the inlierness scores of each object, which is also called the observability factor (OF) of each object, is estimated by counting its occurrence times in its neighborhoodand the object with a low OF value is a promising outlier candidate. Furthermore, by defining the information entropy of OFs, the values of k can be properly selected.
2.2. Subspace Learning-Based Methods
Most of the outlier detection techniques discussed so far identify outliers from the whole data space with all dimensions. However, outliers are often represented as unusual local behaviors in lower dimensional subspaces6. A.Zimek et al.7 pointed out that for an object with many attributes, only subsets of relevant attributes provide the meaningful information, the residual attributes are irrelevant for the task and may impede the separability of the outlier detection model. Therefore, it will be an interesting and efficient work to identify outliers from appropriate subspaces.
As a popular technique used in the analysis of high-dimensional data, the subspace learning is also extensively studied in the field of outlier detection. For subspace learning-based outlier methods, the key is to find the relevant outliers by sifting through different subsets of dimensions in the data in an ordered way. Generally, these methods can be divided into two categories: the sparse subspace methods 17,18,19 and the relevant subspace methods 20,21,22,23,24,25,26.
The sparse subspace techniques project the high-dimensional objects onto one or more low-dimensional and sparse subspaces. and the objects which are contained in the sparse subspaces are considered as outliers, because these sparse subspaces have abnormally low density. It should be pointed out that it is a time-consuming work to explore the sparse projections from the whole high-dimensional space. To improve the exploring efficiency, Aggareal and Yu18 exploited an evolutionary algorithm to get the subspaces, in this method, the subspace with the most negative scarcity coefficients was considered as a space projection. However, the performance of this algorithm heavily relies on initial populations.
Another studying direction of the sparse subspace methods is the subspace representation and encoding. For example, Zhang and Jiang19 take concept lattice to represent the relationship of subspaces, where the subspaces with low density coefficients are regarded as sparse ones. This detection method shows promise in the performance and the completeness, while constructing the concept lattice of subspaces is complex, resulting in low efficiency. In order to get the sparse space, Dutta et al.20 employed the sparse encoding to project objects to a manifold space with a linear transformation.
The detection methods using relevant subspaces exploit locally information, which can be represented as relevant features, to identify outliers. A typical example of this kind is SOD(subspaces outlier detection)9, where for each object, its correlation dataset with sharing nearest neighbors is explored. On each correlation dataset, an axis-parallel subspace is determined by linear correlation, such that each feature has low variance in the subspace. Unlike SOD which only concerns the variances of features, Muller et al.23 adopted the relevant relationships of features of the correlation dataset to determine the subspace. Specifically, they took the Kolmogorov-Smirnov test to examine the relevant relationships of features, and then got the relevant subspaces, Based on these relevant subspaces, the outlierness degree of the object was calculated by multiplicative of local outlierness scores. It should be noted that this detection method is computationally expensive. Kriegel et al.21 did a similar work. They obtained relevant subspaces by using principal component analysis, and then identified outliers by using the Mahalanobis distance with gamma distribution. The limitation of this method is that it requires a great number of local data to detect the trend of deviation.
Unlike the aforementioned detection methods, Keller et al.24 proposed a flexible outlier detection method. They took outlier mining as a decoupled process, including ‘subspace search’ and ‘outlier ranking’. The first step was to obtain high contrast subspaces (HiCS) by using the Monte Carlo sampling technique. Based on these subspaces, the LOF scores of objects were aggregated. Stein25 worked further. They provided a local subspace outlier detection method using global neighborhoods. Firstly, the relevant subspaces were collected by HiCS, and then the outlier scores were calculated by using local outlier probabilities (LoOP), in which the neighborhood was selected in the global data space27. Note that because the subspace learning-based methods need to explore subspaces from the high-dimensional space, they are usually computationally expensive.
2.3. Ensemble Learning-based Methods
As widely used in machine learning28,29, ensemble learning is also frequently used in outlier detection for its better performance. As we know, only one detection method can not discover all outliers in a low-dimensional subspace, because the data in reality is very complicated. Thus, it is necessary to take different learning techniques or multiple subspaces into account simultaneously, and get the the potential outliers by using ensemble techniques. Two ensemble strategies are frequently adopted for outlier analysis: summarizing the outlier scores generated from the detection methods, and picking the best one after ranking. Among the ensemble based methods, the variance-reduction methods such as feature bagging and subsampling are extensively studied in outlier detection.
The feature bagging methods aim to make use of different feature subsets to train multiple models, and then combine the results of these models into an overall one as the final result. For example, Lazarevic et al.30 exploited a typical feature bagging method to detect outliers. They first randomly selected the feature subsets from the original feature space, and then applied the outlier detection algorithm to estimate the score of each object, and finally integrated the scores of same object as a final one. Compared to this typical feature bagging method30 which only considered the same detection technique, Nguyen et al.31 took use of different ones to estimate outlier scores for each object on random subspaces.
The second strategy widely used is subsampling, in which training objects are drawn from data without replacement. It has been demonstrated that sub-sampling has quite potential capability to improve the performance of outlier detectors when implemented properly. For example, Zimek et al.32 took use of random subsampling to compute the nearest neighbors and then estimates the density for each observation in the dataset. This ensemble method, coupled with an outlier detection algorithm based on relative densities like LOF, has higher efficiency and provides a diverse set of results.
Pasillas-Diaz et al.33 took both feature bagging and subsampling into account in their ensemble outlier detection algorithm, where the different features were obtained via feature bagging, and the outlier scores were calculated upon different subsets of data via subsampling. Note that the variance of objects is difficult to be obtained by feature bagging, and the final results also tend to be sensitive to the size of subsampled datasets.
3. Evaluation and Datasets
3.1. Evaluation Measurements
For outlier detection algorithms, it is difficult to evaluate their performance. On the one hand, the appropriate benchmark datasets with ground truth for outlier detection is scarce in nature, which will increase the difficulty for the evaluation task. On the other hand, distance or distance-based outlier detection methods often use scores as evaluation, however, it is difficult to set a proper threshold for each application since the scores are identical. Furthermore, the biases of mostly used evaluation measures are not fully understood.
In this paper, we provide several commonly used measurements to evaluate the performance of the outlier detection methods. They are described as follows:
- 1.
AUC7. The ROC (receiver operating characteristic) curve is a graphical plot of the true positive rate versus the false positive rate, where the true (false) positive rate represent the proportion of outliers (inliers) ranked among the top m potential outliers. A ROC curve can be summarized by a single value known as ROC AUC, defined as the area under the ROC curve (AUC). AUC is often adopted to numerically evaluate the performances of the outlier detection algorithms.
- 2.
Precision (P). Precision refers to a ratio of the number of true outliers over the total number of outlier candidates, i.e.,
where m is the number of true outliers found with t outlier candidates.This criterion is also called precision@m34 in the literature. Since t is hard to be set for each specifical application. Assigning t as the number of outliers in the ground truth is a commonly used strategy. - 3.
Average precision (AP)35. Instead of evaluating only at a single value of n, Average precision refers to the mean of precision scores over the ranks of all outlier objects.
- 4.
Rank Power (RP). Rank power is another popular measurement to evaluate the performance of outlier detection methods. It is clear that an outlier ranking algorithm will be regarded more effective if it ranks true outliers in the top of the list of outlier candidates. The rank power can be defined as follows:
where m is the number of outliers in the top t potential objects and Ri is the rank of the i-th true outlier. Given a fixed t, a larger value indicates better performance. Especially when the t outlier candidates are true outliers, the rank power equals to 1. - 5.
Correlation coefficient. Correlation coefficients, like Spearman’s rank similarity or Pearson correlation, are also used in evaluating the performance of outlier detections in literature36. This kind of measurements place more emphasis on the potential outliers ranked at the top by using incorporate weights. More details can be found in the ref. 36 and references within36.
3.2. Dataset Resources
In the outlier detection experiments, the synthetic datasets and real-world datasets are usually used to testify the performance in the literature. The synthetic datasets can be generated according to specific applications at hand. For instance, Wang et al.37 provided some synthetic datasets with outliers in different scenarios. The real-world data dataset often comes from three sources shown as follows:
- 1.
UCI Machine Learning Repository. Many of the data mining algorithms take the UCI repository 38 as a valuable source to evaluate their performance. Note that most of these datasets have been proposed for the evaluation of classification methods. For outlier detection task, the commonly used strategy is to preprocess the datasets by taking the objects within the minor class as outliers and the rest as normal ones.
- 2.
ELKI Datasets. ELKI is an actively developed and maintained ‘Environment for developing KDD-applications supported by Index-structures’ 7. The recent releases are especially dedicated to outlier detection. The platform not only provide the outlier detection algorithms, but also offers several data sets for outlier detection evaluation39.
- 3.
Spatial Data. The collection of spatial data 40 is donated by Chicago University. Although it is used for spatial analysis originally, these spatial data, including Census Tract Data and Zip Code Business Patterns, can be also used for outlier detection.
As mentioned above, the datasets mostly used in classification need to be preprocessed for the outlier detection tasks. During the preprocessing, two cases may be considered 41: For semantically meaningful outlier datasets, the classes, which are associated with rare objects are regarded as outliers, and the rest is regarded as normal data. For other datasets, the outlier classes are chosen from the datasets randomly. Specially, for the datasets only have two classes, the class with minor objects is often treated as outliers.
4. Experimental Comparison
In this section, we make an experimental comparison of ten popular outlier detection algorithms on 9 datasets. The outlier detection algorithms include kNN, kNNW, ODIN, LOF, LoOP, COP, SOD, FastABOD, HiCS and Gaussian Uniform Mixture Model(GUMM). They are often used as baselines in literature, because they have relatively good performance.
The experimental datasets were downloaded from the UCI repository and the ELKI toolkit. The details of the datasets are given in Table 2, where ‘N’ and ‘O’ refer to the numbers of all objects and outliers respectively. We adopted the same step of process in ref.42, when preprocessed the datasets. For example, for the Annthyroid data consisting of 7200 objects, we took the class ‘hyper-function’ and class ‘subnormal’ as outliers, and class ‘healthy’ as inliers in our experiments. Thus, there were 534 outliers and 6666 normal objects in this dataset.
| Dataset | N(O) | Attribute | Outliers(out.) vs. inliers(in.) |
|---|---|---|---|
| Annthyroid | 7200(534) | 21 | hyper-function,subnormal (out.) vs. healthy(in.) |
| ALOI | 50000(1508) | 27 | The 1-1508 objects(out.) vs. others(in.) |
| Arrhythmia | 450(206) | 259 | arrhythmia (out.) vs. healthy(in.) |
| Cardiotocography | 2126(471) | 21 | pathologic,suspect(out.) vs. healthy(in.) |
| PageBlocks | 5473(560) | 10 | Non-text(out.) vs. text(in.) |
| Parkinson | 195(147) | 22 | Parkinson(out.) vs. Health(in.) |
| SpamBase | 46011813 | 57 | spam(out.) vs. non-spam(in.) |
| Stamps | 340(31) | 9 | forged(out.) vs. Genuine(in.) |
| WPBC | 198(47) | 33 | Class ’R’(out.) vs. class ’N’(in.) |
Experimental datasets used in our experiments.
The comparison experiments were conducted under the ELKI framework. For the parameters involved within the outlier detection algorithms, their values were assigned to default ones. In the experiments, three evaluation measurements, i.e., AUC, Precision, and Rank Power, were taken to testify the performance of the detection algorithms.
AUC is a popular performance evaluation for outlier detection techniques. Table 3 presents the experimental results of AUC on 9 datasets. From Table 3, one may observed that kNN, kNNW, HiCS had a relatively high performance, while GUMM performed lower in many cases. For instance, kNN and kNNW achieved relatively good performance on Arrhythmia, Cardiotography, Spambase and WPBC. HiCS had the highest AUC on PageBlocks, Parkinson, Stamps and WPBC. On the contrary, GUMM had relatively low performance on 7 dataset and get the worst performance on 4 dataset including Arrhythima, PageBlocks, Cardiotocography and Spambase. The reason is that Gaussian method is greatly affected by data distributions, while the real world datasets are very complicated and their distributions are difficult to presume. Spambase dataset describes the word and char frequency in the email text, these digital frequencies provide very few group properties and have little similar characters inherently. Thus, FastABOD is not suitable for such data set, since it calculates the similarity of objects via the cosine value of angle. The same to Stamps dataset. ann-thyriod dataset contains three classes relate to the conditions ‘normal’, ‘hyper-function’, and ‘subnormal functioning’ for hypothyroidism, since the relevant correlation of attributes is very high in this dataset, COP has good performance because it depend on the correlation analysis of attributes.
| Dataset | FastABOD | kNN | kNNW | ODIN | LOF | LoOP | COP | SOD | GUMM | HiCS |
|---|---|---|---|---|---|---|---|---|---|---|
| Annthyroid | 0.51 | 0.53 | 0.50 | 0.56 | 0.58 | 0.52 | 0.75 | 0.47 | 0.50 | 0.58 |
| ALOI | - | 0.72 | 0.74 | 0.81 | 0.78 | 0.80 | 0.77 | 0.78 | 0.57 | 0.62 |
| Arrhythmia | 0.74 | 0.75 | 0.75 | 0.71 | 0.74 | 0.73 | 0.70 | 0.73 | 0.47 | 0.70 |
| Cardioto. | 0.55 | 0.62 | 0.59 | 0.58 | 0.59 | 0.57 | 0.57 | 0.52 | 0.51 | 0.60 |
| PageBlock | 0.56 | 0.88 | 0.84 | 0.69 | 0.70 | 0.77 | 0.91 | 0.91 | 0.50 | 0.93 |
| Parkinson | 0.42 | 0.57 | 0.57 | 0.57 | 0.57 | 0.51 | 0.57 | 0.53 | 0.51 | 0.72 |
| SpamBase | 0.01 | 0.64 | 0.63 | 0.51 | 0.52 | 0.54 | 0.50 | 0.55 | 0.50 | 0.55 |
| Stamps | 0.01 | 0.93 | 0.90 | 0.81 | 0.95 | 0.67 | 0.69 | 0.62 | 0.87 | 0.95 |
| WPBC | 0.48 | 0.54 | 0.49 | 0.55 | 0.44 | 0.48 | 0.52 | 0.51 | 0.47 | 0.56 |
The experimental results of AUC on 9 datasets.
In order to reveal the influence of parameters on the algorithm, some k nearest neighborhood-based methods is compared in the experiment, where k changes from 3 to 50. Fig. 2 shows the Precision scores of the outlier detection methods on 9 datasets. Since FastABOD has the problem during the computation on ALOI, and has almost 0 scores on Stamps, Spambase, Ann-thyriod, Arrhythmia, Cardiotocograhpy, its Precision scores was not provided in Fig. 2.

The experimental results of Precision on 9 datasets with k from 3 to 50.
As showed in Fig. 2, FastABOD are seen to be least affected by the variation of k, and HiCS is more heavily affected by the parameter k. Compared to the basic kNN technique, kNNW is less sensitive to the value of k, since it computes the outlier scores of an object as the sum of its distances from its k nearest neighbors. As for density-based outlier detection techniques, LoOP, which uses a local statistical density estimation, is less affected by the size of the neighborhood than LOF method.
| Dataset | FastABOD | kNN | kNNW | ODIN | LOF | LoOP | COP | SOD | GUMM | HiCS |
|---|---|---|---|---|---|---|---|---|---|---|
| Annthyroid | 0 | 0.07 | 0.04 | 0.14 | 0.04 | 0.06 | 0.25 | 0.05 | 0 | 0 |
| ALOI | - | 0.3 | 0.43 | 0.92 | 0.37 | 0.47 | 0.57 | 0.64 | 0 | 0.12 |
| Arrhythmia | 0.94 | 0.99 | 0.98 | 0.65 | 0.91 | 0.91 | 0.65 | 0.87 | 0.43 | 0.90 |
| Cardioto. | 0.37 | 0.70 | 0.69 | 0.40 | 0.53 | 0.48 | 0.37 | 0.50 | 0.31 | 0.22 |
| PageBlock | 0.58 | 0.41 | 0.30 | 0.22 | 0.24 | 0.20 | 0.50 | 0.84 | 0 | 0.07 |
| Parkinson | 0.5 | 0.77 | 0.79 | 0.74 | 0.68 | 0.71 | 0.91 | 0.80 | 0.9 | 0.85 |
| SpamBase | 0 | 0.10 | 0.15 | 0.31 | 0.10 | 0.27 | 0.32 | 0.26 | 1.0 | 0.09 |
| Stamps | 0 | 0.29 | 0.42 | 0.71 | 0.38 | 0.32 | 0.15 | 0.32 | 0.25 | 0.36 |
| WPBC | 0.19 | 0.23 | 0.22 | 0.23 | 0.25 | 0.21 | 0.10 | 0.20 | 0.13 | 0.23 |
Rank power of the top 50 (i.e., s=50) outlier candidates achieved by the outlier detection algorithms with k=10.
Another interesting fact is that the Precision of the compared algorithms varied greatly on Stamps and PageBlocks datasets, One reason is that the proportion of outliers on these data sets is very small (as for Stamps(9%), PageBlocks(10%)),making the outlier detection algorithms more sensitive to the values of k. On the contrary, the Precision are less sensitive to k values on those datasets with higher outlier proportion, such as Spambase(39.4% outliers) and Arrhythin(45.7% outliers).
In the experiments, rank power is also adopted to validate the performance of the outlier detection methods. For each detection method, the top 50 suspicious outliers are used to estimate the value of rank power. Tab. 4 shows the rank power scores of outlier detection methods on 9 datasets.
It can be observed that, similar to AUC, the rank power of kNN-based method had a relatively stable performance, while GUMM, FASTABOD, HiCS performed unsteadily in some cases. It can also be seen that the subspace method such as SOD and HiCS have relative high result on 3 datasets including Parkinson, PageBlocks and Arrhythmia. The reason is that there are some irrelevant features on these dataset, and the subspace-based learning methods can work very well on these datasets.
5. Challenges and Future Work
Although there have been some notable results on outlier detection methods, they are far to be perfect with lots of open questions remained to be solved. Here ,we list some of questions as follows:
- •
The kNN-based methods are generally sensitive to the parameter k. How to determine the right number of neighbors for each object is a challenge for the neighbor ranking-based outlier detection methods.
- •
Outliers often present locally abnormal behaviors. However, exploring local correlations of features from a high-dimensional space is not an easy work. Besides, how to exactly measure the correlations makes the problem more challenging.
- •
If the diversity of the subspace or learning bases is large, the ensemble-based and subspace-based detection methods may have relatively good performance. However, this condition always can not be satisfied. How to choose right subspaces or learning bases, as well as their quantities and their combining strategies is still a challenging issues. Besides, the outlier scores generated by individual learning bases should also be consistent with the perspective of consensus.
- •
For high-dimensional data, distances-based scores may still provide a reasonable ranking, but the scores appear to be very close to each other. It is difficult to choose a threshold between inliers and outliers based on these scores.
- •
Since outliers are relatively rare in dataset and the ground truth is always not available, how to effectively evaluate the performance of the outlier detection methods is also an open problem.
6. Conclusion
In this survey, we discussed some typical problems of outlier detection associated with high-dimensional data, and attempted to provide an overview of state-of-the-art outlier detection techniques on high-dimensional data. Furthermore, we have made an extensive experiment on public datasets to evaluate the popular outlier detection methods. In the experiments, we discussed the data processing and different evaluation measures for outlier detection task. We also compared the performance of different methods on a wide variety of datasets by taking the most commonly used measurement into account, and provided a perspective analysis on the effectiveness of these typical outlier detection techniques. Finally, we discussed the the challenges and future work of outlier detection techniques for the high-dimensional data.
Acknowledgments
This work was supported by the NSF of Zhejiang Province (LGG18F020017,LY18F020019, LZ14F030001),the National Science Foundation (NSF) of China (61572443,61672467), the Shanghai Key Laboratory of Intelligent Information Processing (IIPL-2016-001), and the fund of Chongqing (CSTC2017ZDCY-ZDYF0366 and YJG152002).
Reference
Cite this article
TY  - JOUR
AU  - Xiaodan Xu
AU  - Huawen Liu
AU  - Li Li
AU  - Minghai Yao
PY  - 2018
DA  - 2018/01/22
TI  - A Comparison of Outlier Detection Techniques for High-Dimensional Data
JO  - International Journal of Computational Intelligence Systems
SP  - 652
EP  - 662
VL  - 11
IS  - 1
SN  - 1875-6883
UR  - https://doi.org/10.2991/ijcis.11.1.50
DO  - 10.2991/ijcis.11.1.50
ID  - Xu2018
ER  -