
Multimodal biometrics Fusion based on TER and Hybrid Intelligent Multiple Hidden Layer Probabilistic Extreme Learning Machine
- DOI
- 10.2991/ijcis.11.1.71How to use a DOI?
- Keywords
- MultiBiometrics; Total Error Rate(TER); Extreme Learning Machine(ELM); Differential Evolution(DE); Particle Swarm Optimization(PSO)
- Abstract
In this paper, a novel fusion method based on Total Error Rate (TER) and multiple hidden layer probabilistic extreme learning machine is proposed. At first, the study transfers the matching scores into TER based on corresponding False Reject Rates (FRR) and False Accept Rates (FAR) aims at avoiding to calculating the posterior probability. At the second, a new fusion strategy based on multiple hidden layer probabilistic extreme learning machine is introduced, which optimizes the architecture of hidden nodes by weighted calculation of different output matrices and then transforms the numeric output of ELM to the probabilistic outputs and unifies the outputs in a fixed range, the matrices weights and the output weights are optimized using a hybrid intelligent algorithm based on differential evolution and particle swarm optimization. Experiment result shown that the proposed method renders very good performance as it is quite computationally and outperforms the traditional score level fusion schemes, the experimental result also confirms the effectiveness of the proposed method to improve the performance of multibiometric system.
- Copyright
- © 2018, the Authors. Published by Atlantis Press.
- Open Access
- This is an open access article under the CC BY-NC license (http://creativecommons.org/licences/by-nc/4.0/).
1. Introduction
Face, fingerprint and iris have been explored to recognize humans in some extent [1]. However, the recognition performance of these unimodal biometric recognition system are not ideal in some case because they are plagued by some drawbacks. For example, noise in the input samples, nonuniversality, usceptibility of the result to the quality of the sample, its orientation/rotation and distortion, risk of spoofing and others [2]. confronted by the limitation of the unimodal recognition systems, multimodal biometric recognition systems try to alleviate these disadvantages by consolidating the evidence presented by multiple biometric sources in order to in order to improve the recognition performance. Compared to the unimodal recognition system, the multimodal biometric system have several merits:1) it is address the problem of nonuniversality which encountered by unimodal system; 2)they limit the ability of an impostor to spoof multiple biometric features of a legitimately enrolled sample;3) it is can solve the problem of noisy input data effectively;4) it can viewed as fault tolerant recognition systems due to the reason of they can operate continuously even when some biometric resources become unbelievable and unreliable.
According to the level of information fused, we can subdivide them in five categories [3]: sensor level fusion, feature level fusion, matching level fusion, rank level fusion and decision level fusion. Among them, score level fusion is the most frequently utilized because of easy availability of the scores and contains ample information to discriminate between genuine and impostor scores. Already existing score level fusion approaches can be categorized into three classes: transformation-based, density-based and classifier-based.
In conclusion, the transformation-based fusion approach, with no training process and few consideration of distribution of matching scores and it is easy to implement [7]. On the contrary, density-based fusion method, which requires accurate estimation of density and huge number of training samples, is hard to carry out for the following reasons: firstly, positive samples, namely genuine matching scores are limited in today’s multi-biometric systems, secondly, it is difficult to estimate the density of matching scores in that they may not obey a certain distribution model. Classifier-based fusion has its advantage of freeing from the restriction of different distribution of matching scores, but it needs sufficient training samples and new training for a different system.
In our previous works, we had explored the potential of False Reject Rates (FRR) and False Accept Rates(FAR) using in the score level fusion. In [8], we proposed a fusion method based on FAR and FRR using triangular norm avoiding to calculate the posterior probability of a certain source. In [9], a novel fusion strategy based on total error rate (TER) and feature correlation adaptive fusion is given. From the results in [8] and [9] we find that the improvement of the recognition performance are not obviously, and we are not good use of the feature correlation information.
Based on the above analysis of the advantages and drawbacks of the existing methods and our previous works, in this paper, a novel hybrid fusion method is proposed which based on TER and Multiple Hidden Layer Probabilistic Extreme Learning Machine (MHP-ELM). At first, the study transfers the matching scores into TER based on corresponding False Reject Rates (FRR) and False Accept Rates(FAR) aims at avoiding to calculating the posterior probability. At the second, a new fusion strategy based on hybrid intelligent multiple hidden layer probabilistic extreme learning machine(HMP-ELM) is introduced, which optimizes the architecture of hidden nodes by weighted calculation of different output matrices and then transforms the numeric output of ELM to the probabilistic outputs and unifies the outputs in a fixed range, in this strategy, the matrices weights μ of the Multiple Hidden Layer Extreme Learning Machine(M-ELM) and the output weights β belongs to the ELM are optimized using a hybrid intelligent algorithm based on Differential Evolution and Particle Swarm Optimization(DEPSO).
The main contributions of this paper can be summarized as follows: 1) Based on our previous works, this paper still using the total error rate (TER) instead of matching scores as the matching character in fusion process. 2) A novel fusion scheme based on Hybrid Intelligent Multiple Hidden Layer Probabilistic Extreme Learning Machine (HMP-ELM) is given in this paper. To our knowledge, this is the first time to utilize the ELM for information fusion. 3) In order to explore a optimal parameter belong to the Extreme Learning Machine, a new optimization strategy to the two weighted parameters based on Differential Evolution and Particle Swarm Optimization(DEPSO) is proposed.
The remainder of this paper is organized as follows: Section II reviews some related works. Section III provides the background knowledge required for proposing the new fusion method. In Section IV, the detail of the Hybrid Intelligent Multiple Hidden Layer Probabilistic Extreme Learning Machine (HMP-ELM) is briefly discussed. The proposed new fusion method is given in Section V. Hence, the experiments result is presented in Section VI. Section VII conclude our work and outlines our future work to generalize the method to multibiometric recognition system.
2. Related Works
In the previous researcher’s works[10], most multibiometric fusion system always use fixed fusion rules with some parameters, these fusion method tuned to reach the desired recognition accuracy for a fixed security level. However, we had found most multimodal biometric recognition system select the the best fusion methods or the fusion parameters automatically in order to enhance the recognition performance.
In [11], Tronci et al. Proposed a dynamic score selection scheme for multiple biometric matchers fusion, the best matching score is selected based on the likelihood of the users when is being a genuine or an impostor, but the fusion performance of this method is poor. In [12], Veeramachaneni et al. Introduced a novel fusion method called “ Adaptive Multiple Biometric Fusion Algorithm(AMBF)” which based on the combination of Bayesian decision and Particle Swarm Optimization(PSO), in this fusion method, the author have considered that the multibiometric recognition system is composed of N classifiers, so there are 22N possible fusion rules will be used but only a part of these fusion rules can be used to improve the fusion performance under a Bayesian framework to fuse decisions returned from the classifiers.
In [13], Srinivas et al also presented a new fusion scheme in order to enhancing the recognition performance of correlated biometric classifiers, in this fusion technique, the fusion weight is associated with each classifier and then computed by PSO, in the final, the weight is adapted based on the correlation between different classifiers. The author have claimed that the fusion technique proposed in this paper is outperforms the traditional weighted sum fusion rules.
In [14], Kumar et al proposed a fusion approach based on a hybrid PSO modal which used to determine the optimal fusion parameters, in this method, it can ensure an optimal fusion performance in a dynamic architecture which include multiple fusion rules such as sum, product, exponential sum and tan-sum. The author final claimed that the method proposed in this paper can achieve a better recognition performance than the decision level adaptive fusion method.
In [15], Anzar et al proposed a PSO scheme in the weighted sum fusion rule. It uses d-prime statistic to enhance the recognition performance under various noise conditions which the weights are computed as the ratio between the genuine and the impostor score distribution while the best weights are founded by PSO.
In [16], Kien et al proposed a score level fusion technique based on D-S theory and uncertain factors. The research seeks to develop a unified framework for multimodal biometric fusion to take advantages of the uncertainty concept of the D-S theory. In the fusion process, the quality measures and classifiers performance are combined.
In [17], Lamia et al proposed a score level fusion algorithm using Differential Evolution and Proportional Conflict Redistribution Rule. DE technique is used to find the best confidence factors of the belief assignments of the difference modalities and Proportional Conflict Redistribution Rule is used to compute the weight.
In our previous work, a novel approach is proposed for the fusion at score level fusion based on False Reject Rate(FRR) and False Accept Rate(FRR) using triangular norms(t-norms). This study aims at tapping the potential of t-norms for information fusion at first, at the second, it transfers scores into Transfer function based on corresponding FRRs and FARs, thus avoiding calculating posterior probability of a certain score. In the [9], A novel approach is proposed based on Total Error Rate (TER) and feature correlation adaptive fusion method. The new adaptive fusion method adjusting the fusion weights adaptive between weight sum fusion scheme and multiplicative fusion scheme using the characteristic of correlation coefficient.
3. Preliminary
In this part, we will give the notation of Extreme Learning Machine(ELM) - Multiple Hidden Extreme Learning Machine(M-ELM) and Probabilistic Extreme Learning Machine(P-ELM).
3.1. Extreme Learning Machine (ELM)
Extreme Learning Machine[18] is a high efficient learning algorithm that proposed on the singer-hidden layer neural network, unlike other different traditional neural network, all the parameters in the Extreme Learning Machine are generate randomly and the complicated iteration process is avoid. Suppose the training set
In equation (1), the parameter aj is the input weight of the jth hidden node, bj is the deviation of the jth hidden node, and βj is the weight of the jth hidden node to the output node of the ELM. G(aj, bj, xi) is the output function of the jth hidden node, from the equation (1), we will obtain that h(xi) = [G(a1, b1, xi),...,G(a1, b1, xi)] is the output of hidden layer regard to training sample xi. In order to enhance the ability of generalization of the ELM, we describe the ELM to the optimization problem when we using for classification problem in the form of equation (2):
In order to eliminate the excessive fitting phenomenon, we introduce a training error ξi, and the corresponding punish factor is C, so this optimization problem can transform into the dual problem:
So from the equation (4) to equation (6), we can obtain:
We can compute the output weight β Using equation (8) directly, then the output equation of the ELM can describe as:
In the training process of the ELM, there is only one parameter to be determined, i.e. the punish coefficient C.
3.2. Multiple Hidden Extreme Learning Machine (M-ELM)
In traditional Extreme Learning Machine method, there is only single form about its hidden output matric and the parameter will be computed randomly. But in the Multiple Hidden Extreme Learning Machine, if there are C different basic matric, then we will generate a new hidden output matric through a weighting strategy as follows[25]:
In this notation, the coefficients μk is called weighting coefficients which using to weighting different basic matric. In the traditional Extreme Learning Machine method, the core of the optimization problem is to solve the output weight β, but in this M-ELM method, we also need to compute the coefficients μk. Then, a new optimization problem will be tackling as follows:
3.3. Probabilistic Extreme Learning Machine (P-ELM)
The traditional Extreme Learning Machine method is always using for classification problem, in this part, we introducing a Probabilistic Extreme Learning Machine (P-ELM).
In the P-ELM, we modify the project process at first, so the output of the ELM given in the equation (9) will be transformed as[26]:
Through this operation, we transfer the output of the traditional ELM into the probabilistic form, further more, and normalize the probabilistic output P(fi(x)) so we will obtain the probability of the input sample x belongs to the label i in the numerical sense and we mark it as pi(x) :
Using the equation (16), we can transfer the output of the PELM into the stiff discriminate way:
4. The proposed Hybrid Intelligent Multiple Hidden Layer Probabilistic Extreme Learning Machine (HMP-ELM)
In this part, the proposed Hybrid Intelligent Multiple Hidden Layer Probabilistic Extreme Learning Machine (HMP-ELM) will be given. At first, we are using the Multiple Hidden Layer Extreme Learning Machine instead of traditional Extreme Learning Machine. For the kth classifier in the recognition system, we will obtain its output fik(x), while fik(x) stands for the output belongs to the label i in the numerical sense and kth classifier. Then, the outputs of different classifiers that come from the M-ELM are transfer into probabilistic output forms using equation (14). After this process, the numerical output will change into pik(x). In the next fusion process, the pik(x) will be using for fusion.
In our proposed new Hybrid Intelligent Multiple Hidden Layer Probabilistic Extreme Learning Machine (HMP-ELM), the key of the method is the computation of the matrices weights μ of the Multiple Hidden Layer Extreme Learning Machine (M-ELM) and the output weights β belongs to the ELM. In this part, a improved hybrid intelligent optimized strategy called Differential Evolution Particle Swarm Optimization (DEPSO) which inspired from the idea of Frog Leaping algorithm (FLA) is proposed while based on differential evolution (DE) and particle swarm optimization (PSO).
The iteration process of the traditional Frog Leaping algorithm (FLA) is consisting of three parts: partial meme group, evolve in different meme group isolated and hybrid meme group, the iterative evolution process has been running until the termination condition is met. The new proposed DEPSO optimization algorithm using the DE and PSO as evolution method and has the ability of meme evolution while derive from Frog Leaping algorithm (FLA) in order to improve the performance when taking the advantage of the two algorithms.
In this paper, the detailed steps of the Differential Evolution Particle Swarm Optimization which using for the computation of the matrices weights μ of the Multiple Hidden Layer Extreme Learning Machine (M-ELM) and the output weights β belongs to the ELM is stated as follows:
Step 1: Generate NP solutions as the initial population
Step 2: Divide the population P into Nk subpopulations averagely.
Step 3: Choose k subpopulations randomly while 1 < k < Nk, using the DE algorithm to compute the Iiter generation in the iteration process respectively. Regarding to the rest Nk ‒ k subpopulations, using the PSO algorithm to compute the Iiter generation in the iteration process respectively. In the entire iteration process, recording all the change of the optimal value to the all population.
Step 4: Mix Nk subpopulations in order to obtain the new population P, judge the number of the iteration of local search reaches the designated number of iterations.
Step 5: The algorithm is termination.
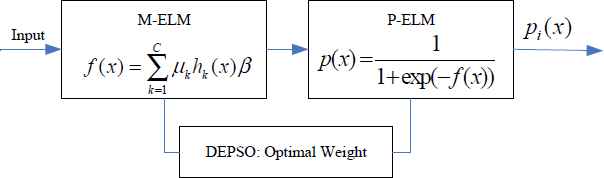
The diagram of HMP-ELM
The flowchart of the proposed Hybrid Intelligent Multiple Hidden Layer Probabilistic Extreme Learning Machine (HMP-ELM) is given as follows.
5. The Proposed Novel Fusion Strategy Based on HMP-ELM
In traditional Extreme Learning Machine strategy, it is always using for classification problems, in this paper, we using it for information fusion problem. To our knowledge, this is the first time to utilize the Extreme Learning Machine for information fusion problem.
The base of using the Extreme Learning Machine for information fusion problem is the introduction of Probabilistic Extreme Learning Machine, aimed to the multi classes classification problem, when we utilize M different classifier, we can compute the probabilistic output matric:
In this matric, each column stands for a probabilistic output of a classifier, the element pij(x) in the matric represent that the input sample x while discriminate it belong to the ith label using the jth classifier. While the computing of the probabilistic output matric equal to a normalization process to the traditional ELM. At the end, computing the fusion result.
Suppose there are M different classifier in the fusion recognition system, according to the equation (31), the probabilistic output of the the jth classifier to random test samples is the utmost value of all the output belong to this classifier, that is:
Then the fusion weight is computing using the adaptive computing strategy as:
The fusion output of the fusion system will stated as follows:
Specially, if there are two classifier in the fusion recognition system, the fusion strategy proposed by the equation (20) can be simplified as :
The pseudecode of this proposed fusion approach is stated as follows:
Pseudecode 1: The proposed fusion method using HMP-ELM.
Input: the matching score from M classifiers
- 1.
Transfer the matching scores into Total Error Rate.
- 2.
Compute the output of the M-ELM for different classifier using (28). Then, we will obtain fij(x).
- 3.
Using P-ELM, transfer the output into probabilistic form using (29).
- 4.
Fusing different classifier output using (33)∼(35).
Output: fusion recognition result
The flowchart of this fusion method is illustrated in Figure 2.
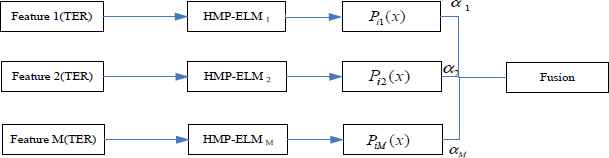
The flowchart of the proposed fusion method
6. Result and Discussion
6.1. Experimental settings
In this section, we will provide a wide range of different experimental results in different quarters to access the effectiveness of the proposed new fusion strategy.
Because of the main level of the interest in this paper is multi-biometric fusion recognition, so we put the multi-biometric as the main target in the experiments. In order to access the effectiveness of the proposed new method, we using the XM2VTS-Benchmark multi-biometric database in our experiments.
The XM2VTS-Benchmark multi-biometric database contains 295 people face image data and voice data, while all the face data and voice data are collected four times synchronically, each time be arranged at intervals of one months. In the database, there are five face recognition classifiers and three-speaker recognition classifiers. in our experiment, we set five face recognition classifiers as XF1, XF2, XF3, XF4, XF5; and the three-speaker classifier as XS1, XS2, XS3.
In these experiments, we choose several popular fusion methods for comparison, to evaluate the performance of the proposed novel fusion methods, such as LR method, Min-Max method, Tanh method, ELM method and the fusion method proposed in Reference [9] which it our former working. In the comparison experiments, we put the fusion method proposed in this paper as T method.
The experiments are include four parts:
- (1)
To evaluate the performance and robustness of the HMP-ELM. At first, we test the performance of the DEPSO, which proposed in this paper while using for normalize the matrices weights μ of the Multiple Hidden Layer Extreme Learning Machine (M-ELM) and the output weights β belongs to the ELM. Then, we test the performance of the HYP-ELM.
- (2)
We compare the recognition performance between different classify criteria. In this experiment, we conduct the raw matching scores and TER as the classify criteria respectively, and then to test the fusing recognition performance using different fusion methods in order to certificate that recognition performance which using TER is better than using raw matching scores.
- (3)
We test the recognition performance based on the fusion method proposed in this paper. In this experiment, we using the TER as the classify criteria and compare the recognition performance between the proposed fusion method and the other five fusion methods mentioned before.
- (4)
We compare the recognition accuracy and recognition time between different fusion methods. In this experiment, we using the TER as the classify criteria and compare the recognition accuracy and recognition time between the proposed fusion method and the other five fusion methods mentioned before.
6.2. evaluate the performance and robustness of the HYP-ELM
In this section, we will evaluate the performance and robustness of the Hybrid Intelligent Multiple Hidden Layer Probabilistic Extreme Learning Machine (HMP-ELM) that proposed in this paper. Firstly, we test and verify the optimization ability of the Differential Evolution Particle Swarm Optimization (DEPSO) algorithm that given in this paper which using for optimize the matrices weights μ of the Multiple Hidden Layer Extreme Learning Machine (M-ELM) and the output weights β belongs to the ELM. Secondly, we check the performance of the HMP-ELM algorithm proposed in this paper, in this experiment, we test the regression ability of the HMP-ELM and compare it to other ELM methods.
At first, we present the optimization ability of the Differential Evolution Particle Swarm Optimization (DEPSO) algorithm. In this experiment, we are using 10 typical functions, which stated in Table 1 in order to check the optimization ability. The dimension of the solution in every typical function D is setting as 30, the range of the solution of the typical function Fn6 is setting as [–100, 100], Fn9 is setting as [–500, 500], the remains is setting as [–30, 30].
| Function Name | Equations |
|---|---|
| Sphere | |
| Quadric | |
| Griewank | |
| Ackley | |
| Rosenbrock | |
| Rastrigin | |
| Schwefel’s 1.2 | |
| Griewank with noise | |
| Schwefel | |
| Schwefel’s 2.22 |
The typical optimization functions
In order to compare the performance the DEPSO algorithm, we compare it with three basic optimization algorithms: DE, PSO and FLA. The parameters in each method are showed in Table 2.
| Method | Parameter |
| DE | F = 0.5 CR = 0.3 |
| PSO | w = 0.729 c1 = c2 = 1.495 |
| FLA | C = 1.2 |
| DEPSO | Nk = 4 Iiter = 10 k = 4 |
The parameters in each method
In the numerical experiment, the scales of the population in four algorithms are all the same that means Np = 40, the number of the iteration in each method is 2000. For each typical function, the times of the optimization which using four optimization algorithm is 50 and the average optimization value will be utilized as the final optimization result. Table 3 outlined the optimization result using DE, PSO, FLA and DEPSO methods while make use of 10 typical functions.
| Function | Performance | DE | PSO | FLA | DEPSO |
|---|---|---|---|---|---|
| Fn1 | Mean | 1.7667e+002 | 1.2494e+003 | 1.1951e+002 | 1.2008e−009 |
| Variance | 7.3438e+001 | 2.5787e+002 | 4.1270e+001 | 7.4548e−010 | |
| Fn2 | Mean | 0.0000e+000 | 1.2494e+000 | 0.0000e+000 | 4.3528e−007 |
| Variance | 0.0000e+000 | 1.9059e−002 | 0.0000e+000 | 8.2034e−007 | |
| Fn3 | Mean | 9.8590e−001 | 1.2928e+000 | 1.0011e+000 | 8.4011e−004 |
| Variance | 9.2600e−002 | 6.0500e−002 | 3.5900e−002 | 1.5000e−003 | |
| Fn4 | Mean | 9.1589e+000 | 1.6711e+001 | 7.8190e−000 | 8.6480e−004 |
| Variance | 1.4730e+000 | 7.4780e−001 | 1.1279e−000 | 7.0593e−006 | |
| Fn5 | Mean | 2.9764e+005 | 1.3255e+007 | 1.2866e+005 | 2.6678e+001 |
| Variance | 1.9895e+00 | 6.2356e+006 | 7.4297e+004 | 9.3772e+000 | |
| Fn6 | Mean | 3.6770e+002 | 1.6137e+003 | 8.1555e+002 | 1.4644e+002 |
| Variance | 7.3999e+001 | 3.3505e+00 | 1.2285e+001 | 1.2235e+001 | |
| Fn7 | Mean | 2.3981e+004 | 3.7054e+005 | 7.7842e+002 | 2.3319e+002 |
| Variance | 9.3795e+003 | 9.5826e+004 | 3.7931e+002 | 1.4052e+001 | |
| Fn8 | Mean | 3.8400e−002 | 3.1190e−001 | 1.4609e−003 | 8.9489e−004 |
| Variance | 1.3400e−002 | 6.6700e−002 | 5.2516e−002 | 1.3616e−004 | |
| Fn9 | Mean | 6.8456e+003 | 7.4513e+003 | 7.5097e+003 | 4.4974e+003 |
| Variance | 1.4465e+003 | 6.2601e+002 | 6.1316e+002 | 3.6771e+002 | |
| Fn10 | Mean | 5.5864e+001 | 2.0366e+002 | 8.8238e+002 | 1.0276e−004 |
| Variance | 1.2322e+001 | 2.3497e+001 | 4.0068e+001 | 3.7921e−005 | |
The optimization result using different methods
From the optimization results which shown in Table .3, we can found that when we taking optimization experiment to the typical function Fn2, the searching performance obtained using four optimization algorithms all can reach a ideal result. While the optimization result taking another nine typical functions can be summary as follows: (1). For the precision of searching results, the proposed DEPSO optimization method is better than the DE, PSO and the FLA methods obviously when it taking to the other nine typical functions, and its can obtain more precise solution. (2). For the ability of out of local minimum, the PSO algorithm falls into the minimum value point quickly and the length which play the major role in the time domain in the optimization periods is very short; for the proposed DEPSO strategy, its can out of the local minimum continuously in the iteration process in order to search the optimal solution and its have a better searching ability. In conclusion, the proposed DEPSO optimization method have a better improvement in the searching optimization ability and its have a good balance to the searching optimization precision and convergence speed.
After testing the performance of DEPSO optimization, we evaluate the regression computing ability of the proposed HMP-ELM. In this experiment, six classical real databases are being used: Servo database, Cancer database, Autompg database, CPU database, Price database and Housing database and all the database are download from http://www.ics.uci.edu . In the experiment, all the database are divided into two categories: training database and testing database which the specification are given in Table.4:
| Database | Training Data | Testing Data |
|---|---|---|
| Servo | 80 | 87 |
| Cancer | 100 | 94 |
| Autompg | 220 | 178 |
| CPU | 100 | 109 |
| Price | 80 | 79 |
| Housing | 250 | 256 |
The classical real database
In the regression computing ability testing experiment of the proposed HMP-ELM method, the number of hidden point is setting as 20, and Iiter = 10, Iiter max = 1000. The average optimal value and mean variance of the proposed HMP-ELM which taking 50 times regression computing simulation under the six classical real database are stated in Table.5. In the experiment, we compared the proposed HMP-ELM method to the Differential Equation Extreme Learning method (DE-ELM) and Self-Adaptive 8Evolutionary Extreme Learning Machine method. (SAE-ELM).
| Database | Criteria | DE-ELM | SAE-ELM | HMP-ELM |
|---|---|---|---|---|
| Servo | Mean | 0.1051 | 0.0084 | 0.0735 |
| Variance | 0.0025 | 0.0161 | 0.0109 | |
| Cancer | Mean | 0.2663 | 0.2561 | 0.2254 |
| Variance | 0.0208 | 0.0217 | 0.0116 | |
| Autompg | Mean | 0.0691 | 0.0631 | 0.0598 |
| Variance | 0.0129 | 0.0100 | 0.0044 | |
| CPU | Mean | 0.0528 | 0.0396 | 0.0035 |
| Variance | 0.0238 | 0.0083 | 0.0004 | |
| Price | Mean | 0.0494 | 0.0437 | 0.0432 |
| Variance | 0.0094 | 0.0094 | 0.0068 | |
| Housing | Mean | 0.0965 | 0.0904 | 0.0767 |
| Variance | 0.0137 | 0.0132 | 0.0087 | |
The regression computing results under six classical real database
From the experiments shown in the Table.5, we can found that the computation results which obtained using proposed HMP-ELM are more precise than the DE-ELM and SAE-ELM methods, that means the HMP-ELM method proposed in this paper have a good regression computing ability.
6.3. compare the recognition performance between different classify criteria
In this section, we will evaluate the performance of Total Error Rate as the fusion classify criteria, In this experiment, we conduct the raw matching scores and TER as the classify criteria respectively, and then to test the fusing recognition performance using different fusion methods in order to certificate that recognition performance which using TER is better than using raw matching scores. And in the comparing experiment, the purpose is to evaluate the fusion classify criteria, so we taking five basic fusion strategy: LR method, Min-Max method, Tanh method, ELM method and the fusion method proposed in Reference [9] which it our former working. Table 6 to Table 8 are the fusion recognition results based on different biometric system which using the raw matching score as the classify criteria, Table 9 to Table 11 are the fusion recognition results based on different biometric system which using the TER as the classify criteria. In the recognition results shown in Table 7 and Table 10, the symbol XF1-XS1 represents the fusion of modal XF1 and modal XS1, and others are and so on and so forth. {XS} represents the fusion of all the speech modals, that means the fusion of XS1, XS2 and XS3, in the same way, the symbol {XF} represents the fusion of all the face modals, that the fusion of XF1, XF2, XF3, XF4 and XF5. The symbol {XS}-XF1 means the fusion of muti-modals: all the speech modals and face modal XF1. In the experiments, we are using the Equal Error Rate (EER) as the evaluation criteria in the fusion recognition system.
| XF1 | XF2 | XF3 | XF4 | XF5 | XS1 | XS2 | XS3 | |
|---|---|---|---|---|---|---|---|---|
| EER (%) | 2.615 | 5.038 | 5.988 | 5.052 | 7.663 | 2.586 | 8.308 | 6.675 |
EER of each unimodal biometric recognition system based on matching score
| EER(%) | XF1-XS1 | XF1-XS2 | XF1-XS3 | XF2-XS1 | XF2-XS2 | XF2-XS3 | XF3-XS1 | XF3-XS2 | XF3-XS3 | XF4-XS1 | XF4-XS2 | XF4-XS3 | XF5-XS1 | XF5-XS2 | XF5-XS3 |
|---|---|---|---|---|---|---|---|---|---|---|---|---|---|---|---|
| Reference [9] | 0.332 | 0.961 | 0.952 | 0.952 | 2.225 | 1.454 | 0.635 | 1.611 | 1.205 | 0.919 | 1.270 | 0.994 | 0.668 | 3.817 | 2.223 |
| ELM | 0.935 | 1.969 | 1.405 | 1.318 | 1.970 | 2.271 | 1.266 | 1.531 | 1.367 | 1.172 | 1.259 | 1.126 | 1.446 | 3.374 | 2.027 |
| LR | 0.823 | 1.489 | 1.276 | 1.341 | 2.157 | 1.915 | 1.069 | 1.546 | 1.368 | 0.889 | 1.266 | 1.508 | 1.173 | 3.323 | 2.376 |
| Min-Max | 1.379 | 1.783 | 1.601 | 0.883 | 2.247 | 1.761 | 0.830 | 1.783 | 1.171 | 1.696 | 1.822 | 2.083 | 3.421 | 4.522 | 4.840 |
| Tanh | 1.188 | 2.072 | 1.172 | 0.873 | 2.374 | 1.772 | 0.875 | 2.071 | 1.479 | 1.173 | 1.776 | 1.772 | 1.649 | 3.871 | 3.425 |
The EER comparison between different fusion methods on double modals recognition system based on matching score
| EER(%) | {XS} | {XF} | {XS} XF1 | {XS} XF2 | {XS} XF3 | {XS} XF4 | {XS} XF5 | {XF} XS1 | {XF} XS2 | {XF} XS3 |
|---|---|---|---|---|---|---|---|---|---|---|
| Reference [9] | 3.254 | 1.988 | 1.231 | 1.520 | 1.344 | 1.347 | 1.629 | 1.341 | 1.476 | 1.433 |
| ELM | 2.996 | 4.203 | 1.535 | 2.182 | 2.562 | 1.645 | 2.922 | 3.091 | 2.073 | 2.524 |
| LR | 1.922 | 2.434 | 0.692 | 1.017 | 1.068 | 0.825 | 1.017 | 1.341 | 1.664 | 1.645 |
| Min-Max | 2.756 | 2.312 | 1.124 | 1.042 | 1.016 | 1.055 | 1.743 | 1.956 | 1.988 | 1.988 |
| Tanh | 3.181 | 2.152 | 1.017 | 1.344 | 1.278 | 1.037 | 1.807 | 1.664 | 1.635 | 1.654 |
The EER comparison between different fusion methods on each muti-modals recognition system based on matching score
| XF1 | XF2 | XF3 | XF4 | XF5 | XS1 | XS2 | XS3 | |
|---|---|---|---|---|---|---|---|---|
| EER (%) | 1.814 | 4.115 | 1.767 | 3.500 | 6.500 | 1.109 | 6.500 | 4.500 |
EER of each biometric recognition system based on TER
| EER(%) | XF1-XS1 | XF1-XS2 | XF1-XS3 | XF2-XS1 | XF2-XS2 | XF2-XS3 | XF3-XS1 | XF3-XS2 | XF3-XS3 | XF4-XS1 | XF4-XS2 | XF4-XS3 | XF5-XS1 | XF5-XS2 | XF5-XS3 |
|---|---|---|---|---|---|---|---|---|---|---|---|---|---|---|---|
| Reference [9] | 0.260 | 0.756 | 0.750 | 0.750 | 1.750 | 1.146 | 0.500 | 1.269 | 0.949 | 0.718 | 1.000 | 0.783 | 0.526 | 3.000 | 1.750 |
| ELM | 0.466 | 1.328 | 0.858 | 0.785 | 1.328 | 1.579 | 0.742 | 0.962 | 0.826 | 0.664 | 0.736 | 0.625 | 0.892 | 2.499 | 1.376 |
| LR | 0.373 | 0.928 | 0.750 | 0.804 | 1.484 | 1.283 | 0.578 | 0.975 | 0.827 | 0.427 | 0.742 | 0.944 | 0.664 | 2.456 | 1.666 |
| Min-Max | 0.914 | 1.250 | 1.098 | 0.500 | 1.637 | 1.232 | 0.456 | 1.250 | 0.740 | 1.178 | 1.283 | 1.500 | 2.615 | 3.532 | 3.798 |
| Tanh | 0.764 | 1.500 | 0.750 | 0.500 | 1.750 | 1.250 | 0.500 | 1.500 | 1.000 | 0.750 | 1.250 | 1.250 | 1.148 | 3.000 | 2.628 |
The EER comparison between different fusion method on each double modals recognition system based on TER
| EER(%) | {XS} | {XF} | {XS} XF1 | {XS} XF2 | {XS} XF3 | {XS} XF4 | {XS} XF5 | {XF} XS1 | {XF} XS2 | {XF} XS3 |
|---|---|---|---|---|---|---|---|---|---|---|
| Reference [9] | 2.227 | 1.250 | 0.666 | 0.889 | 0.753 | 0.750 | 0.973 | 0.750 | 0.855 | 0.830 |
| ELM | 2.028 | 2.960 | 0.900 | 1.400 | 1.693 | 0.985 | 1.971 | 2.038 | 1.316 | 1.664 |
| LR | 1.199 | 1.594 | 0.250 | 0.500 | 0.500 | 0.352 | 0.500 | 0.750 | 1.000 | 0.985 |
| Min-Max | 1.843 | 1.500 | 0.583 | 0.520 | 0.500 | 0.526 | 1.061 | 1.225 | 1.250 | 1.250 |
| Tanh | 2.170 | 1.377 | 0.500 | 0.722 | 0.702 | 0.516 | 1.110 | 1.000 | 1.000 | 1.000 |
The EER comparison between different fusion methods on each muiti-modals recognition system based on TER
From the experiment shown in Table.6 and Table.9, we can find that the value of EER in the unimodal recognition system are very high due to the reason of the unimodal recognition system often influenced by the unpredicted noise and other factors, in the biometric recognition system, the more bigger value of EER is, the more worse is.
When we using the TER as the classify criteria, from the experiment results shown in Table.9, in the unimodal recognition system, for the face recognition system, the system XF3 has the best recognition performance, the value of EER only 1.767%, for the speech recognition system, the XS1 has the best recognition performance that the value of EER only 1.109%.
From the results shown in Table.7, Table.8, Table.10, Table.11, in the bio-modals fusion recognition system and multi-modals fusion recognition system, no matter which fusion method we choose, the recognition performance is better than the unimodal recognition system and the value of EER is more smaller than its in the unimodal system. For the bio-modal fusion recognition system, from the results shown in Table.7, when we using the raw matching scores as the classify criteria, the average value of EER of the five fusion methods is 1.7005%, from the results shown in Table.10, when we using the TER as the classify criteria, the average value of EER of the five fusion methods is 1.1866%. For the multi-modal fusion recognition system, from the results shown in Table.8, when we using the raw matching scores as the classify criteria, the average value of EER of the five fusion methods is 1.7934%, from the results shown in Table.10, when we using the TER as the classify criteria, the average value of EER of the five fusion methods is 1.0977%.
According to the average value of EER shown in the Tables above, when we using TER as the classify criteria compared to the traditional matching scores, the evaluation criteria EER has dropped in some extent. For example, in the bio-modals fusion recognition system, the average EER has dropped 0.5139% when using TER as the classify criteria compared to the traditional matching scores, in the multi-modals fusion recognition system, he average EER has dropped 0.6957% when using TER as the classify criteria compared to the traditional matching scores. So the experiment results demonstrate that using the TER as the classify criteria can improve the fusion recognition performance compared to the traditional matching scores.
6.4. test the recognition performance based on the HMP-ELM and TER
In this section, we test the recognition performance based on the fusion method proposed in this paper. In this experiment, we using the TER as the classify criteria and compare the recognition performance between the proposed fusion method and the other five fusion methods mentioned before. The experiment results shown in Table.12 and Table.13. In this experiment, we put the fusion method that based on HMP-ELM proposed in this paper and TER as T method.
| EER(%) | XF1-XS1 | XF1-XS2 | XF1-XS3 | XF2-XS1 | XF2-XS2 | XF2-XS3 | XF3-XS1 | XF3-XS2 | XF3-XS3 | XF4-XS1 | XF4-XS2 | XF4-XS3 | XF5-XS1 | XF5-XS2 | XF5-XS3 |
|---|---|---|---|---|---|---|---|---|---|---|---|---|---|---|---|
| T | 0.232 | 0.665 | 0.847 | 0.435 | 1.258 | 0.997 | 0.398 | 0.882 | 0.856 | 0.557 | 0.985 | 0.703 | 0.483 | 2.247 | 1.473 |
| Reference [9] | 0.260 | 0.756 | 0.750 | 0.750 | 1.750 | 1.146 | 0.500 | 1.269 | 0.949 | 0.718 | 1.000 | 0.783 | 0.526 | 3.000 | 1.750 |
| ELM | 0.466 | 1.328 | 0.858 | 0.785 | 1.328 | 1.579 | 0.742 | 0.962 | 0.826 | 0.664 | 0.736 | 0.625 | 0.892 | 2.499 | 1.376 |
| LR | 0.373 | 0.928 | 0.750 | 0.804 | 1.484 | 1.283 | 0.578 | 0.975 | 0.827 | 0.427 | 0.742 | 0.944 | 0.664 | 2.456 | 1.666 |
| Min-Max | 0.914 | 1.250 | 1.098 | 0.500 | 1.637 | 1.232 | 0.456 | 1.250 | 0.740 | 1.178 | 1.283 | 1.500 | 2.615 | 3.532 | 3.798 |
| Tanh | 0.764 | 1.500 | 0.750 | 0.500 | 1.750 | 1.250 | 0.500 | 1.500 | 1.000 | 0.750 | 1.250 | 1.250 | 1.148 | 3.000 | 2.628 |
The EER comparison between different fusion methods on each double modals recognition system
| EER(%) | {XS} | {XF} | {XS} XF1 | {XS} XF2 | {XS} XF3 | {XS} XF4 | {XS} XF5 | {XF} XS1 | {XF} XS2 | {XF} XS3 |
|---|---|---|---|---|---|---|---|---|---|---|
| T | 1.053 | 1.242 | 0.457 | 0.428 | 0.393 | 0.418 | 0.527 | 0.647 | 0.793 | 0.716 |
| Reference [9] | 2.227 | 1.250 | 0.666 | 0.889 | 0.753 | 0.750 | 0.973 | 0.750 | 0.855 | 0.830 |
| ELM | 2.028 | 2.960 | 0.900 | 1.400 | 1.693 | 0.985 | 1.971 | 2.038 | 1.316 | 1.664 |
| LR | 1.199 | 1.594 | 0.250 | 0.500 | 0.500 | 0.352 | 0.500 | 0.750 | 1.000 | 0.985 |
| Min-Max | 1.843 | 1.500 | 0.583 | 0.520 | 0.500 | 0.526 | 1.061 | 1.225 | 1.250 | 1.250 |
| Tanh | 2.170 | 1.377 | 0.500 | 0.722 | 0.702 | 0.516 | 1.110 | 1.000 | 1.000 | 1.000 |
The EER comparison between different fusion methods on each multi-modals recognition system
The experiment results shown in the Table.12 is the EER derived from bio-modals fusion recognition systems based on the classify criteria TER which using different fusion methods and the fusion method proposed in this paper, from the results, we can find that the performance based on the proposed T method is the best and the reference [9] method take the second place. In the bio-modals fusion recognition systems which based on proposed T fusion method, there are 11 systems have the lowest EER that means have the best recognition performance, there are 3 systems have the second rank lowest EER. On the whole, the fusion recognition performance is better than the LR fusion method and reference [9] that we proposed before. In the experiment, the XF1-XS1 bio-modals fusion recognition system has the best recognition performance based on proposed T method while the value of EER only 0.232%, the XF5-XS2 bio-modals fusion recognition system has the worst recognition performance based on proposed T method while the value of EER is 2.247%, but still lower than the unimodal recognition system XF5 and XS2, and the value of EER of the bio-modals recognition system are lower than the uni-modal recognition system 4.253% and 4.253% respectively.
The experiment results shown in the Table.12 is the EER derived from multi-modals fusion recognition systems based on the classify criteria TER which using different fusion methods and the fusion method proposed in this paper, from the results, we can find that the performance based on the proposed T method still best. From the results, we can still find that there 6 times the value of EER are lowest, that means its have the best recognition performance, and 2 times the value of EER are second rank lowest that means the performance take the second place. On the whole, in the multi-modals fusion recognition systems, the performance based on proposed T method is better than the reference [9] method and LR fusion method. In this experiment, the {XS}-XF3 multi-modals fusion recognition system has the best recognition performance based on proposed T method while the value of EER only 0.393%, the {XF}-XS2 multi-modals fusion recognition system has the worst recognition performance based on proposed T method while the value of EER is 20.793%, but still lower than the unimodal recognition system.
We compare the results from the Table.12 and Table.13 comprehensively; we can still find that the fusion recognition performance based on proposed T method achieve the best result. Because the proposed fusion method not only utilize the criteria TER to depict the distribution of the matching scores of the recognition system, but also utilize the correlation of different features to fusing the criteria TER derived from different uni-modal recognition systems. The LR fusion method is based on density estimation that estimate the joint density distribution of the samples based on GMM modal, the performance of the LR method can get a ideal result when the scale of the training samples is very high, otherwise, the performance is very poor. The Tanh fusion method and Min-Max fusion method cannot depict the distribution of the matching scores properly, but they can reflect some laws of the matching scores in some respect, the best advantages of these two fusion methods is easy to realize and its can be make use for the foundation for other complex fusion methods.
6.5. The verification of recognition time and accuracy
We verify the recognition time and recognition accuracy of different fusion methods on the XM2VTS-Benchmark database, the experiment result are shown in the Table.14.
| methods | Time(S) | Recognition Rate | |
|---|---|---|---|
| Training Time | Recognition Time | ||
| T | 55.609 | 18.689 | 95.61% |
| Reference [9] | 38.625 | 16.235 | 93.14% |
| ELM | 49.252 | 17.227 | 91.78% |
| LR | 32.844 | 12.172 | 89.44% |
| Min-Max | 29.672 | 4.898 | 87.33% |
| Tanh | 22.032 | 8.278 | 80.67% |
The Recognition Time and Recognition Rate comparison different fusion method on each double modals recognition system
From the experiment results shown in Table.14, we can found that the average training time and average recognition time are 55.609S and 18.689S respectively, it’s the highest value in all the fusion methods, but its have the highest recognition accuracy that is 95.61%. compared to the reference [9] fusion method, the proposed fusion method is higher than 3.47%; compared to the Tanh fusion method, the proposed fusion method is higher than 14.94%. That means the recognition performance are improved but at the sacrifice of the training time and recognition time.
7. Conclusion
In this paper, a new fusion method based on based on TER and Multiple Hidden Layer Probabilistic Extreme Learning Machine (MHP-ELM) is proposed. A new fusion strategy based on hybrid intelligent multiple hidden layer probabilistic extreme learning machine(HMP-ELM) is introduced, which optimizes the architecture of hidden nodes by weighted calculation of different output matrices and then transforms the numeric output of ELM to the probabilistic outputs and unifies the outputs in a fixed range, in this strategy, the matrices weights μ of the Multiple Hidden Layer Extreme Learning Machine(M-ELM) and the output weights β belongs to the ELM are optimized using a hybrid intelligent algorithm based on Differential Evolution and Particle Swarm Optimization(DEPSO).
The main contributions of this paper can be summarized as follows: 1) Based on our previous works, this paper still using the total error rate (TER) instead of matching scores as the matching character in fusion process. 2) A novel fusion scheme based on Hybrid Intelligent Multiple Hidden Layer Probabilistic Extreme Learning Machine (HMP-ELM) is given in this paper. To our knowledge, this is the first time to utilize the ELM for information fusion. 3) In order to explore a optimal parameter belong to the Extreme Learning Machine, a new optimization strategy to the two weighted parameters based on Differential Evolution and Particle Swarm Optimization(DEPSO) is proposed.
Acknowledgements
The work was supported by the National Natural Science Foundation of China under Grant 61263031 and 61563030, by the by the National Natural Science Foundation of Hunan Province of China under Grant 14JJ2041and 16JJ6025, by the Key Project of Education Department of Hunan Province of China under Grant 15A044, 17A048.
References
Cite this article
TY  - JOUR
AU  - Di Wu
AU  - Qin Wan
PY  - 2018
DA  - 2018/05/02
TI  - Multimodal biometrics Fusion based on TER and Hybrid Intelligent Multiple Hidden Layer Probabilistic Extreme Learning Machine
JO  - International Journal of Computational Intelligence Systems
SP  - 936
EP  - 950
VL  - 11
IS  - 1
SN  - 1875-6883
UR  - https://doi.org/10.2991/ijcis.11.1.71
DO  - 10.2991/ijcis.11.1.71
ID  - Wu2018
ER  -