
Modelling the interrelation among software quality criteria using Computational Intelligence techniques
- DOI
- 10.2991/ijcis.11.1.88How to use a DOI?
- Keywords
- Software Quality; Computational Intelligence; Fuzzy Cognitive Map; Fuzzy Logic
- Abstract
Software products quality assessment is a highly complex process, given the variety of criteria to consider. For a better understanding, they are organized in so-called software quality models. An important aspect of these models is their structural complexity, forming a hierarchical structure. At present, they have evolved towards the overlap and interrelation between these criteria. Modeling a general structure to represent quality models, extending the hierarchical taxonomies to form more complicated structures like graphs and taking into account the interrelation between criteria is the objective of this work. The proposed solution incorporates elements of Computational Intelligence, such as fuzzy logic, fuzzy linguistic modeling and the use of fuzzy cognitive maps (FCM). The application of this proposal in a real-world case shows that it is an operative solution, reliable, precise and of easy interpretation for its application in the industry.
- Copyright
- © 2018, the Authors. Published by Atlantis Press.
- Open Access
- This is an open access article under the CC BY-NC license (http://creativecommons.org/licences/by-nc/4.0/).
1. Introduction
In recent years, the use of software has become a vital product in organizations, both for their most important processes and for those of support; among then the management of human resources, knowledge, decision-making and the exchange of information. Thanks to it, the possibilities of negotiation increase and they become more productive. This situation creates an environment of competition and software specialization between production and marketing organizations. Furthermore, associated to it, attention to the quality of software products acquires a special connotation, becoming one of the differentiating elements in the worldwide scope among the developing companies.
Cuba has designed as one of the fundamental strategies for its development the computerization of society, through the development of quality computer applications that allow technological independence. This implies a boom in its software industry, currently made up of 30 companies and a non-state sector with more than 1,400 programmers. That is how every day more computer solutions are embedded in the daily work of the institutions of the country.
The National Center for Software Quality (CALISOFT) is a Cuban entity created to offer services for evaluating the quality of computer products, software development processes and the provision of information technology services. It also has the task of establishing technical standards and procedures that normalize the national computer industry, directing it towards higher levels of quality.
The search for the quality of the systems has led to the creation of models and standards, which set the desirable attributes for the evaluation and selection of software products.
The quality criteria to be taken into account in the assessment of a software product are grouped in different ways for a better understanding and usability. This taxonomy is known as quality models. The most widely used are those known as integral hierarchical models, which decompose the quality into criteria organized in the form of a n-ary tree. Such a hierarchical decomposition is a strategy widely used in different scientific disciplines. The most significant software product quality models are: McCall, Boehm, FURPS, Dromey, ISO 9126 and ISO 25000.
The quality criteria are usually interdependent, because the result of the preference of one criterion over another is influenced by the others. With the increasing level of understanding of quality, which transcends a simple taxonomy, the models have evolved towards the overlap and interrelation between these criteria. There are interrelationships between McCall’s quality factors.1 Besides, there has been determined the interdependence between the six external and internal characteristics for ISO 9126.2,3 This causes a group of criteria to influence quality in a contradictory way. For example, greater efficiency implies lower usability; better reliability means better functionality.
In spite of this, the proposed solutions are purely hierarchical.4,5,6 Nevertheless, the quality assessment from independent criteria causes some prejudice in favor or against the product assessment. This causes that sometimes a correspondence between the estimated quality of a product and the one that it really demonstrates during its use is not reflected.
As a result of the above problem, it is determined as objective of this paper to define and apply a quality model assessing the interdependence between criteria as a way to achieve a realistic estimate of quality, and therefore a better problem definition of evaluation and selection of software products.
The application of the Computational Intelligence techniques is a recognized way to describe mathematically all these situations. Unfortunately, and as far as we know, until now no much research has been done into this problem using this point of view.
For this, the proposal incorporates Computational Intelligence techniques, such as fuzzy logic, fuzzy linguistic modeling and the use of fuzzy cognitive maps (FCM), to take advantage of the tolerance that implies imprecision and uncertainty, being able to consider elements as the manipulation of heterogeneous, ambiguous and imprecise information, and the analysis of the interdependence between criteria.
Consequently, this paper has the following structure: Section 2 presents the Quality Model proposed, in which the fuzzy cognitive maps, essential criteria and the order of the software tests are described. Section 3 describes a real-world case, and finally Section 4 is devoted to the conclusions.
2. Fuzzy Quality Model proposed
2.1. Quality model
The quality model proposed (QM) can be represented as a graph defined as:
- V
is the set of evaluation criteria.
- Ev
is the set of vertical links.
- Eh
is the set of horizontal links (influence)
- EC
is the set of essential criteria
QM (see Fig. 1) is formed by 4 levels: level 0, represents the quality index; level 1, the characteristics; level 2, the sub- characteristics; and level 3, the metrics obtained from the software testing process and from expert assessments. A criterion is only found on one level and the union of all corresponds with the whole to be valued.
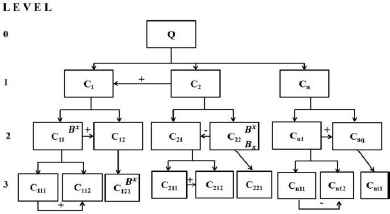
Quality model.
Each criterion has a weight (W) associated. At each level, there is a set of vectors of weight. The sum of the weights of the sibling criteria is equal to 1.
The vertical links (Ev), represent the relationship between criteria (vertex) of consecutive levels, i.e. the relationship between parent and children.
The criteria at all levels have a parent that is at the previous consecutive level, except level 0, which represents the quality index (see Eq. (4)).
Horizontal links (Eh) represent the interdependence between criteria. Each link is presented by a triplet (x, y, Ixy), which means the influence of the criterion x on the criterion y, with a weight (Ixy).
(Ixy) is a linguistic variable, which establishes several labels: high negative (hn), low negative (ln), without influence (winf), low positive (lp) and high positive (hp), defined in the interval [−1,1] (See Fig. 2).
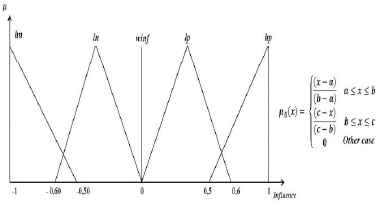
Linguistic Variable Influence.
The horizontal links are modeled through Fuzzy Cognitive Maps, which will be presented below.
2.2. Fuzzy Cognitive Maps
Fuzzy Cognitive Maps (FCM) is a technique developed by Kosko9, for quantitative modeling, based on the knowledge and experience of experts, and it is a fuzzy directed graph. The nodes represent concepts and weighted arcs the relationships between concepts. In the FCM, there are three possible types of relations between concepts: positive relation, negative relation or non-existence of relations. The degree of the relationship is described through a fuzzy number or linguistic value, defined in the interval [−1,1]. An FCM, consisting of n concepts, is represented in an nxn matrix, known as the adjacency matrix. This matrix is obtained from the values assigned to the arcs. They have been applied on diverse scientific areas, such as social and political sciences, engineering, information technology, robotics, expert systems, medicine, education, prediction, environment, and so on. 10,11.12,13
In this work, it is decided to treat the interdependence between criteria using Fuzzy Cognitive Maps, with the definition of the linguistic variable Influence (I).
To determine the interdependence between criteria of the same level, the FCM is formed from the information provided by the experts. The relationship between the sibling criteria is the first analyzed and a FCM is formed for each group of siblings. Nodes are sibling criteria and edges represent the influence of one criterion on another. The resulting FCM is reviewed by each expert and to each edge is associated a value of the variable I. The FCM obtained by each expert should be added later, using a technique that allows for consensus. It is advisable to use a consensus-building algorithm as proposed in Ref. 14.
The consensus fuzzy cognitive map (FCMc) is obtained for each group of siblings. From each FCMc, the adjacency matrix (AMc) is found, the different of each level are combined and the matrix of interdependence between criteria is determined.
The unification of the different is simple because there are no common criteria between the different maps. The combination is performed according to Eq. (6).
This matrix is called the criteria interdependence matrix (MI).
2.3. Essential criteria
In the model, there is a subset of criteria classified as essential (EC), determined from the quality requirements and the purpose of the assessment.
Where,
- •
x is essential criterion.
- •
Bx: lower threshold value of criterion x.
- •
Bx: upper threshold value of criterion x.
A restriction is associated to each essential criterion, and in turn, an interval (Bx, Bx) is linked to it.
With this formal and generic definition of the quality model, a better structuring of the problem of assessment and selection of software products is achieved.
2.4. Order of software tests.
From the level 1 criteria to be assessed, the types of tests to be performed are established. The interdependence between criteria of this level, defined through the FCM and their weight, serves as the basis for organizing and ordering software testing in the assessment process. Following, an algorithm is proposed for this purpose (See algorithm 1).
| Input: |
| Matrix of interdependence of level 1 (MI1), |
| Weight vector of level 1 (W1), |
| Output: |
| Order of tests to be performed on software products |
| BEGINNING |
| 1. Find the absolute value of each element of MI1 |
| 2. Calculate Total Effect Matrix |
| 3. Calculate the centrality of each Ci |
| 4. Calculate the ranking by the centrality |
| 5. Calculate the ranking by weight. |
| 6. Find the median of the rankings. |
| 7. Sort by the median. |
| 8. Return the order |
| END |
Pseudocode of the algorithm to recommend the order of the software tests.
The weight of the criteria can be established from the use of different methods, either by direct determination of the experts or by the comparison by pairs, thus, obtaining the eigenvector and considering that the sum of the weights of the siblings’ criteria must equal 1.
For the calculation of the absolute value of each element, Eq. (9) is used.
Subsequently, the total effect matrix is found, according to Eq. (10).
Where MI is the matrix of interdependence of level 1 and n is the number of criteria at that level.
The centrality of each characteristic is determined by Eq. (11):
A defuzzication method is applied, according to Eq. (12):
The ranking is calculated, according to the defuzzified value of CEN (Ci).
2.5. Assessment and selection of software products.
In a decision-making problem of software products assessment and selection it is necessary to obtain the quality index for each product. This measurement permits its qualitative assessment.
If the objective of the evaluation is to recommend a product or set of products, then the first thing to do is to classify the quality index, from the highest to the lowest, and then recommend those defined as high quality products. However, if the objective is to make an ordering of the products, then a ranking is recommended according to the quality index. Furthermore, if the assessment quality of a given product were to be obtained, this will show with its overall quality index and a qualitative assessment.
In order to obtain such index, first the different types of software tests should be executed, evaluating each alternative, taking into account the judgment of the experts. With the data collected, the value of each metric is calculated.
After this, the values of the different metrics are normalized and then unified by transforming them into a single data domain -- in this case, the diffuse triangular numbers. This operation is valid, only for problems where the information is heterogeneous. The evaluation matrix is conformed with the values of the normalized and unified measures for each alternative. After this the aggregation of the information is done in order to obtain the quality index of each alternative.
For such aggregation process, it is vital to take into account the interdependence among criteria; that is why, it is recommendable to follow the steps given below:
- (i)
Add to the value of each criterion the influence of the others. To do this, aggregate the influence among criteria expressed in the interdependence matrix, with the evaluation matrix, and you will obtain Matrix G.
where:f(x) is a threshold function
- (ii)
The weighted matrix (Gp) is calculated using (14).
where:G, Matrix obtained in the previous step
W, vector of weight defined.
- (iii)
Add the measures to obtain the values of the subcharacteristics through the weighed sum. A new evaluation matrix will be obtained with the value of the subcharacteristics for each alternative.
These steps are executed iteratively to get the values of the different characteristics as well as the quality index for each alternative.
3. Case of study
The previous algorithm and proposed model was applied in a controlled environment in CALISOFT, a Cuban software quality certification company, with the objective of planning the software tests for the quality assessment of three products. Taking into account the quality requirements, the characteristics and sub-characteristics to be assessed are determined. In this case, the level 1 criteria (characteristics) to be assessed are: Functional Adequacy (AF), Reliability (R), Efficiency (E), Usability (U) and Portability (P), according to ISO 25010. The weight vector for the quality characteristics (level 1) is determined through peer comparison (See Table 1). A study on the sensitivity of the resulting rankings in terms of slight modifications of the weights is outside the objectives of the article.
| Quality characteristics | Weight |
|---|---|
| Functional Adequacy (FA) | 0.324 |
| Efficiency (E) | 0.075 |
| Reliability (R) | 0.324 |
| Portability (P) | 0.072 |
| Usability (U) | 0.206 |
Weight vector for the characteristics of level 1 used in Cuba.
Subsequently, the relationship between criteria of level 1 is defined, with the use of FCM (see Fig. 3). To establish the interdependence between criteria of the same level, the FCMc is formed for the group of siblings. From the FCMc, the adjacency matrix (AMc), of the level is derived and obtains the matrix of interdependence between criteria (MI1).
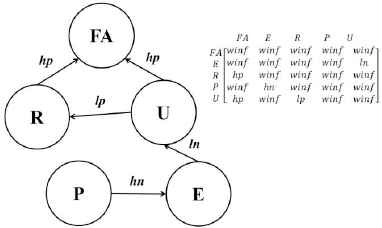
Fuzzy Cognitive Map of level 1 and the adjacency matrix
The proposed algorithm is applied and in Table 2, it shows the value of the Influence, Dependency and Centrality of each characteristic. Table 3 shows the rankings for different aspects.
| Influence | Dependency | Centrality | Defuzzification | |
|---|---|---|---|---|
| FA | (0,0,0) | (1,3.08,4.52) | (1,3.08,4.52) | 2.9733333 |
| E | (0,0.78,1.92) | (0.5,1,1) | (0.5,1.78,2.92) | 1.7566667 |
| R | (0.5,1,1) | (0,0.48, 1.32) | (0.5,1.48,2.32) | 1.4566667 |
| P | (0.5,1.78,2.92) | (0,0,0) | (0.5,1.78,2.92) | 1.7566667 |
| U | (0.5,1.6,2.2) | (0,0.6,1.2) | (0.5,2.2,3.4) | 2.1166667 |
Values of Influence, Dependency and Centrality of each characteristic.
| Ranking by Centrality | Ranking by weight | Median of the rankings | |
|---|---|---|---|
| FA | 1 | 1 | 1 |
| E | 3 | 3 | 3 |
| R | 4 | 1 | 2.5 |
| P | 3 | 4 | 3.5 |
| U | 2 | 2 | 2 |
Rankings of each characteristic by its centrality, weight and the median of the rankings.
The proposed order to perform the tests is: the tests of functionality (AF) in the first place, followed by tests of usability (U), reliability (R), Efficiency (E) and finally Portability (P). This order of software testing expedited the assessment process. From the beginning, they detected the Non Conformities (NC) of greater affectation to the general quality index. The result of the assessment is in correspondence with the behavior of the products in the deployment.
An experimental assessment was developed for three software products (S1, S2, S3). Table 4 shows the data of the quality model used, the characteristics, subcharacteristics and metrics selected, the data domain (DD) in which they are defined and whether it is cost (C) or benefit (B). As can be seen, metrics are defined in different data domains, with different scales, corresponding to objective and subjective factors. It is remarkable that measures such as ease of installation, satisfaction and appearance, take values from the perception of experts, who have different criteria and knowledge, which introduces a high degree of uncertainty.
| Characteristics | Subcharacteristics | Metric | DD | C/B |
|---|---|---|---|---|
| Functional Adequacy (FA) | Functional completeness (CpF) | Functional implementation coverage (CAF) | [0,1] | B |
| Functional correctness (CcF) | Computational correctness (CC) | [0,1] | B | |
| Efficiency (E) | Time behavior (Ct) | Task per time (TpT) | [0,40] | B |
| Resource utilization (UR) | Memory utilization (MEM) | [0,10] | C | |
| Reliability (R) | Maturity (M) | Mean time between failures (MTBF) | [0,100] | B |
| Failure density against test cases (DF) | [0,1] | C | ||
| Test coverage (CP) | [0,1] | B | ||
| Portability (P) | Installability (CapI) | Ease of installation (Fins) | (MB, B, M, A, MA) | B |
| Adaptability (A) | Hardware environmental adaptability (Ahw) | [0,1] | B | |
| System software environmental adaptability (Asw) | [0,1] | B | ||
| Usability (U) | Appropriateness recognisability (Comp) | Exhaustive Description (DE) | [0,1] | B |
| Learnability (Apr) | Completeness of documentation (IntDoc) | [0,1] | B | |
| Operability (Op) | Satisfaction (Sat) | (MB, B,M, A,MA) | B | |
| User interface aesthetics (Est) | Appearance (Apa) | (NA, PA, A, MA, AA) | B | |
Quality software criteria.
Software tests were performed, the resulting data collected and metrics were obtained. The value of each measure for each software is shown in Table 5. After normalizing and unifying the data, the evaluation matrix (Me) was achieved, as it is shown in Table 6.
| Quality metrics | S1 | S2 | S3 |
|---|---|---|---|
| Functional implementation coverage (CAF) | 1 | 0.4 | 0.2 |
| Computational correctness (CC) | 0.2 | 0.3 | 0.1 |
| Task per time (TpT) | 20 | 10 | 2 |
| Memory utilization (MEM) | 0.1 | 0.6 | 0.1 |
| Mean time between failures (MTBF) | 90 | 20 | 15 |
| Failure density against test cases (DF) | 0.6 | 0.2 | 0.4 |
| Test coverage (CP) | 0.4 | 0.7 | 0.8 |
| Ease of installation (Fins) | B | M | MB |
| Hardware environmental adaptability (Ahw) | 0.8 | 0.8 | 0.3 |
| System software environmental adaptability (Asw) | 0.9 | 0.8 | 0.4 |
| Exhaustive Description (DE) | 0.9 | 0.8 | 0.5 |
| Completeness of documentation (IntDoc) | 0.7 | 0.7 | 0.6 |
| Satisfaction (Sat) | A | M | B |
| Appearance (Apa) | MA | AA | A |
The value of each measure for each software product.
| Metrics | S1 | S2 | S3 |
|---|---|---|---|
| CAF | MA | M | B |
| CC | B | B | MB |
| TpT | M | B | MB |
| MEM | MA | MA | MA |
| MTBF | MA | B | B |
| DF | M | A | M |
| CP | M | A | A |
| Fins | B | M | MB |
| Ahw | A | A | B |
| Asw | MA | A | M |
| DE | MA | A | M |
| IntDoc | A | A | M |
| Sat | A | M | B |
| Apa | MA | AA | A |
The value of normalized and unified quality metrics.
The value of each quality characteristic is shown in Table 7.
| S1 | S2 | S3 | |||||||
|---|---|---|---|---|---|---|---|---|---|
| FA | 0.623 | 0.631 | 0.631 | 0.675 | 0.734 | 0.752 | 0.500 | 0.500 | 0.500 |
| E | 0.620 | 0.645 | 0.667 | 0.613 | 0.637 | 0.659 | 0.554 | 0.558 | 0.558 |
| F | 0.500 | 0.500 | 0.500 | 0.640 | 0.653 | 0.665 | 0.634 | 0.648 | 0.661 |
| P | 0.649 | 0.661 | 0.669 | 0.647 | 0.660 | 0.672 | 0.628 | 0.639 | 0.652 |
| U | 0.695 | 0.754 | 0.771 | 0.692 | 0.753 | 0.767 | 0.623 | 0.685 | 0.699 |
The value of quality characteristic.
Another iteration of previous steps was performed to achieve the Quality Index (QI). The result obtained, is shown in Table 8. The recommendation as the best quality product is S2, then S3, and finally S1
| QI | QI defuzificado | Ranking | |
|---|---|---|---|
| S1 | (0.516,0.586,0.621) | 0.580513299 | 3 |
| S2 | (0.522,0.594,0.630) | 0.588252946 | 1 |
| S3 | (0.521,0.591,0.623) | 0.584475493 | 2 |
Quality index for each software product.
The quality index obtained by the method suggested is compared with and without interdependence. In addition, the result is compared with a modified fuzzy TOPSIS, which does not include interdependence. The quality index according to each method is shown in table 9.
| QI | With interdependence | Without interdependence | Fuzzy TOPSIS |
|---|---|---|---|
| S1 | 0.5805 | 0.4712 | 0.7336 |
| S2 | 0.5883 | 0.5310 | 0.5091 |
| S3 | 0.5845 | 0.2544 | 0.3304 |
Quality index (QI) obtained by different methods
Furthermore, the correlation between the methods is illustrated in Table 10, using a scale of three colors, whereby green shows similar values while red shows different values.
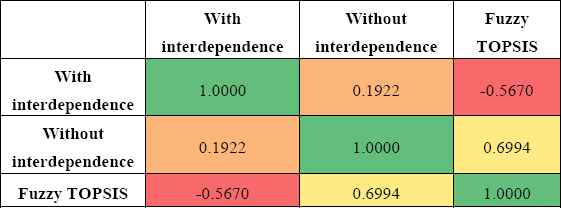
Correlation among the methods by the quality index.
Fuzzy TOPSIS does not allow interdependence, and it is considered as the most distant value method, since its conception is different in the sense that it deals with distance values towards a positive ideal and a negative one.
The experiment corroborates that the incorporation of the interdependence among criteria introduces changes in the solution of the problem; this is a key element to take into account in the selection and evaluation of software products.
4. Conclusions
Through the analysis of the models of quality of greater use in the industry and the determination of their similarities, it was possible to obtain a solution to the problem of modeling a generic and operative structure, through a graph. The proposal values the interdependence between criteria and the essential criteria. It also integrates the manipulation of ambiguous, imprecise information from different sources. It is based on elements of Computational Intelligence, such as fuzzy logic, fuzzy linguistic modeling and the use of fuzzy cognitive maps (FCM). It was inspired by real practical experiences developed by CALISOFT company.
It was demonstrated that the fuzzy cognitive map is a useful tool to identify and aggregate the interdependence between the criteria according to the opinion of the experts. Consequently, operating with FCM facilitates to make the order of the software tests.
The model facilitates and reduces the time for decision making, by creating a logical, rational and transparent basis for analysis. It also achieves a better structuring of the problem and therefore, greater participation and influence of all. Besides, it increases the depth of analysis, which leads to an increase in the quality of the decision.
The application of the proposal in a real-world environment shows that it is an operative, reliable and precise solution, which is easily interpreted for its application in industry.
Acknowledgements
This work has been partially funded by the Spanish Ministry of Economy and Competitiveness with the support of the project TIN2014-55024-P, and by the Regional Government of Andalusia—Spain with the support of the project P11-TIC-8001 (both including funds from the European Regional Development Fund). Last but not the least; also we would like to thank to EurekaSD, Erasmus Mundus Project for their support.
References
Cite this article
TY  - JOUR
AU  - Yamilis Fernández Pérez
AU  - Carlos Cruz Corona*
AU  - José Luis Verdegay
PY  - 2018
DA  - 2018/06/04
TI  - Modelling the interrelation among software quality criteria using Computational Intelligence techniques
JO  - International Journal of Computational Intelligence Systems
SP  - 1170
EP  - 1178
VL  - 11
IS  - 1
SN  - 1875-6883
UR  - https://doi.org/10.2991/ijcis.11.1.88
DO  - 10.2991/ijcis.11.1.88
ID  - Pérez2018
ER  -