
Do You Like Sclera? Sclera-region Detection and Colorization for Anime Character Line Drawings
- DOI
- 10.2991/ijndc.k.190711.001How to use a DOI?
- Keywords
- Line drawing; colorization; sclera region; segmentation
- Abstract
Colorizing line drawings requires special skill, experience, and knowledge. Artists also spend a great deal of time and effort creating art. Given this background, research on automated line drawing colorization was recently conducted. However, the existing approaches present multiple problems, one of which is the inconsistency of the whites of the eyes (sclera) between line drawings and the results of colorizing. In particular, in line drawings, a person’s skin and sclera are often expressed in white. Hence, there are cases in which existing colorization methods cannot predict the boundary correctly. In this study, we propose automated colorization methods that use machine learning to segment sclera regions in grayscale line drawings. To improve the accuracy of previous automated colorization approaches, we implemented sclera-region detection and an automated colorizing approach on grayscale line drawings of people. In addition, we evaluated the colorization results created by our methods through a user study. Statistics show that our methods are somewhat superior to industrial application, but many of our respondents perceived little difference between the methods.
- Copyright
- © 2019 The Authors. Published by Atlantis Press SARL.
- Open Access
- This is an open access article distributed under the CC BY-NC 4.0 license (http://creativecommons.org/licenses/by-nc/4.0/).
1. INTRODUCTION
Line drawing colorization is an important process in creating artwork such as animation, illustrations and color manga. Many artists color work manually, a process that requires considerable time and effort. In addition, colorizing requires special skills, experience, and knowledge, and this makes such work difficult for beginners. As a result, automated line drawing colorizing methods have significant market demand. However, it is difficult to paint artistic works. Many automated colorizing methods have been developed, but several problems arise in art colorized using these methods. For example, colors may be different in a region that should be painted the same color as another region, or a mismatch may occur between the input line drawing and the colorizing result due to difficulty in understanding the sketches, the inclusion of undesirable artifacts, and other issues. Anime character’s eyes are drawn in various styles, depending on the artists’ preferences. In some styles, eyes are overly abstract. In addition, in grayscale line drawings, the skin and sclera are both expressed in white in many cases. Therefore, the boundaries cannot always be determined using existing automated colorizing techniques. As a result, sclera are often painted the same color as the skin, and there is a mismatch between these regions in the line drawing and the colorizing results. Facial features are important in artworks that depict people, and excessive ambiguity at the boundary between the eyes and the skin may impair quality. Therefore, it is expected that sclera-region detection should improve the accuracy of automated colorizing of grayscale line drawings of people.
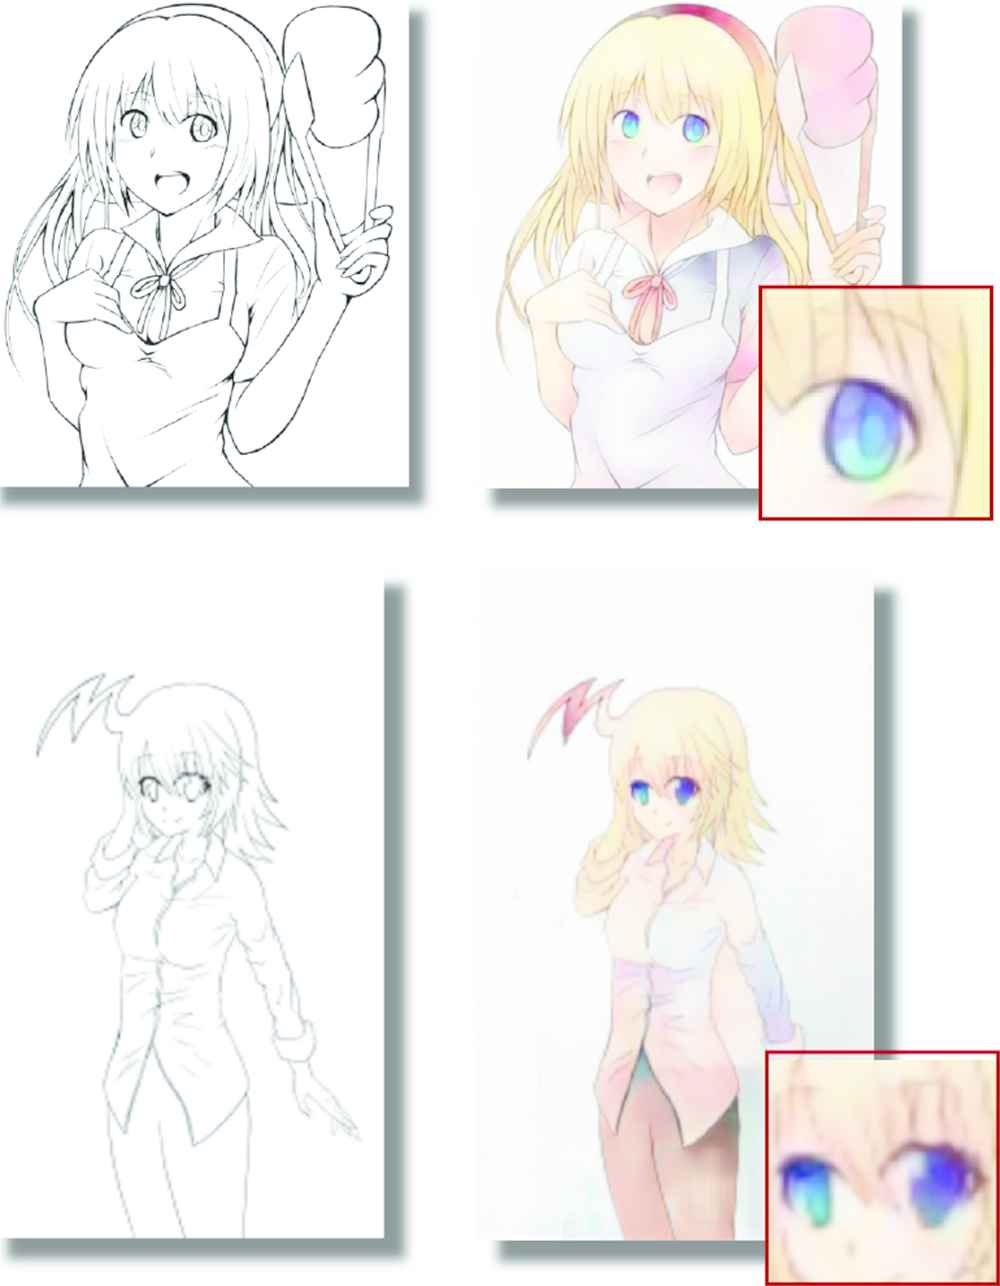
This paper focuses on inconsistencies in the sclera region between line drawings and colorizing results; we aim to match the structure of line drawings and colorizing results by detecting the sclera regions in grayscale line drawings of people to improve the accuracy of automated colorizing (Figure 1). In our proposed framework, we perform machine learning using a pair of line drawings and a mask image. The sclera regions are labeled to create semantic segmentation models of the sclera regions. Then, to colorize the line drawing, the semantic segmentation models detect the sclera regions, and we apply these regions to the automated colorizing result. As a result, our framework maintains the correct sclera-region color. When using the semantic segmentation model, it is possible to detect sclera regions without requiring the user to add hints. In this paper, we propose two mask image creation methods: the manual type and the graph cut type. Compared with the manual type, the graph cut type can reduce the mask image creator’s burden.

Our framework detects and colorizes sclera regions.
To evaluate segmentation, we determined the accuracy of the regions inferred using the intersection-over-union (IoU) score. In addition, based on a user study of the previous automated colorizing method and our two proposed methods, our models demonstrate the proposed method’s effectiveness, but the result also indicate that there is not much difference between the methods.
2. RELATED WORKS
2.1. Line Drawing Colorization
Many studies have been conducted on automated line drawing colorization. Scribbler [1] generated various realistic scenes from sketches and color hints for a bedroom, a human face and so on. Frans [2] introduced the method of generating and synthesizing two predictions: colorizing based on a line drawing and shading based on a line drawing and a color scheme. Auto-painter [3] proposed a new learning model that adjusts adversarial loss for artistic color collocations. Shading style transfer approach [4] colorized line drawings and transferred the shading styles of reference color images using a training network that considered class label information. PaintsChainer [5] is an online service that automatically colorizes line drawings in three styles, and users can obtain more desirable results by providing color hints. Ci et al. [6] achieved high-quality colorizing using a network that extracts semantic feature maps from line art and the network that learn the difference between generated and target images as perceptual loss using Wasserstein distance.
Some researchers have also investigated manga colorization. Furusawa et al. [7] made the first attempt to color entire frames of a manga page semiautomatically. Hensman and Aizawa [8] proposed an off-line learning method for manga colorization using a reference image that has been painted.
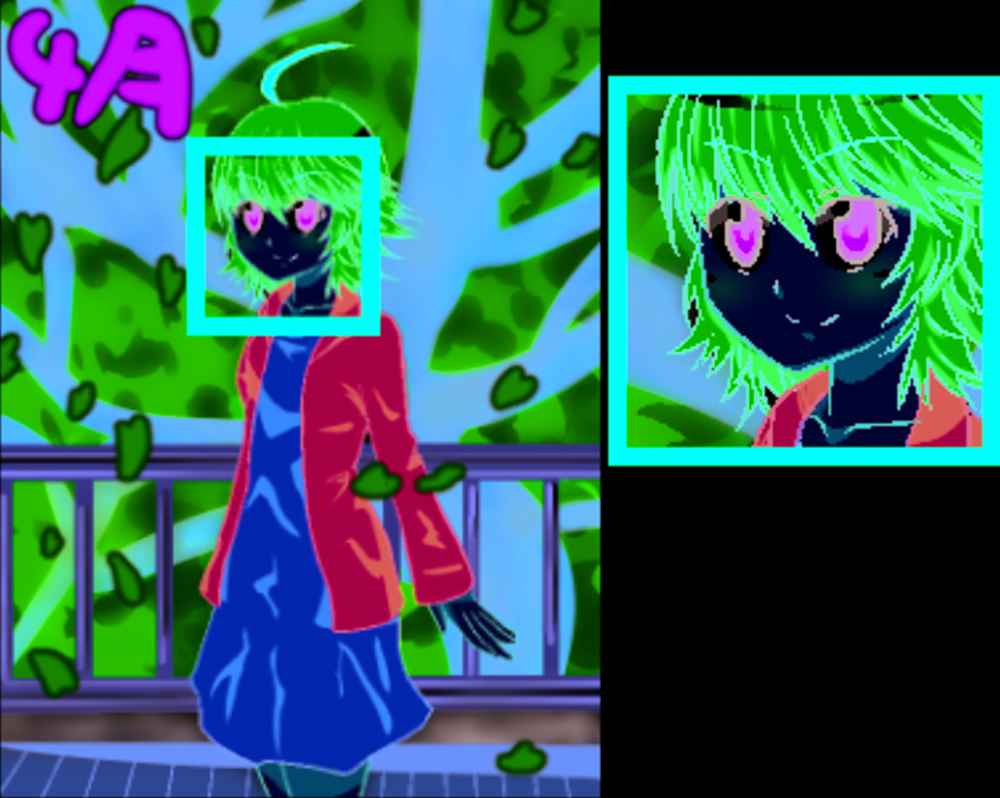
These approaches did not involve semantic coloring of regions that are nonstylized in drawings, such as sclera. (Figure 2).
Examples of colorization results in which the sclera regions break off. The skin and pupil color mix with sclera regions. The left images are line drawings, and the right images are colorization results made with PaintsChainer [1].
2.2. Region-based Colorizing
Color propagation-based techniques are often used for line drawing colorization. Qu et al. [9] proposed a manga colorizing method based on segmentation to extract similar pattern regions from grayscale textures. LazyBrush [10] proposed a flood filling method to perform smart segmentation based on edge extraction. Hensman and Aizawa [8] combined learning and segmentation-based approaches. These methods propagated colors based on textures and line drawing edges, so they did not understand overly simplistic structural lines.
The study of two stage training [11] prevented color bleeding and blurring. This framework was trained separately during a rough colorizing phase and an elaborate colorizing phase. This approach in particular improves the color bleeding of the entire colorized target image. Our method differs from the above approach in that the target is narrowed to the sclera regions, and semantic segmentation is used to understand the line drawing, including areas of excessive abstraction.
2.3. Sketch Processing
There are several studies on sketch processing. The research of converting rough sketches [12] generated simplified line drawings from complex rough sketches by extending the supervised data set. The approach [13] converted rough sketches into line drawings using three data sets: supervised pairs of rough sketches and line drawings, and unsupervised rough sketches, unsupervised line drawings. This approach used teacher loss and discriminator networks for supervised data but used only discriminator networks for unsupervised rough sketches. The interaction tool for converting rough sketches into line drawing [14] also developed. Li et al. [15] proposed a method to extract structural lines from manga by removing various tone textures. These studies do not address colorizing.
2.4. Photo Colorization
Optimization- and learning-based approaches successfully colorize grayscale photographs. Levin et al. [16] proposed the optimization-based method. In this framework, when the user draws a color stroke on the grayscale image, similar colors propagate to adjacent pixels with similar brightness.
There are also learning-based methods. Iizuka et al. [17] introduced a learning model that connects local and global features in separate paths. Larrson et al. [18] acquired local position information and semantic information as hypercolumns and used this to predict VGG color. The study using a VGG style network with a classification loss function [19] reproduced realistic colorization automatically. The approach using end-to-end training that taught sparse color hint propagation [20] directly predicted the mapping of grayscale images and color hints to color images.
These approaches rely heavily on grayscale texture information from the input image. We aim to detect regions that do not have texture information and use these for colorization.
3. OVERVIEW
In this study, we aim to clarify the sclera regions in grayscale line drawings of people by detecting them using semantic segmentation, and we propose a method to improve the accuracy of previous automated colorizing approaches. Figure 3 shows our model’s structure. In the manual type, an experienced illustrator manually labels the sclera regions at the pixel level to generate a mask image. In the graph cut type, the sclera regions are labeled using the graph cut technique, and a mask image is generated. Our model consists of a training and a colorizing phase. In the training phase, color illustrations are collected from the Web, and processed into line drawings. Thereafter, face detection is performed. Based on face detection data, an experienced artist makes pairs of line drawings and mask images of the sclera regions. Given these pairs, the training phase is used to detect the line drawing’s sclera regions. In the colorizing phase, the user performs existing automated colorizing processing on the input line drawing and combines the results of the sclera-region detection, thereby directing the program to color the image while accounting for those regions.

Our approach’s framework.
4. FRAMEWORK
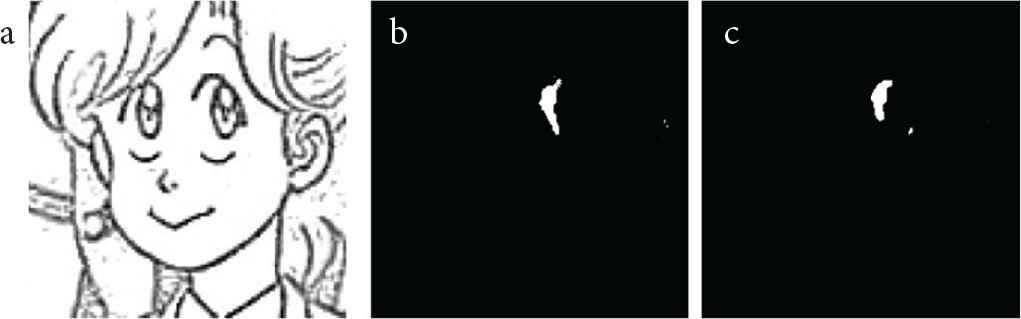
In this section, we describe the methods used in this study’s training phase and colorizing phase functions. For data set creation, we extracted structure lines from and detected faces on painted images collected from the Web. We labeled the sclera regions on the obtained line drawings and generated mask images based on the original painted images. Figure 4 shows examples of the data sets.

Examples of the data sets. (a) Line drawing. (b) Manual type mask image. (c) Graph cut type mask image.
In this study, the data set consisted of the line drawing of the face and the mask image that labeled the sclera regions. We created two data sets: the manual type and the graph cut type. For each type created, we used the same 96 painted images collected from the Web. To expand the data set, we rotated the images in 10° increments from −40° to 40°, and also reversed them horizontally. In this way, we acquired 1206 pairs of line drawings and mask images. We then resized the images to 240 × 240 pixels and used them for training.
4.1. Face Detection
We performed face detection to predict the sclera regions. In this study, we used “lbpcascade animeface” [21], a trained classifier capable of anime character face detection. Figure 5 shows an example of face detection.
An example of face detection. The red line indicates the detection result bounding box.
4.2. Outline Extraction
We performed outline extraction to extract line drawings from the painted images to create the data sets. In this study, we used “LineDistiller” [22], a character structure outline extraction model for line drawings of painted images. We used a published learned model, “Model 180121”. Figure 6 shows an example of outline extraction.
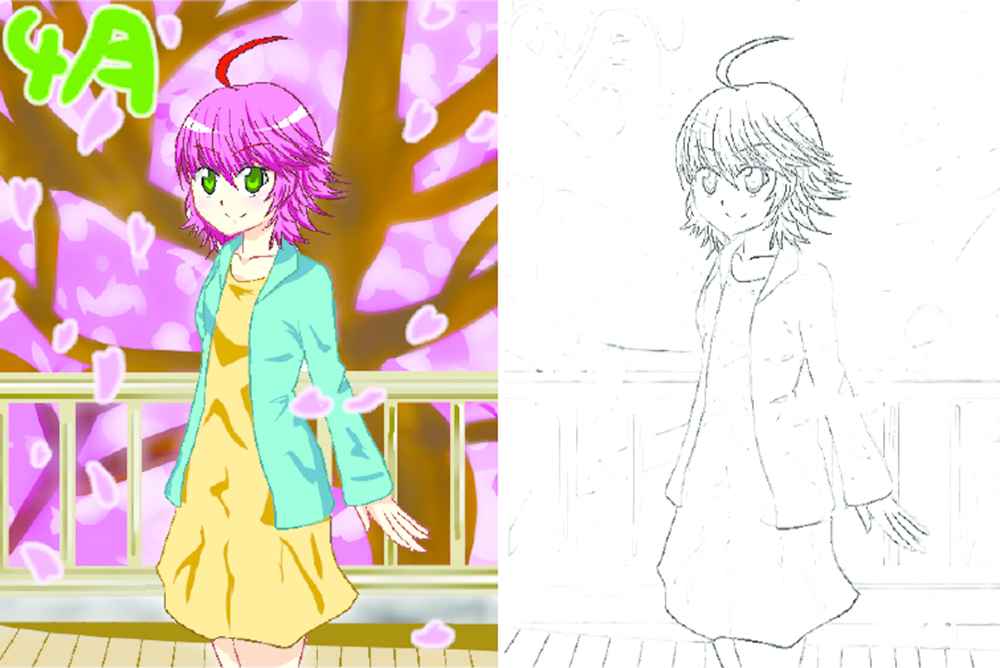
An example of outline extraction.
4.3. Data Set Creation
During mask image generation, the sclera regions of a line drawing extracted from a painted image are labeled to generate a mask image.
In the manual type, an experienced illustrator produces a mask image in which the sclera regions of the line drawing are white and the other areas are black. The illustrator overlaid the painted image and the line drawing and performed sclera-region labeling at the pixel level while referring to the painted image.
The graph cut type used an interactive graph cut [23] and GrabCut [24] techniques. A GrabCut is a foreground/background segmentation technology based on interactive graph cuts. An interactive graph cut uses a rough foreground/background label specified by the user (Figure 7). A GrabCut models foreground/background color distributions based on the assumption that the interior of a given rectangle is a mixture of foreground and background, and the outside of the rectangle is background. For each pixel, these techniques measure how often the corresponding pixel value appears in the foreground/background histogram. By comparing how much this value differs from the values of neighboring pixels, the model determines which pixels belong to the foreground and to the background. In our method, the foreground is the sclera region, and the background is any other area. Color distributions were replaced with a Gaussian mixture model by RGB channels. Foreground and background color distributions are learned iteratively from the foreground separated results: in this study, it was performed five times. First, an interactive graph cut using two seed images was performed to detect the approximate location of the sclera regions while including other areas with similar coloration. Two seed images were created in advance: a foreground seed image that shows the approximate location of the sclera regions and a background seed image that labels other approximate areas. Next, we set a rectangle containing the sclera regions, performed a GrabCut, and detected the sclera regions. We used OpenCV’s GrabCut function algorithm to create the graph cut type data set.
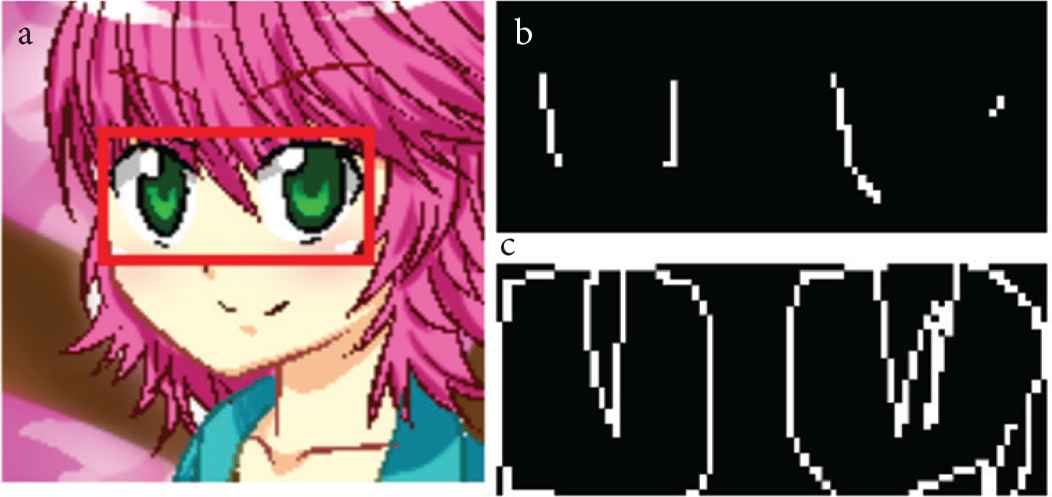
Examples of graph cut seeds. (a) Rectangle. (b) Foreground seed. (c) Background seed.
For pixel-level labeling in the manual type and seed image creation in the graph cut type, we used Clip Studio Paint EX (CELSYS, Inc., Tokyo, Japan), a professional illustration software package optimized for pen tablets. First, we opened the color images of detected faces in Clip Studio Paint EX. Then we created new layers on top of the faces to label each image. We used an Intuos comic medium CTH-680/S3 pen tablet (Wacom Co., Ltd., Saitama, Japan).
The mask image generated using the manual type did not include the highlight that overlaps the pupil, but the mask image generated by the graph cut type tended to have a color close to that of the sclera region. Therefore, the overlapped highlights were sometimes included in the sclera regions. In addition, although the manual type carefully labeled regions at the pixel level, the graph cut type set approximate seed positions and rectangular co-ordinates. Therefore, the graph cut type model reduced the burden on the mask image creator. The mask image obtained in this way and the face cropped from the line drawing were paired and used for training (Figure 8).
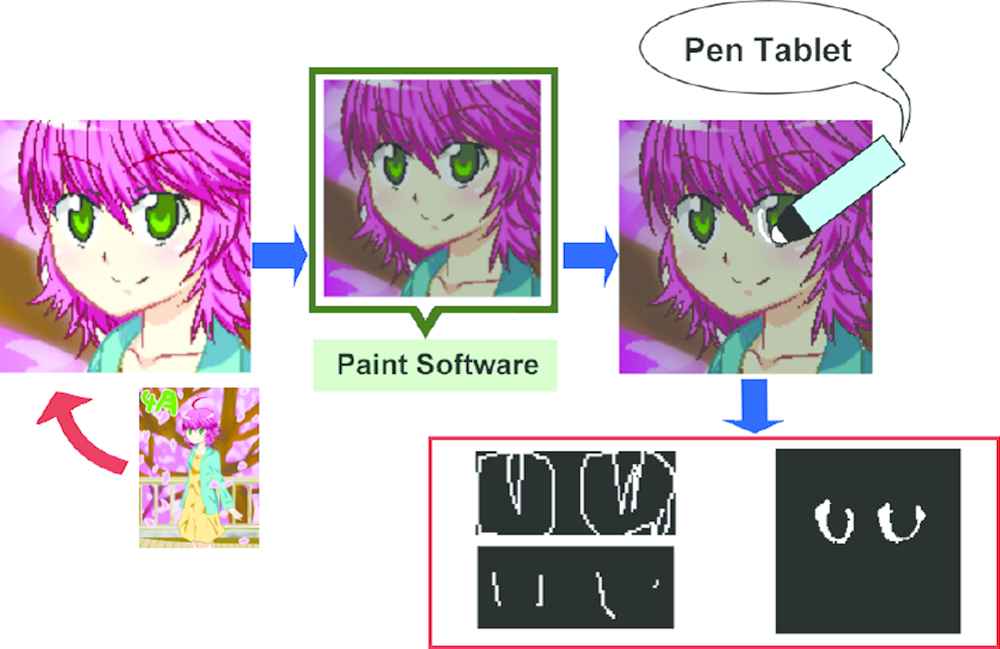
Data set creation. Labeling is performed using paint software on the face-detected color image.
4.4. Segmentation Model Training
In this study, the sclera regions were detected using pixel-level classification also known as semantic image segmentation. With a trained semantic segmentation model, the user can detect sclera regions without adding hints of the structure line. For semantic segmentation, we used the U-net network [25], a segmentation encoder–decoder model (Figure 9). In this network, high-resolution information about the input image and accurate localization are preserved by providing a skip connection in the corresponding layer between the encoding and the decoding part. In this study, we used the Adam optimizer. We used the default hyperparameter of Keras for the Adam optimizer. We also set up the dropout in the second and third decoder layers. The dropout probability was set to 0.5. The loss function L was defined using the following Equation (1):
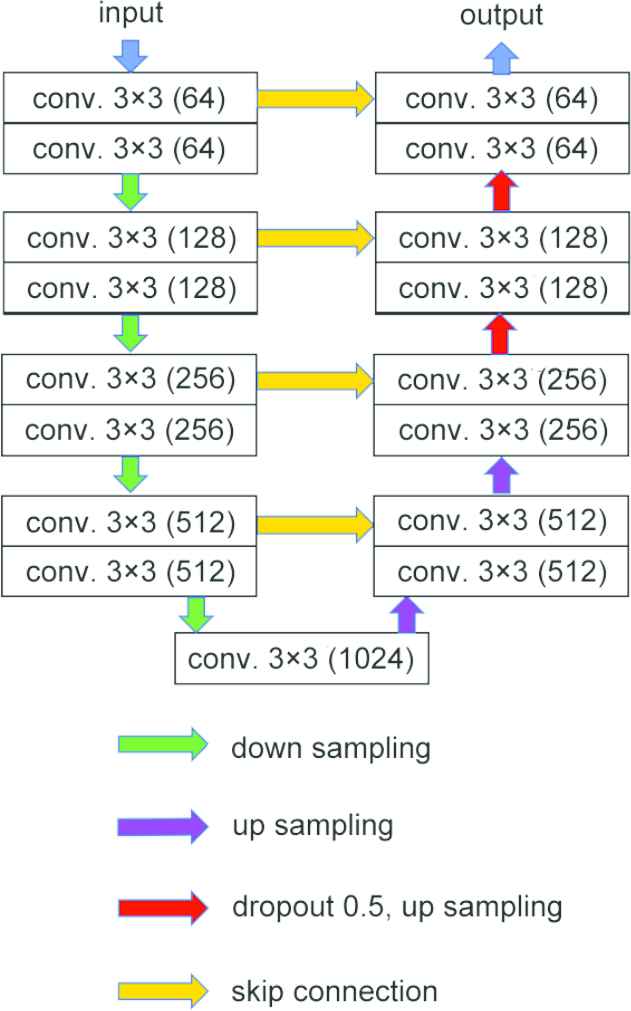
The training network’s architecture.
4.5. Automated Colorization
For automated colorization, we used PaintsChainer [1], an automatic line drawing colorizing service. When PaintsChainer inputs a line drawing, automated colorizing is performed using three colorizing styles. In addition, colorizing results can be controlled to some extent via user-provided color hints.
4.6. Sclera-region Prediction and Colorization
In automated sclera-region colorization, the sclera-region mask image is obtained by the segmentation (Figure 10). As a result, we obtained colorizing results that retained the structure of the sclera regions. However, after we combined the images, the boundary between the sclera regions and the other regions become excessively conspicuous. Therefore, we performed blurring processing with a Gaussian filter using the following steps. First, we blurred the mask and the composed image. Next, in the blurred mask image, we created a channel with higher transparency in pixels with lower brightness values. Finally, we applied the transparency to the composed image, which was overlaid on the automated colorizing result. Thus, we avoided emphasizing the boundary between the sclera regions and other regions. We used the Gaussian Blur filter of Pillow’s ImageFilter module to blur the image. The radius was set to 2.
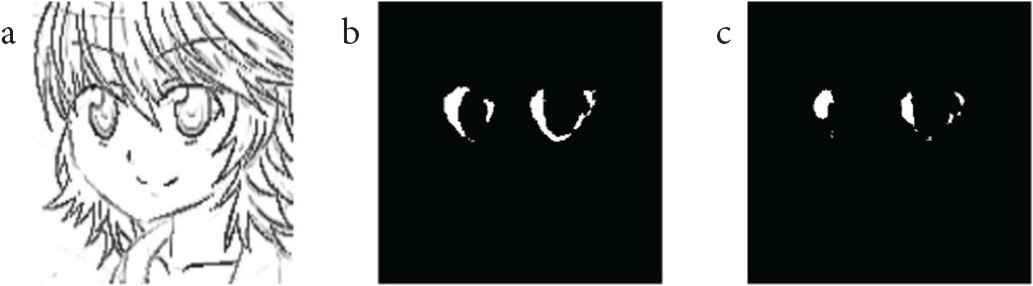
Examples of segmentation results. (a) Line drawing. (b) Manual type segmentation. (c) Graph cut type segmentation.
5. EVALUATION
We evaluated the segmentation model and the automated colorizing results generated by our approach.
5.1. Sclera-region Detection
First, to evaluate our method’s performance, we prepared a test set. We extracted line drawings from 96 additional images of animation characters collected from the Web. We also created line drawings and mask image pairs of the sclera regions using the manual type framework. We detected the sclera regions in the 96 new line drawings using two trained segmentation models: the manual type and the graph cut type. We defined the correct sclera regions as the areas labeled using the manual type framework, that is, the mask image produces by an experienced illustrator. We used the IoU score, a performance measure for segmentation problems, to evaluate segmentation. Given a pair of images, the IoU score indicates the similarity between the ground truth image and the predicted image. The IoU score is defined using the following Equation (2):
| Manual type | Graph cut type | |
|---|---|---|
| Mean IoU | 0.5390 | 0.4088 |
Training results for the manual type and the graph cut type
5.2. User Study
We conducted a user study to evaluate our framework’s effectiveness. Before the user survey was conducted, we prepared 16 additional painted images from the Web. We extracted the structure lines to generate line drawings and colorized them using Canna, a randomly selected version of PaintsChainer. Then, we applied our two frameworks and produced colorizing results. We performed the user survey with three colorizing results and line drawings obtained in this way.
To evaluate whether our model was superior to previous automated colorizing methods, we asked eight participants. The participants included seven men and one woman, all are in their 20s. One was very interested in illustration and had experience in creating manga style images, and five were little interested in creating artworks. The others were not interested in illustration. First, the participants viewed the three colorizing results and line drawings. They were asked to select the best result of the line drawing colorization from among the three images. Participants could choose multiple images if they determined that images were of the same rank. This process was performed for eight types of randomly selected line drawings. Next, in addition of asking the same question for the remaining eight drawings, we asked the participants to provide reasons for their judgement. We prepared four items and other descriptive forms for responses. The four items were as follows:
- •
The sclera are of an unnatural shape.
- •
The impression of the facial expression given by the sclera is undesirable.
- •
The appearance of the colorized sclera is not consistent with the rest of the image.
- •
The images are indistinguishable.
Table 2 shows the results of the user study.
| Vote rate | |
|---|---|
| PC | 0.0313 (4) |
| MT | 0.2344 (30) |
| GT | 0.2188 (28) |
| PC and MT are tied | 0.0156 (2) |
| PC and GT are tied | 0.0078 (1) |
| MT and GT are tied | 0.0703 (9) |
| Indistinguishable | 0.4219 (54) |
User study results for PaintsChainer (PC), the manual type (MT), and the graph cut type (GT). The numbers in parentheses indicate the number of votes
Statistics show that the most common answer was that there was no difference between the images. However, when comparing the previous approach and our two methods, our methods had a higher vote rate. Many participants chose the first or third item as reasons for choosing the manual type or the graph cut type. When choosing multiple methods or choosing the previous approach, the items chosen were sparse. Many participants chose the first item when sclera-region detection was not successful, such as when the sclera regions were extremely small. In the manual type’s detection results, the sclera regions may appear slightly expanded due to the blurring process. In that case, the participants tended to choose the first and third items. The third item was often chosen when the sclera were painted with the pupil or skin color. When there was a difference in the presence or absence of highlights or the size of detected sclera regions between the results of each colorizing method, the participants often chose the second item. We found that the impression of the face is affected by the highlights and the size of the sclera. The fourth item was chosen when the participants answered that the results using each method all had the same rank.
6. CONCLUSION
In this study, we attempted to detect sclera regions using semantic segmentation and improve the accuracy of previous automated colorization approaches. Figures 11 and 12 show examples of sclera-region colorization. The line drawing of Figures 13 and 12 which applied LineDistiller are from Manga109 database [26]. We expect the prediction accuracy to improve with larger data sets. According to our user study, colorizing when considering sclera regions is somewhat superior to previous colorization methods, but many respondents indicated that there was not much difference between these methods. We have three tasks to improve the accuracy of detection and the quality of colorization.
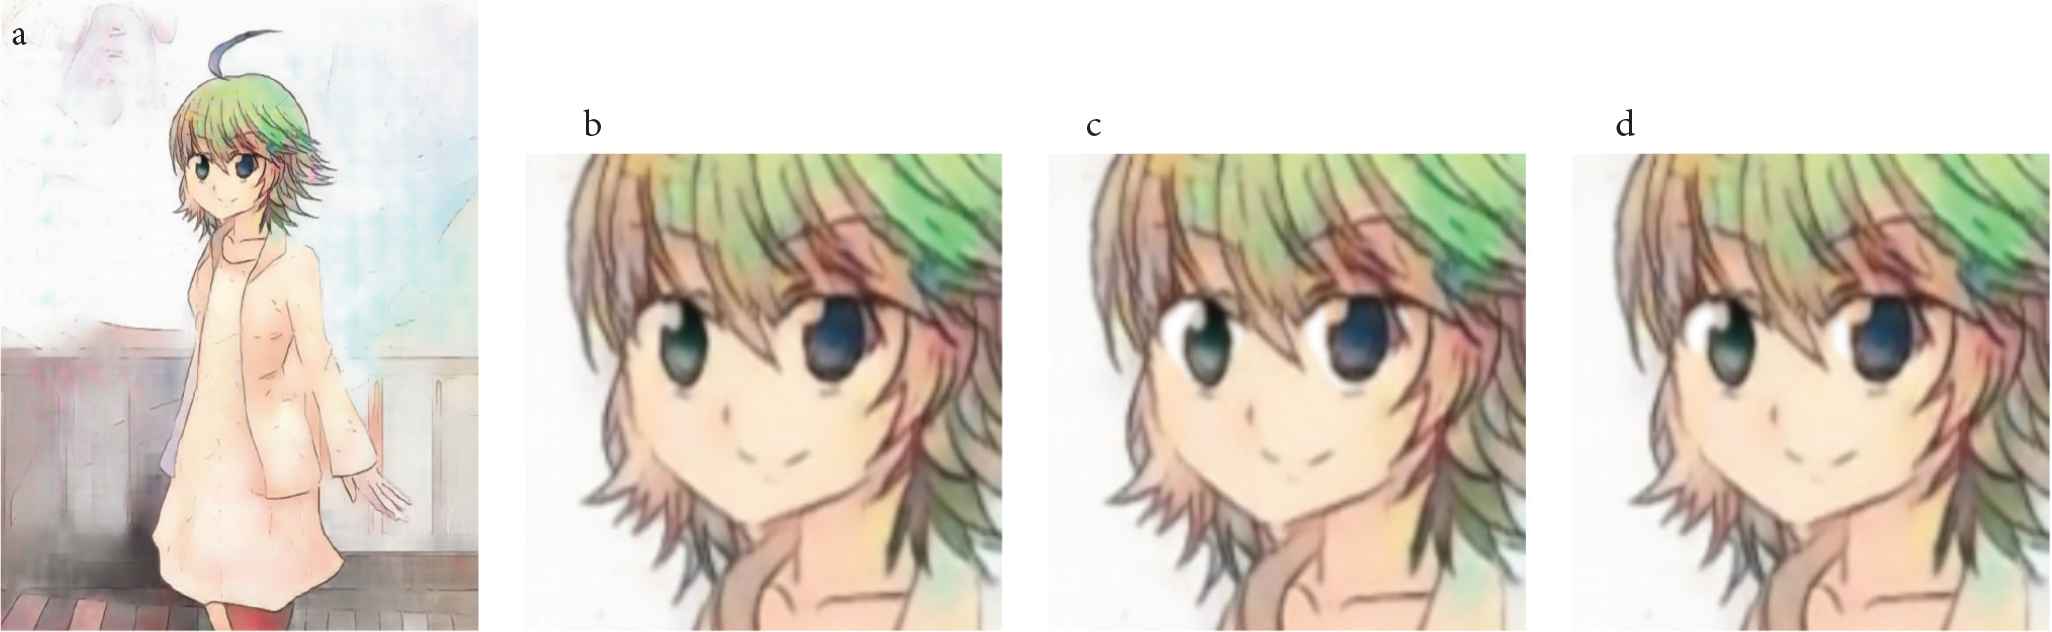
Examples of our approach results. (a) The colorization result using PaintsChainer [1]. (b) The cropped face of (a). (c) The colorization result using our approach (manual type). (d) The colorization result using our approach (graph cut type).

Colorization results of professional line drawings. (a) Line drawing by professional manga artist © Ayuko Omi. (b) Sclera-region detection for (a) used manual type model. (c) Sclera-region detection for (a) used graph cut type model. (d) Colorization result used PaintsChainer tanpopo version. (e) Sclera-region colorization for (d) used manual type model. (f) Sclera-region colorization for (d) used graph cut type model. (g) Colorization result used PaintsChainer satsuki version. (h) Sclera-region colorization for (g) used manual type model. (i) Sclera-region colorization for (g) used manual type model. (j) Colorization result used PaintsChainer Canna version. (k) Sclera-region colorization for (j) used manual type model. (l) Sclera-region colorization for (j) used manual type model.
Limitations. Sclera regions may not be detected properly. (a) Line drawing © Motoei Shinzawa. (b) Manual type segmentation. (c) Graph cut type segmentation.
6.1. Consideration of Impression
According our user study, the impression created by a face changes depending on the presence of highlights and the size of the sclera regions. This change is smaller than with expressions, such as anger or pleasure, and the user’s preference depends on individual sensitivities. Thus, it is difficult to colorize when trying to control the impression the face creates. We believe that colorization quality improves when using labeled data sets related to facial appearance.
6.2. Selection of Appropriate Tools
In our approach, we used specific tools for face detection and outline extraction. These tools presented some issues. For instance, in some cases the face detection tool did not work well. In addition, although the outline extraction tool output a line drawing with certain features based on training, it was unable to correspond to various inputs. Additional training data and further data set normalization might minimize these issues. Furthermore, segmentation results using our methods still present challenges in some cases. A training network hyperparameter selection, and additional training data may improve segmentation accuracy.
6.3. Sclera-region Texture
We colorized the sclera by overlaying the detected sclera regions in the automatic colorizing result. In this study, the texture of the sclera is only white. However, in actual illustrations, shadows sometimes fall on the sclera. We believe that colorizing with a shadow tends to create colorization that resembles actual artworks.
We believe improvements based on future works will benefit the development of a colorizing method suitable for grayscale line drawings of people.
ACKNOWLEDGMENTS
This work was supported by JSPS KAKENHI Grant Numbers JP17H04705, JP18H03229, JP18H03340, 18K19835, JP19H04113, JP19K12107.
REFERENCES
Cite this article
TY  - JOUR
AU  - Masashi Aizawa
AU  - Yuichi Sei
AU  - Yasuyuki Tahara
AU  - Ryohei Orihara
AU  - Akihiko Ohsuga
PY  - 2019
DA  - 2019/07/23
TI  - Do You Like Sclera? Sclera-region Detection and Colorization for Anime Character Line Drawings
JO  - International Journal of Networked and Distributed Computing
SP  - 113
EP  - 120
VL  - 7
IS  - 3
SN  - 2211-7946
UR  - https://doi.org/10.2991/ijndc.k.190711.001
DO  - 10.2991/ijndc.k.190711.001
ID  - Aizawa2019
ER  -