
The Firm Life Cycle Forecasting Model Using Machine Learning Based on News Articles
- DOI
- 10.2991/ijndc.k.201218.002How to use a DOI?
- Keywords
- Firm life cycle prediction; news analysis; machine learning; text feature selection
- Abstract
The determination of the firm life cycle has been carried out in relation to the establishment of corporate strategy in the field of accounting or management. The life cycle prediction based on financial information is long because it is determined based on the financial performance of the entity over a year. This study sought to lay the foundation for overcoming this by using news articles to predict the life cycle of a company. In the process of quantifying news article data and predicting the firm life cycle, the method of selecting keywords that can represent the firm life cycle is presented, and the life cycle prediction model is verified with four machine learning techniques using selected candidate keywords. In this study, all four machine learning techniques showed a predicted static classification rate of nearly 60%, demonstrating the availability of news articles, which are unstructured text data, in predicting the corporate life cycle.
- Copyright
- © 2021 The Authors. Published by Atlantis Press B.V.
- Open Access
- This is an open access article distributed under the CC BY-NC 4.0 license (http://creativecommons.org/licenses/by-nc/4.0/).
1. INTRODUCTION
The term corporate life cycle (or firm life cycle) is a concept that extends the theory on the life cycle of a product to the level of a company. The life cycle of an enterprise is sometimes defined by internal factors, financial factors and markets, and external circumstances as five phases of establishment, growth, maturity, decline, dissolution, or three phases that excludes establishment and decline. It is important because it can be used as an indicator to determine the strategic direction, market response, investment, and direction depending on the phase of the entity’s life cycle. Existing research on corporate life cycles mainly consists of analysis methods using financial and market value information. Financial information means information produced with annual, quarterly, or semi-annual cycles. For this reason, there is an inherent limitation of lack of immediateness. In this study, based on the financial and market value information of the enterprise obtained from prior research, the company’s life cycle is predicted. Then, the company’s life cycle can be tested by utilizing the news article data. In this study, we demonstrate how to select candidates for keywords that can represent a company’s life cycle and how to use selected candidate keywords to implement a machine learning model that uses the corporate life cycle phase defined by financial information as a target variable.
2. BACKGROUND
2.1. Firm Life Cycle Research
The life cycle of an enterprise is generally divided into four phases: founding, growing, maturing, and declining [1]. However, depending on the researcher, it can also be divided into five phases (setup, growth, maturity, renewal, and decline) [2]. Anthony and Ramesh [3] used dividend propensity, sales growth and corporate age to distinguish the entity’s life cycle, and Black [4] separated the entity’s life cycle by analyzing its accounting and operating activities, financial activities and investment activities at each phase of its life cycle. Dickinson [5] classified the entity’s life cycle according to the direction of cash flows from operating activities, cash flows from investing activities and cash flows from financial activities. In Korea, Kwon [6] studied the effects of components of the book value of equity on stock prices according to the life cycle of the entity. The lifetime cycle predictors used sales growth rates, tangible fixed asset growth rates, and corporate age. The life cycle phases were classified into three phases: growth, maturity and decline [7]. It also argued that rational decision-making requires analysis of the components of book value and the lifecycle of the entity [8]. Choi et al. [9] used Korean data to analyze the relevance of accounting information to the value of the company’s life cycle and to classify the entity’s life cycle using variables such as sales growth rate, property, plant and equipment growth rate, and employee growth rate [9]. Kwon and Moon [10] noted that the ratio of R&D and capital expenditures claimed by Bens et al. [11] as underlying assets, Market-to-Book value (M/B), and sales growth rates measured the life cycle [10]. It also reviewed claims made by DeAngelo et al. [12] that the ratio of retained earnings to capital was used as a life cycle measure [10]. In this study, Park and Park [13] measures the firm life cycle using the firm life cycle measurement. Kwon and Moon [10] studied Anthony and Ramesh’s corporate life cycle measurements as alternatives, and Park and Park [13] used Kwon’s method of measuring the firm life cycle, while Kwon and Moon [10] defined the life cycle based on the tercile, whereas Choi et al.’s [9] measurements were divided into the quintile.
2.2. Text Analysis
Among the text analysis areas, general analysis procedures in the field of classification are carried out as procedures for quantifying text, characterization, and application of machine learning analysis techniques [14]. Although there are different methods for each procedure, one-hot encoding [15] and the frequency of keyword emergence (TF: Term Frequency) [16] were used in this study. There are two ways to quantify and represent keywords to classify or analyze specific documents, which are one-hot presentation and distributed presentation [14]. Local representation is a method of expressing only elements corresponding to the word in an N-dimensional vector with a value of 1 when there is a collection of N words [14]. Vectors generated by these methods of expression are called one-hot vectors and are called one-hot retention or one-hot encoding. Local representation is simple and easy to implement, but it has the disadvantage of failing to express the semantic relationship between words in the overall context of the set of words [14]. Although there are these shortcomings, news articles contain practical content in the title, the length of the sentences is short and no overlapping words, and carry a single message. For this reason, it was judged that the one-hot presentation method would be more appropriate than the keyword frequency-based TF-Inverse Document Frequency (TF-IDF) method [17] or word2vec [18], which focuses on word order and surrounding words.
On the other hand, from the perspective of the analytical model, the study predicts the life cycle of the enterprise by using the year-business equivalent news article title as a document (case) and extracted keywords as independent variables. The number of keywords extracted at this time is so large that it is essential to reduce the high-dimensional word vector matrix to computable dimensions [19]. In this study, the number of variables was reduced using unbalanced indices rather than matrix-based dimensional reduction techniques such as Principal Component Analysis (PCA) [20] and Non-negative Matrix Factorization (NMF) [21] because the number of variables should be reduced around keyword candidates that can represent the life cycle phases of an enterprise. On the other hand, the imbalance index is an index used to determine the degree of competition in the industry when measuring market structure in the field of economics, with the typical imbalance index being the higher enterprise concentration rate, the Hershman-Huffindal index and the entropy index [22]. In this study, the candidates for keywords that can represent the firm life cycle were selected first, reduced in scope, and then again, the universal keywords were selected on a subjective basis. This is because even if any candidate keyword is selected, it can be verified with a model implemented through machine learning to demonstrate the representation of the candidate keyword. Among the mentioned unbalance indices, the unbalance index applied to this study is the entropy index. In the case of higher enterprise concentration techniques, the life cycle was divided into three phases and could not be utilized because it was not suitable for selecting the top k.
2.3. Machine Learning
Since the life cycle of a company that wants to be classified must be classified into three or more life cycle phases, among the machine learning algorithms based on guidance learning, an algorithm that can also be learned about three or more classes is appropriate. In addition, since a set of keywords affecting each life cycle should be composed of independent variables, an algorithm that can explain the effects of independent variables on three or more classes is appropriate. The decision tree, Support Vector Machine (SVM), and Artificial Neural Network (ANN) were selected as these criteria. Among the decision tree algorithms, the two algorithms, C5.0 [23] and Chi-square Automatic Interaction Detector (CHAID) [24], are considered suitable. For SVM, performance comparisons with other algorithms and reliability reviews of final selection algorithms were chosen because they were generally rated as the best classification among machine learning algorithms [25,26]. For the same reason, Multi-Layer Perceptron (MLP) was chosen from the ANN [25,26].
3. RESEARCH METHODS
3.1. Introduction
The experimental design of this study is as shown in Figure 1. Financial information was collected through National Information & Credit Evaluation Inc. (NICE’s) KIS-Value1 from 2007 to 2018. The collection of news articles was based on articles in the economic category of Korean portal site Naver2 from 2011 to 2018. The method of collecting news articles was based on HTTP. The next phase was defined as growth period, maturity period, and decline based on prior research conducted on domestic companies as the phase of defining the firm life cycle based on financial information. At the phase of predicting the firm life cycle based on the news articles to assert in this study, three processes are taken to extract keywords that predict the firm life cycle from news articles. The first process is to create two news articles, Corpus A and Corpus B. Corpus A consists of the full title of news articles corresponding to the target year-enterprise selected through financial information-based corporate life cycle forecasts. Corpus B organizes the titles of news articles grouped by life cycle, separating news articles from selected target year-company. Corpus A is needed to analyze the entire data in order to discover keywords representing the life cycle, and Corpus B is the necessary coppers to detect keyword candidates who can represent the life cycle.
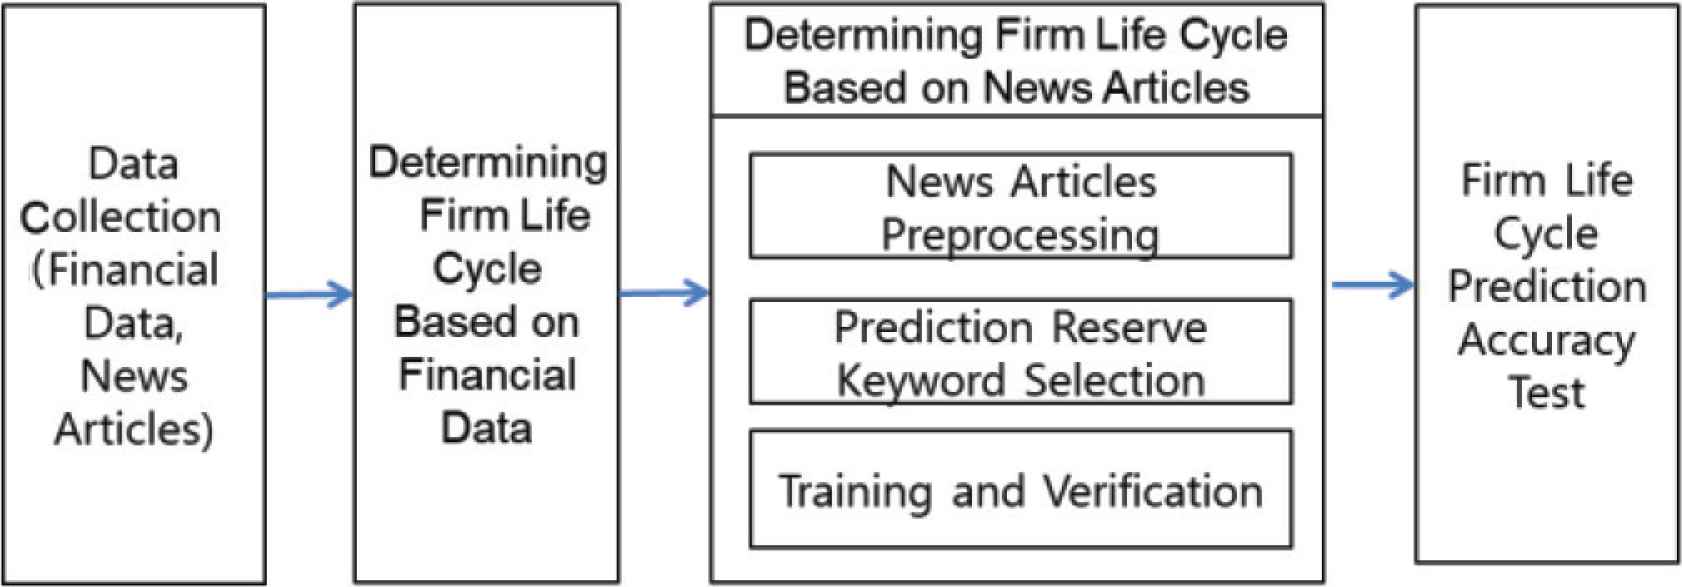
Design of the experiment.
In the second process of the News article-based corporate life cycle prediction phase, only nouns and noun phrase keywords are extracted from Corpus A using a morpheme analyzer to form a list of independent variable candidates for corporate life cycle forecasting. Then, search the configured keyword variable candidate keywords in Corpus B and calculate the frequency of their appearance in each life cycle to form the ‘Keyword Frequency Matrix by Life Cycle’. ‘Keyword Frequency Matrix by Life Cycle’ was used to select keywords that appeared frequently at certain life cycle phases by utilizing unbalanced indices. Each selected keyword is then searched again on Corpus B to indicate whether it appeared, and the year-company and whether the keyword appeared constitutes a matrix of rows and columns, respectively. In this paper, this matrix is referred to as the Year-Firm × Keyword matrix (hereinafter YFK matrix). In the third stage, after applying the machine learning algorithm with the YFK matrix as input data, the most influential keywords in each life cycle are selected and divided into the learning and verification sets to verify the reliability of the model.
In the final step, the keywords detected to represent the firm life cycle will be applied to the model implemented at the previous process in contrast to the results of the 2018 financial information-based firm life cycle forecast, thereby validating the validity of the experiment and demonstrating the significance of the firm life cycle prediction through the news article that is intended to be argued in this paper.
3.2. Financial Data and News Articles Collection
Financial information-based firm life cycle forecasts were targeted at companies in the midsize corporation categories of KOSPI and KODAQ300. The data used for the determination was ‘191060/Sales Growth (SG)’, ‘191020/Property, Plant, and Equipment (PP&E) Growth Rate (CE)’, ‘191090/Change in the Number of Employees (EXP)’, ‘118300/Retained earnings’, ‘261000/Capital at the beginning’, ‘0D2121/PBR(H)’ and ‘0D2122/PBR(L)’. Among them, ‘118300/Retained earnings’ and ‘261000/Capital at the beginning’ were transformed into SE using a formula for dividing the Retained earnings into the Capital at the beginning according to the preceding study, and the values of ‘0D2121/PBR(H)’ and ‘0D2122/PBR(L)’ were also transformed from the Price to Book Ratio (PBR) of the high point and the PBR of the low point to M/B, the value of the market/book value.
The collection of news articles only extracted and stored the title and body of news articles, the time of article creation, URLs, and media companies in order to focus only on the information to be analyzed.
3.3. Firm Life Cycle Defined by Financial Data
The firm’s life cycle can be determined by the sum of the values of each financial variable, and the method of determination is the same as Table 1 [13]. After measuring the five indicators in Table 1 by median of the total 5-year values, including the current period and the past 4 years, each indicator value is divided into five quantile per each year, and points from 1 to 5 in order from the higher quantile. For example, a sample entity is classified as a quantile on a total basis [13] by giving 1 point to the top-five sales growth rate and 5 points to all indicators, and then by aggregating the scores on an enterprise-year basis and sorting the combined scores in ascending order. In this study, the sum of the values granted to each indicator is a minimum of 5 to a maximum of 25 points, and the year-to-enterprise summing up and then, the year-to-year groups of 1st, 3rd, and 5th quantile are defined as growth periods, maturity, and decadence periods. According to a study by Park and Park [13], companies between 5 and 25 are divided into the quintile, and the 2nd and 4th quantiles are boundary zones and cannot have the discriminative power of the life cycle. Because the reason for using median for values for 5 years including the current period for each metric is that if only current period data are used, the previous study also utilizes median for 5 years, including that year [13]. The reference scale and the reference measure for the five quantile classification are as shown in Table 2 [13].
| Indicator | Definition | Methods for calculating |
|---|---|---|
| Sales Growth (SG) | (Net sales/Lagged net sales)-1 | Mid-term growth rate of sales over the past 4 years from the current term. |
| Changes in Capital Expenditures (CE) | (Property, plant, and equipment (PP&E)/Lagged PP&E)-1 | ((Current Tangible Assets - Former Tangible Assets)/Average of End-of-Tangible Assets): Medium value of the growth rate from the current term to the previous 4 years. |
| Market-to-Book Ratio (M/B) | Market value of equity/Book value of equity | The median market value/book value for the past 4 years from the current term. |
| Change in the Number of Employees (EXP) | (The number of employees/Lagged the number of employees)-1 | The median employee growth rate from the current term to the past 4 years. |
| Retained Earnings Ratio (SE) | (Retained earnings/Capital at the beginning) | The median profit surplus ratio from the current term to the past 4 years. |
Source: Park and Park [13].
Methods for calculating financial information for predicting the firm life cycle
| Firm life cycle phase | SG | CE | M/B | EXP | SE |
|---|---|---|---|---|---|
| Phase 1 (Growth) | Very high | Very high | Very high | Very high | Very low |
| Phase 2 | A little high | A little high | A little high | A little high | A little low |
| Phase 3 (Maturity) | Medium | Medium | Medium | Medium | Medium |
| Phase 4 | A little low | A little low | A little low | A little low | A little high |
| Phase 5 (Decline) | Very low | Very low | Very low | Very low | Very high |
Measures of financial information for measuring the firm life cycle
The determined lifecycle of a company is verified by an analysis of basic statistics, with sales growth (SG), capital expenditure growth (CE), and EXP showing relatively higher growth rates in the growth phase than in other stages, and then slowing down in the maturity period and decreasing in the decline. Market value/book value (M/B) is expected to be high in growth and slow in maturity and then decline in decline in decline due to expectations of corporate growth. The proportion of retained earnings (SE) is verified for a tendency to decrease as the period progresses toward decline [13]. The appropriate scope and confidence criteria for the underlying statistics of each discriminant scale were unknown and the methods validated in the preceding study were applied.
3.4. Firm Life Cycle Prediction through News Articles
3.4.1. News articles preprocessing
Prior to screening the firm life cycle identification keywords from collected news articles, the main content of the preprocessing work is to match news articles to the year-to-year life cycle obtained from financial information. The year-to-year life cycle obtained from financial information informs the phase of the entity’s life cycle in the year, in which the collected news data are based on the year and the company’s name, and then only the news titles are performed, and the search results are stored together with the year-to-business information and life cycle phases to generate basic data for analysis. When storing, the company’s name is stored except for the name of the entity included in the news title, because the company name itself cannot be considered a universal word representing the firm life cycle. The reason for searching only in news titles is that the body of news in the economic category often refers to the entity as well as to its peer group or similar stock themes, and because news related to a particular company refers most clearly to that entity in the title, the scope of the search was limited to titles only.
Large companies and distribution-related companies have a lot of basic news, but they distribute news articles to their respective media outlets in the form of press releases, which can lead to biased results in selecting candidates for the next stage due to the absolute high volume of articles from certain companies. For this reason, the top 1% of news data searched and stored as year-to-business were excluded from the analysis by grouping news data by company and arranging them in descending order of news volume.
The morpheme analyzer was then used to extract words with nouns and noun phrases from the title of the news where the ideal was removed, but only words with more than two syllables were extracted. The reason for extracting nouns and nouns is that other parts (adjectives, verbs, adverbs, etc.) are words used to describe or supplement the situation, and individual entities believe that the message they are trying to convey may contain relatively exaggerated or distorted expressions, which would be inappropriate to use as a keyword representing the life cycle they intend to demonstrate in this study. Extracting only words with two or more syllables has been ruled out because the inclusion of one syllable word may widen the range of keywords and obscure the meaning of the one syllable word, but the exclusion of one syllable is unlikely to affect the demonstration, given the purpose of this study.
3.4.2. Firm life cycle prediction reserve keywords selection
In this study, each extracted keyword is searched on the news again to calculate the frequency of appearance for each life cycle, and since keywords with equal frequency distribution for each life cycle cannot represent a particular life cycle, discriminating candidate keywords with biased frequencies in a particular life cycle are selected using the entropy index. The formula for the entropy index to select discriminating keywords is as follows:
In this case, Si means the ratio of keyword frequency for each life cycle and N = 3, since it consists of three life cycle phases. The result of the calculation using entropy index is to sort the value of entropy index in ascending order, review the keywords with the lowest entropy index first, and then select the keyword to exclude.
3.4.3. Training and verification
For scientific verification of keyword candidates for selected life cycle identification, selected keyword candidates are verified through machine learning algorithms. To this end, a matrix in YFK format was created and the text was quantified in one-hot presentation. The generated YFK matrix was taught and verified by applying C5.0 of decision tree algorithm, which is a map learning-based machine learning algorithm, and MLP among CHAID, SVM, and ANN techniques. The target variable for learning is the life cycle phase, and the independent variable is the selected keyword candidates. When applying machine learning techniques, it can be said that the model is stable if the static rate in the verification set does not differ significantly from that in the learning set when the results learned with the learning set are applied to the verification set. In this study, the learning set and verification set are also constructed in a ratio of 70–30 to verify the stability of the model. In addition, among the four machine learning techniques tested in this study, C5.0 of the decision tree technique provides rules among each independent variable by analyzing the effects of independent variables, so the C5.0 algorithm secures keyword rules for lifetime cycle prediction and other techniques are used to compare the classification performance of the C5.0 algorithm.
4. EXPERIMENT RESULT
4.1. Machine Learning Training
4.1.1. Data preparation
The financial information collected for learning and verification is 1007 based on the source data, and 11,082 based on the year-to-enterprise basis. The number of year-to-year records for enterprises in their growth, maturity and decline, which eliminate unnecessary or meaningless records, is finally 2269; in the same way, records for test sets of financial information criteria are 1007, 5893, and 506, respectively. The study verification and test set were based on the enterprise category based on KIS-Value and the same number of test sets were defined using financial information for 2018. Meanwhile, for news data, the total target news data for learning and verification sets is 2,865,667 and the final year-to-business number is 34,261. The number of keywords extracted from the nouns and noun phrases is 6441, and the number of keywords randomly selected for this study is 49, and the number of records when the YFK matrix was composed of 4373. The composition of test sets for news articles is 488,748 overall news articles, which is the number of articles for 2018. Year-The number of corporate news is 10,253 and the number of records comprising the YFK matrix is 1709. Since the test is conducted by applying the machine learning model generated from the learning and verification set, the test set does not extract keywords or randomly select keyword candidates. Details of the data configuration are shown in Table 3. The excluded data were for records missing years from the source data, records with data entered as zero prior to 2010, records containing data that were broken down into zero and generated errors, and records with values for each metric being upper or lower 1%.
| Source | T-V set | Test set | |
|---|---|---|---|
| Financial information | Number of companies in source data | 1007 | 1007 |
| Year of source data number of companies | 11,082 | 5893 | |
| Exclusion records | 6584 | 5096 | |
| 2,4 phase data exclusion | 2229 | 291 | |
| Final number of records | 2269 | 506 | |
| News articles | Total | 2,865,667 | 488,748 |
| Year number of corporate News | 34,261 | 10,211 | |
| Number of extraction keywords | 6441 | N/A | |
| Number of reserve keywords | 49 | N/A | |
| Number of YFK records | 4373 | 1709 | |
T-V, Training-Verification Set.
Summary of financial information and news article data
4.1.2. Defining firm life cycle through financial data
Securing financial information and defining an entity’s life cycle was tested in accordance with the methodology of prior research. The number of financial information year-to-year entities to construct a learning/verification set is 4,498 and the number of year-to-year entities to construct a test set is 825. Based on financial information, the ratio of each component from phase 1 to 5 is within 2% of the learning. It was determined that there would be no significant problem in the composition of the life cycle phase of the test sets (Table 4).
| Firm life cycle (N = 4498) | ||||||
|---|---|---|---|---|---|---|
| Growth (N = 1172) | Maturity (N = 948) | Decline (N = 759) | ||||
| Means | Std. dev | Means | Std. dev | Means | Std. dev | |
| SG | 17.41 | 13.57 | 4.21 | 10.64 | −5.91 | 9.36 |
| CE | 13.60 | 14.72 | 2.36 | 11.64 | −3.91 | 6.86 |
| M/B | 1.84 | 1.09 | 1.47 | 1.04 | 1.01 | 0.69 |
| EXP | 10.48 | 8.56 | 2.54 | 7.45 | −4.09 | 6.26 |
| SE | 4.65 | 7.53 | 6.70 | 9.16 | 9.76 | 11.07 |
Firm life cycle basic statistics based on financial information
The composition of the underlying data for the definition of the entity’s life cycle in the financial information basis determines the distribution of each indicator by the actual values of each indicator in SG, CE, M/B, EXP and SE as shown in Table 5, and then calculates the quintile by summing the values of each indicator. For the convenience of calculation, the final phase was expressed in numbers, and the values of 1, 3 and 5 in the final phase column correspond to the growing, maturing and declining periods, respectively.
| Year | Corp. name | Quintile | SG | ... | SE | ||||
|---|---|---|---|---|---|---|---|---|---|
| Final phase | Sum | SG | ... | SE | |||||
| 2016 | H Inc. | 3 | 15 | 3 | ... | 2 | 5.330 | ... | |
| 2017 | H Inc. | 4 | 17 | 5 | ... | 2 | (4.880) | ... | 1.407 |
| 2017 | D Inc. | 2 | 14 | 1 | ... | 4 | 16.940 | ... | 8.922 |
| 2015 | A Inc. | 5 | 20 | 5 | ... | 3 | (25.8) | ... | 4.708 |
| 2017 | A Inc. | 5 | 20 | 5 | ... | 3 | (15.6) | ... | 4.695 |
| 2012 | K Inc. | 1 | 11 | 2 | ... | 2 | 10.760 | ... | 2.908 |
| 2013 | K Inc. | 2 | 14 | 4 | ... | 2 | 2.000 | ... | 2.852 |
| : | : | : | : | : | ... | : | : | ... | : |
| 2016 | M Inc. | 4 | 17 | 4 | ... | 1 | 1.210 | ... | (2.661) |
Example of life cycle discrimination based on financial information
4.1.3. News articles preprocessing result
The results of the search were retrieved only from the title section of the news data and stored together with the firm life cycle phases based on year-to-year and financial information criteria. The year-for-business search excluded the names of entities with less than two characters. In addition, only the news of the year was required to search for articles related to the company, and news of department stores and large companies that produced relatively large amounts of articles was excluded from the top 1% list. Table 6 lists the results of each life cycle phase news article obtained through search results in a table, divided into learning, verification, and test sets.
| Data coverage | Year-firm news count | Growth phase | Maturity phase | Decline phase |
|---|---|---|---|---|
| T-V set (2011–2017) | 34,261 | 11,603 (34%) | 14,916 (43%) | 7742 (23%) |
| Test set (2018) | 10,211 | 3794 (37%) | 5490 (54%) | 927 (9%) |
Year by corporate life cycle phase number of corporate news
4.1.4. Model training and verification
The total number of nouns and noun phrases extracted was 6411 and 6411 keywords were divided and selected into 49 keywords by organizing the frequency of appearing in each life cycle in order to select candidates for the life cycle prediction keyword. Where possible, the 49 selected keywords were randomly selected around management-related keywords of the entity or keywords related to the external environment, and were included in Table 7. In addition, the values in the ‘selection’ column, expressed in Table 7, are given a life cycle label for judging keyword candidates and are not used to construct a YFK matrix for the actual learning model and are not relevant to the learning model.
| No | Reserve keyword | G | M | D | Selection |
|---|---|---|---|---|---|
| 1 | stock trends | 13 | 110 | 7 | M |
| 2 | strike | 8 | 66 | 32 | M |
| 3 | court | 4 | 18 | 41 | D |
| 4 | bond | 24 | 65 | 9 | M |
| 5 | court receivership | 2 | 13 | 5 | M |
| 6 | overheating | 2 | 5 | 16 | D |
| 7 | the lower limit | 7 | 7 | 21 | D |
| 8 | finance | 8 | 36 | 13 | M |
| 9 | private equity | 6 | 6 | 22 | D |
| 10 | closure | 18 | 64 | 5 | M |
| 11 | monopoly | 6 | 5 | 14 | D |
| 12 | breach of trust | 8 | 38 | 8 | M |
| 13 | delay | 53 | 5 | 3 | G |
| 14 | cost | 50 | 4 | 4 | G |
| 15 | capital | 10 | 35 | 9 | M |
| 16 | promotion | 42 | 14 | 5 | G |
| 17 | accumulation | 49 | 14 | 13 | G |
| 18 | system | 98 | 47 | 24 | G |
| 19 | life and death | 61 | 22 | 16 | G |
| 20 | regeneration | 2 | 10 | 22 | D |
| 21 | insolvency | 10 | 38 | 4 | M |
| 22 | experienced employee | 14 | 3 | 2 | G |
| 23 | a record high | 16 | 5 | 2 | G |
| 24 | trade | 11 | 67 | 9 | M |
| 25 | compensation | 9 | 3 | 22 | D |
| 26 | the prosecution | 21 | 43 | 20 | M |
| 27 | alliance | 83 | 33 | 18 | G |
| 28 | expansion | 8 | 26 | 2 | M |
| 29 | reduction | 15 | 2 | 1 | G |
| 30 | new recruits | 81 | 29 | 10 | G |
| 31 | preemptive right | 12 | 1 | 1 | G |
| 32 | private equity fund | 2 | 2 | 14 | D |
| 33 | appeal | 5 | 5 | 18 | D |
| 34 | introduction | 167 | 51 | 6 | G |
| 35 | keeping securities | 4 | 5 | 20 | D |
| 36 | dispute | 1 | 6 | 19 | D |
| 37 | suspicion | 9 | 26 | 6 | M |
| 38 | turning | 1 | 6 | 38 | D |
| 39 | holding | 8 | 15 | 41 | D |
| 40 | a decision of the court | 5 | 4 | 22 | D |
| 41 | input | 26 | 12 | 1 | G |
| 42 | product | 68 | 247 | 99 | M |
| 43 | goods | 81 | 251 | 36 | M |
| 44 | accident | 125 | 10 | 18 | G |
| 45 | transfer | 6 | 10 | 77 | D |
| 46 | progress | 95 | 344 | 58 | M |
| 47 | breakthrough | 113 | 54 | 41 | G |
| 48 | collusion | 9 | 32 | 77 | D |
| 49 | anew | 280 | 103 | 46 | G |
G, Growth phase; M, Maturity phase; D, Decline phase.
Reserve keyword for firm lifecycle prediction based on news articles
Next, the YFK matrix was created for machine learning using selected keyword candidates for predicting the firm life cycle. The learning verification set consists of 4373 rows and 49 independent variables. In other words, a matrix with keyword candidates is made, where each keyword candidate is configured to have a value of 1 or 0 only, whether or not they appear in the year-business news article title. Figure 2 is an example of the composition of the YFK matrix.
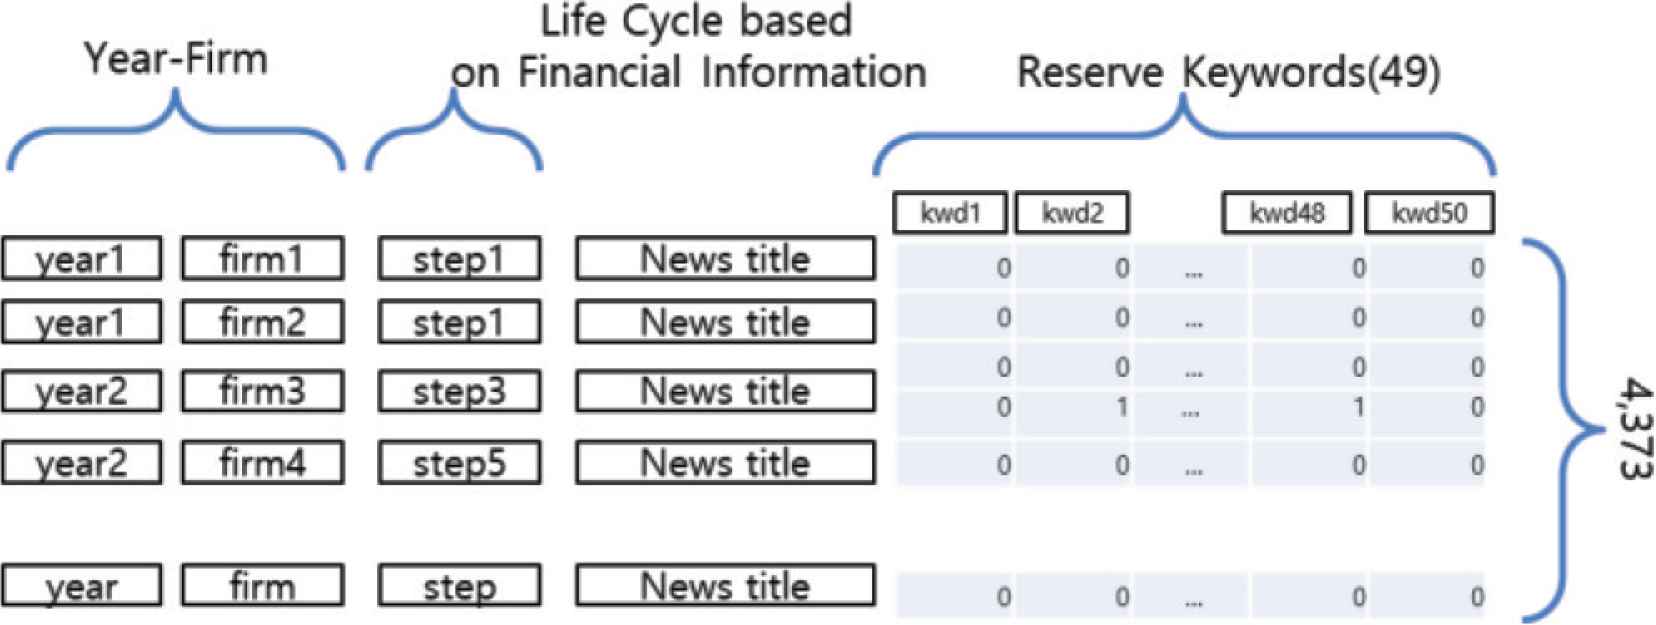
The composition of the YFK matrix.
Year-firm × keyword matrix files were entered as source data and analyzed using IBM Modeler 18.1. The machine learning analysis result is as shown in Table 8.
| ML model | Verification | Training (A) (%) | Verification (B) (%) | |A − B| (%) |
|---|---|---|---|---|
| C5.0 | Exact | 66.88 | 68.19 | 1.31 |
| Wrong | 33.12 | 31.81 | ||
| Total | 100.00 | 100.00 | ||
| CHAID | Exact | 50.43 | 52.73 | 2.30 |
| Wrong | 49.57 | 47.27 | ||
| Total | 100.00 | 100.00 | ||
| SVM | Exact | 67.30 | 68.48 | 1.18 |
| Wrong | 32.70 | 31.52 | ||
| Total | 100.00 | 100.00 | ||
| ANN (MLP) | Exact | 66.78 | 68.33 | 1.55 |
| Wrong | 33.22 | 31.67 | ||
| Total | 100.00 | 100.0 |
Comparison of classification rate of learning and verification by machine learning algorithms
As Table 8 shows, C5.0 was the highest at 66.88%, and CHAID was the lowest at 50.43%. The static rate of the verification set was the highest for SVM at 68.48%, and the lowest for CHAID at 52.73%. The difference in the static rate between the learning set and the verification set of each algorithm is the most stable at 1.18%, and the three algorithms except CHAID show a difference of <2%, so it can be said that the model has been implemented stably.
4.2. Firm Life Cycle Prediction by News Articles
4.2.1. Prediction test
This study further confirmed the feasibility of the implemented model by constructing a separate set of tests to ensure the validity of the experiment. 10,211 news data already collected for testing in 2018 were utilized.
| ML model | Accuracy | ||
|---|---|---|---|
| Training (70%) | Verification (30%) | Test (%) | |
| C5.0 | 66.88 | 68.19 | 62.9 |
| CHAID | 50.43 | 52.73 | 65.3 |
| SVM | 67.3 | 68.48 | 63.37 |
| ANN (MLP) | 66.78 | 68.33 | 63.6 |
Final results of machine learning algorithm learning, verification, and testing
Table 9 is the result of measuring the static rate by applying four different machine learning algorithms. As shown in Table 9, mechanical learning algorithms excluding CHAIDs show a slightly lower static rate than the static rate in the learning and verification sets, but generally around 63%. In the case of CHAID, the static rate of the test set was found to be higher than that of the learning and verification sets. As shown in the categorization rate of three machine learning algorithms other than CHAID, any keyword extracted from 2011 to 2017 was proven to be stable through learning and verification sets. Moreover, the results of testing the learning model with 2018 news data not included in learning show that the group of candidates for corporate life cycle prediction keywords used in the learning verification set can predict the firm life cycle with a static rate of about 63% for new news data. However, since the three algorithms except the C5.0 algorithm do not know which of the keyword candidates for the firm life cycle predictive, this study argues that it is the rule of independent variables for each phase of life cycle calculated in C5.0—the rule of the life cycle prediction keyword.
4.2.2. Prediction keyword rules
The rules for keywords that affected the static rate through the C5.0 algorithm according to the results of the previous experiment are listed in Table 10. The basic life cycle phase was calculated in three phases and the life cycle was predicted with 17 rules, one rule, and 15 rules respectively during the growth, maturity and decline phase. In Table 10, the ‘number of cases’ column refers to the number of cases determined by the keyword regular expression, and the probability is the probability that the rule will predict its life cycle. For example, a news article with the keyword “preemptive right” in the news article, and without the keyword “court,” can predict the life cycle during the growth period with a probability of about 86.7%, and the corresponding number of news articles is 13.
| Phase | Rule | Count | Prob. | Keyword rule |
|---|---|---|---|---|
| Growth phase | 1 | 13 | 0.867 | if ‘preemptive right’ = 1 and ‘court’ = 0 |
| 2 | 61 | 0.857 | if ‘delay’ = 1 | |
| 3 | 58 | 0.85 | if ‘cost’ = 1 | |
| 4 | 150 | 0.822 | if ‘compensation’ = 0 and ‘accident’ = 1 | |
| 5 | 18 | 0.8 | if ‘reduction’ = 1 | |
| 6 | 222 | 0.75 | if ‘introduction’ = 1 and ‘product’ = 0 | |
| 7 | 19 | 0.714 | if ‘experienced employee’ = 1 | |
| 8 | 61 | 0.683 | if ‘promotion’ = 1 | |
| 9 | 23 | 0.68 | if ‘a record high’ = 1 | |
| 10 | 120 | 0.672 | if ‘new recruits’ = 1 | |
| 11 | 39 | 0.659 | if ‘input’ = 1 | |
| 12 | 427 | 0.655 | if ‘stock trends’ = 0 and ‘anew’ = 1 | |
| 13 | 76 | 0.641 | if ‘accumulation’ = 1 | |
| 14 | 132 | 0.627 | if ‘alliance’ = 1 and ‘product’ = 0 | |
| 15 | 97 | 0.616 | if ‘new recruits’ = 0 and ‘life and death’ = 1 | |
| 16 | 164 | 0.59 | if ‘holding’ = 0 and ‘alliance’ = 0 and ‘system’ = 1 and ‘product’ = 0 | |
| 17 | 208 | 0.543 | if ‘breakthrough’ = 1 | |
| Maturity phase | 1 | 4280 | 0.427 | if ‘transfer’ = 0 |
| 1 | 45 | 0.83 | if ‘turning’ = 1 | |
| 2 | 93 | 0.821 | if ‘transfer’ = 1 | |
| 3 | 30 | 0.719 | if ‘a decision of the court’= 1 and ‘accident’ = 0 | |
| 4 | 26 | 0.714 | if ‘dispute’ = 1 | |
| 5 | 23 | 0.68 | if ‘overheating’ = 1 | |
| 6 | 26 | 0.679 | if ‘appeal’ = 1 and ‘accident’ = 0 | |
| 7 | 60 | 0.677 | if ‘court receivership’ = 0 and ‘court’ = 1 | |
| Decline phase | 8 | 29 | 0.677 | if ‘keeping securities’ = 1 |
| 9 | 116 | 0.661 | if ‘suspicion’ = 0 and ‘collusion’ = 1 | |
| 10 | 33 | 0.657 | if ‘dispute’ = 0 and ‘compensation’ = 1 | |
| 11 | 62 | 0.656 | if ‘holding’ = 1 and ‘system’ = 0 | |
| 12 | 34 | 0.639 | if ‘regeneration’ = 1 | |
| 13 | 34 | 0.639 | if ‘private equity’ = 1 | |
| 14 | 35 | 0.595 | if ‘the lower limit’ = 1 | |
| 15 | 24 | 0.577 | if ‘dispute’ = 0 and ‘monopoly’ = 1 |
News-based firm life cycle prediction keyword rules
5. CONCLUSION
In this study, after determining the financial information based firm life cycle presented in the preceding study, we verified whether the firm life cycle can be predicted by keywords extracted from news data based on these discriminations. Consequently, in predicting an entity’s life cycle, the entity’s life cycle could be predicted at a static rate of about 63% over the life cycle determined on a financial information basis. All four machine learning algorithms showed a slight difference in the static rate between the learning set and the verification set, proving that the composition of the model was stable. Moreover, the experiment showed that the learned model was applied to a separate set of tests other than the learning and verification set, resulting in a correction rate of about 63%. News-based firm life cycle models are also expected to be useful in the actual business environment or in the assessment of the enterprise. This means that the entity’s life cycle can be determined in a faster time than the existing financial information method, as it is characterized by daily production of news data, compared to that of the financial information method which is typically one year long or at a three-month cycle.
5.1. Future Challenges and Discussion Topics
The topics that can be studied in the future are as follows:
- •
A study on the correlation of financial information with keywords in news article.
- •
Application of various machine learning algorithms to increase predictability.
- •
A preprocessing algorithm that selects the characteristics of text to determine the correlation between keywords and the firm life cycle.
- •
A study on how to determine data with different phases of time flow or development, such as life cycle, through text data.
CONFLICTS OF INTEREST
The authors declare they have no conflicts of interest.
Footnotes
REFERENCES
Cite this article
TY  - JOUR
AU  - Si Young Lee
AU  - Sae Yong Oh
AU  - Sangwook Lee
AU  - Gwang Yong Gim
PY  - 2021
DA  - 2021/01/05
TI  - The Firm Life Cycle Forecasting Model Using Machine Learning Based on News Articles
JO  - International Journal of Networked and Distributed Computing
SP  - 1
EP  - 9
VL  - 9
IS  - 1
SN  - 2211-7946
UR  - https://doi.org/10.2991/ijndc.k.201218.002
DO  - 10.2991/ijndc.k.201218.002
ID  - Lee2021
ER  -