
The Prediction of COVID-19 Using LSTM Algorithms
- DOI
- 10.2991/ijndc.k.201218.003How to use a DOI?
- Keywords
- COVID-19; prediction; RNN; LSTM; economic effects
- Abstract
As COVID-19 enters the pandemic stage, the resulting infections, deaths and economic shocks are emerging. To minimize anxiety and uncertainty about socio-economic damage caused by the COVID-19 pandemic, it is necessary to reasonably predict the economic impact of future disease trends by scientific means. Based on previous cases of epidemic (such as influenza) and economic trends, this study has established an epidemic disease spread model and economic situation prediction model. Based on this model, the author also predict the economic impact of future COVID-19 spread. The results of this study are as follows. First, the deep learning-based economic impact prediction model, which was built based on historical infectious disease data, was verified with verification data to ensure 77% accuracy in predicting inflation rates. Second, based on the economic impact prediction model of the deep learning-based infectious disease, the author presented the COVID-19 trend and future economic impact prediction results for the next 1 year. Currently, most of the published studies on COVID-19 are on the prediction of disease spread by statistical mathematical calculations. This study is expected to be used as an empirical reference to efficient and preemptive decision making by predicting the spread of diseases and economic conditions related to COVID-19 using deep learning technology and historical infectious disease data.
- Copyright
- © 2021 The Authors. Published by Atlantis Press B.V.
- Open Access
- This is an open access article distributed under the CC BY-NC 4.0 license (http://creativecommons.org/licenses/by-nc/4.0/).
1. INTRODUCTION
The COVID-19 pandemic caused more than 22 million confirmed cases and more than 782,000 deaths worldwide as of August 2020. The new hepatitis disease is expected to have a serious economic cost as well as a direct impact on public health. The Bureau of Economic Analysis (BEA) reported a 4.8% on-year drop in U.S. first quarter Gross Domestic Product (GDP).1 The expectation that the COVID-19 pandemic will have an economically negative impact is likely to increase uncertainty throughout the economy. In order to minimize anxiety and uncertainty about economic damage caused by the pandemic of new infectious diseases, it is necessary to reasonably predict the economic impact by scientific method and establish a response strategy. Most of the existing studies on the economic effects of epidemic are statistical mathematical prediction based on disease spread model [1] or literature-based predictions based on economic scenarios [2]. However, statistical techniques are not suitable for traditional statistical predictive models because they do not show a clear negative nor quantitative linear correlation for individual economic indicators. In this paper, the economic impact of epidemic is predicted through the deep learning model that can model nonlinear relationships. The author predicts COVD-19 cases and economic impacts over the next year, especially by using a suitable deep learning Long–Short Term Memory (LSTM) model to handle sequence data such as time series data.
2. BACKGROUND
There is little research on the effects related to economic indicators of epidemic using deep learning algorithms. Therefore, the author separately reviewed related studies about prediction of epidemic’s economic impact and deep learning algorithms used in economic prediction.
A literature study on conventional epidemic (cold, Severe acute respiratory syndrome (SAS), COVID-19) and economic effects, as shown in Table 1, shows that studies related to the cost of vaccines based on mathematical statistical models [3–6] or to the estimate of losses for each economic part based on scenarios [7–9]. This study aims to build a prediction model as a more accurate decision support tool by using deep learning to predict economic indicators according to epidemic trends in time series.
| Authors | Journal | Areas | Epidemics | Main content |
|---|---|---|---|---|
| Molinari et al. [4] | Vaccine | USA | Influenza | The economic impact of vaccine-based interventions |
| Peasah et al. [5] | Vaccine | Global | Influenza | Influenza cost or cost-effectiveness (direct cost and indirect cost) |
| Prager et al. [6] | Risk Anal | USA | Influenza | Total economic consequences of potential influenza outbreaks (vaccination cost) |
| Liu et al. [7] | Health Econ | Asia | SARS | Estimated value of the intrinsic undesirability of nonfatal illness or of pandemic fear |
| Delivoria and Scholz [8] | European Parliamentary Research Service | Global | COVID-19 | The potential to impact several sectors of a country’s economy (rapid urbanization, ever increasing travel between countries and climate change) |
| Nicola et al. [9] | International Journal of Surgery | Global | COVID-19 | The socio-economic effects of COVID-19 on individual aspects of the world economy |
Literature reviews of epidemic’s economic impact prediction
A literature study related to forecasting economic impact using deep learning algorithms, such as Table 2, shows that predictions about stock prices or financial markets are the focus. Hall et al. [10] verified that Deep learning algorithms outperformed Autoregressive Model (DARM) or Expert Prediction Survey of Professional Forecasters (SPF) in predicting the US civilian unemployment.
| Authors | Journal | Predicted target | Deep learning algorithm |
|---|---|---|---|
| Hall et al. [10] | Federal Reserve Bank of Kansas City Working Paper | Civilian unemployment | Fully Connected, Convolutional Neural Network (CNN), LSTM, Encoder–Decoder |
| Jung et al. [11] | International Monetary Fund | GDP growth | RNN |
| Ding et al. [12] | International Conference on Artificial Intelligence | The short- and long-term influences of events on stock price movements | Combining the neural tensor network and the deep CNN |
| Pham and Park [13] | PRICAI 2014: Trends in Artificial Intelligence | Financial market prediction | Deep belief networks |
| Kuremoto et al. [14] | Neurocomputing | Financial market prediction | Deep belief networks |
| Bao et al. [15] | PloS one | Stock price | Auto-encoders (SAEs) and Long–Short Term Memory (LSTM) are combined |
| Kim and Kim [16] | KOREAN CREDIT-CARD ACADEMIC SOCIETY | Economic growth rate (GDP) | LSTM |
Literature reviews of economic impact prediction using deep learning
Deep learning algorithms such as CNN and Recurrent Neural Network (RNN) were mainly used to predict complex nonlinear relationships, especially with respect to time series forecasting. This study also predicts the impact of economic indicators on epidemic trends on deep learning LSTM models suitable for processing sequence data such as weekly confirmed cases and economic indicators.
3. METHOD
The COVID-19 economic trend prediction proposed in this paper is as shown in Figure 1. First, data collection (influenza cases, COVID-19 cases, economic indicators) and pre-processing are carried out, and a model is built to predict economic indicators related to epidemic trends and to learn the collected data. The following prediction algorithm performance verification is performed in two stages. The first verification uses 20% of the collected influenza trend data to verify the economic indicator prediction model for influenza trends, and the second verification is verified using COVID-19 actual data from January 1, 2020 to August 10, 2020 to verify the predictive performance of other infectious disease cases. The last trained model is used to make predictions of COVID-19 cases and economic trends over the next year.

Proposed method.
3.1. Data Collection and Pre-processing
In this paper, data related to influenza cases and economic indicators are collected for the development of the model of prediction of economic indicators following infectious diseases. The author collected a total of 1304 weeks of weekly data from first week of 1995 to 33th week of 2019 as shown in Table 3. First, data on influenza outbreak status were collected from Centers for Disease Control and Prevention (CDC) in file format (CSV).
| Sortation | Classification | Duration | Min | Max | Mean |
|---|---|---|---|---|---|
| Number of training data | Influenza cases | 1995.01.02–2015.12.31 | 0 | 19961 | 1021.77 |
| Inflation rate | 1995.01.02–2015.12.31 | −2.1 | 5.6 | 2.14 | |
| S&P 500 indices | 1995.01.02–2015.12.31 | 460.68 | 1841.4 | 1148.29 | |
| VIX indices | 1995.01.02–2015.12.31 | 9.14 | 79.13 | 19.72 | |
| Number of test data | Influenza cases | 2016.01.01–2019.12.31 | 33 | 13355 | 1310 |
| COVID-19 cases | 2020.01.01–2020.08.10 | 0 | 465546 | 164330.16 | |
| Inflation rate | 2016.01.01–2020.08.10 | 0.8 | 2.9 | 1.92 | |
| S&P 500 indices | 2019.12.31–2020.08.10 | 1864.78 | 3240.02 | 2555.19 | |
| VIX indices | 2019.12.31–2020.08.10 | 9.14 | 30.11 | 14.47 |
Statistical data for USA datasets used in this study
The author used the total 1096 weeks as training data for learning from first week of 1995 to 1096 weeks, which accounts for 80% of the total weekly inflector data, and the remaining is used as test data for predicting the total 209 weeks. (1097–1306 week).
In order to verify the prediction of other epidemic, the COVID-19 Cases data from January 1, 2020 to August 16, 2020 were collected by the WHO in file format (CSV) and converted to state units. The COVID-19 Cases data use the average number of confirmed cases per week.
The economic indicators used in this study are the inflation rate as an indicator of price trends, the S&P 500 as an indicator that includes stocks of 500 large US companies, and the market for the Volatility Index of the S&P 500 index options listed on the Chicago Options Exchange for the next 30 days. They are collected in the form of a file (CSV) Collects data of the same period. Monthly inflation data is generated as weekly data, and the S&P 500 index and VIX index changed daily data to average weekly data. Figure 3 shows the characteristics of the data.
3.2. Deep Learning Model for Predicting Economic Indicators regarding Epidemic
3.2.1. RNN algorithm
Recurrent neural networks are the most commonly used Neural Networks architecture for sequence prediction. Similar to Artificial Neural Networks (ANNs), RNNs are universal approximators [17]. However, unlike ANNs, the feedback loops of the recurrent cells inherently address the temporal order, as well as the temporal dependencies of the sequences [17,18].
Among the deep learning models that predict how they affect the future of the preceding past, the cyclical neural network has the advantage of being able to remember previous information to the hidden class by adding a time series concept from the general neural network. Circular neural networks are a model suitable for time series data where data time sequence relationships are important, as the concept of a time series with a circular structure is added to the inner layer to remember and study past data.
In the case of traditional Deep Neural Networks (DNN), parameters were independent for each layer, but RNN shares them. Thus, the current output results are affected by the results of the previous time step, and the hidden layer serves as a kind of memory.
Vanishing gradient problem has the problem that while updating the weights of networks, the gradient disappears as the gradient continues to multiply less than one, thus causing the distant past state to have no effect on current learning.
3.2.2. LSTM algorithm
Long short-term memory cell was introduced by Hochreiter and Schmidhuber [19]. Compared to the basic RNN cell, the LSTM cell has two components to its state: the hidden state, and the internal cell state [20]. The hidden state corresponds to the STM component, and the cell state corresponds to the LTM [20,21].
Long–short term memory is a special kind of circular neural network structure that can learn the proposed long-term dependence to overcome the problem of slope disappearing [22]. To overcome the problem of disappearing slopes, the LSTM structure replaces common nerves in the circulatory neural network with LSTM cells with small internal memory. These LSTM cells relate to a common circulatory neural network, helping to remember multiple levels of error in the cell’s internal condition.
In Figure 2, the LSTM cell consists of the following gates to maintain its status. The output value is adjusted using the input gate, the forgetting gate, and the output gate. The input gate determines how much input value is accepted, the oblivion gate determines how much the state inside the previous cell will be forgotten, and the output gate will determine how much output. It is a structure that forgets how much cell status values and determines how much new input values will be accepted. Even if this process is repeated, the slope does not expire, and the learning becomes impossible. LSTM calculates the final output value through the number of hidden sides in the same way as the standard circulation neural network, but in the process of calculating the number of variables in the hidden layer, gateways are appropriately used to control the flow of information. As a result, the circulatory neural network using LSTM cells handles even the data in a long sequence of procedures without causing slope loss. In this study, LSTM is used as a model to predict economic indicators following epidemic.
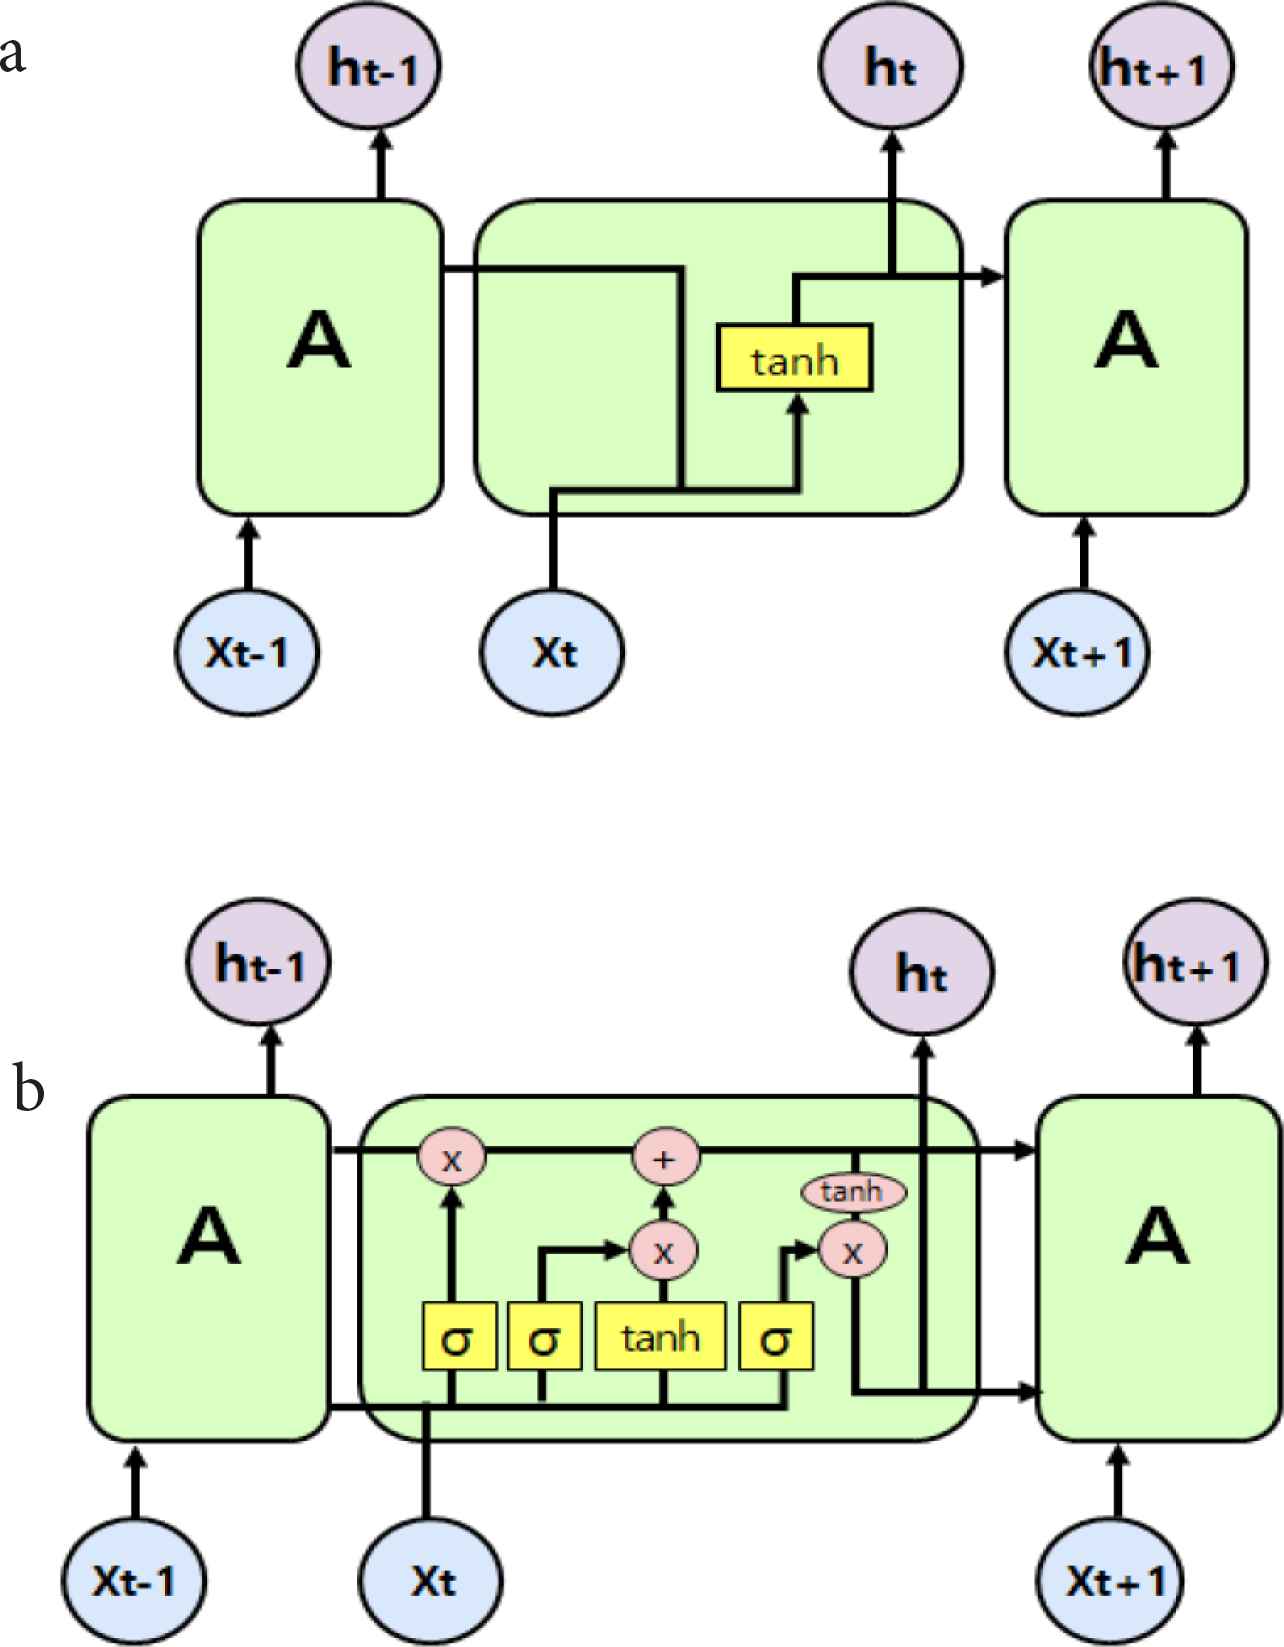
Deep learning algorithm used this study (a) recurrent neural network (b) Long–short-term memory recurrent neural network.
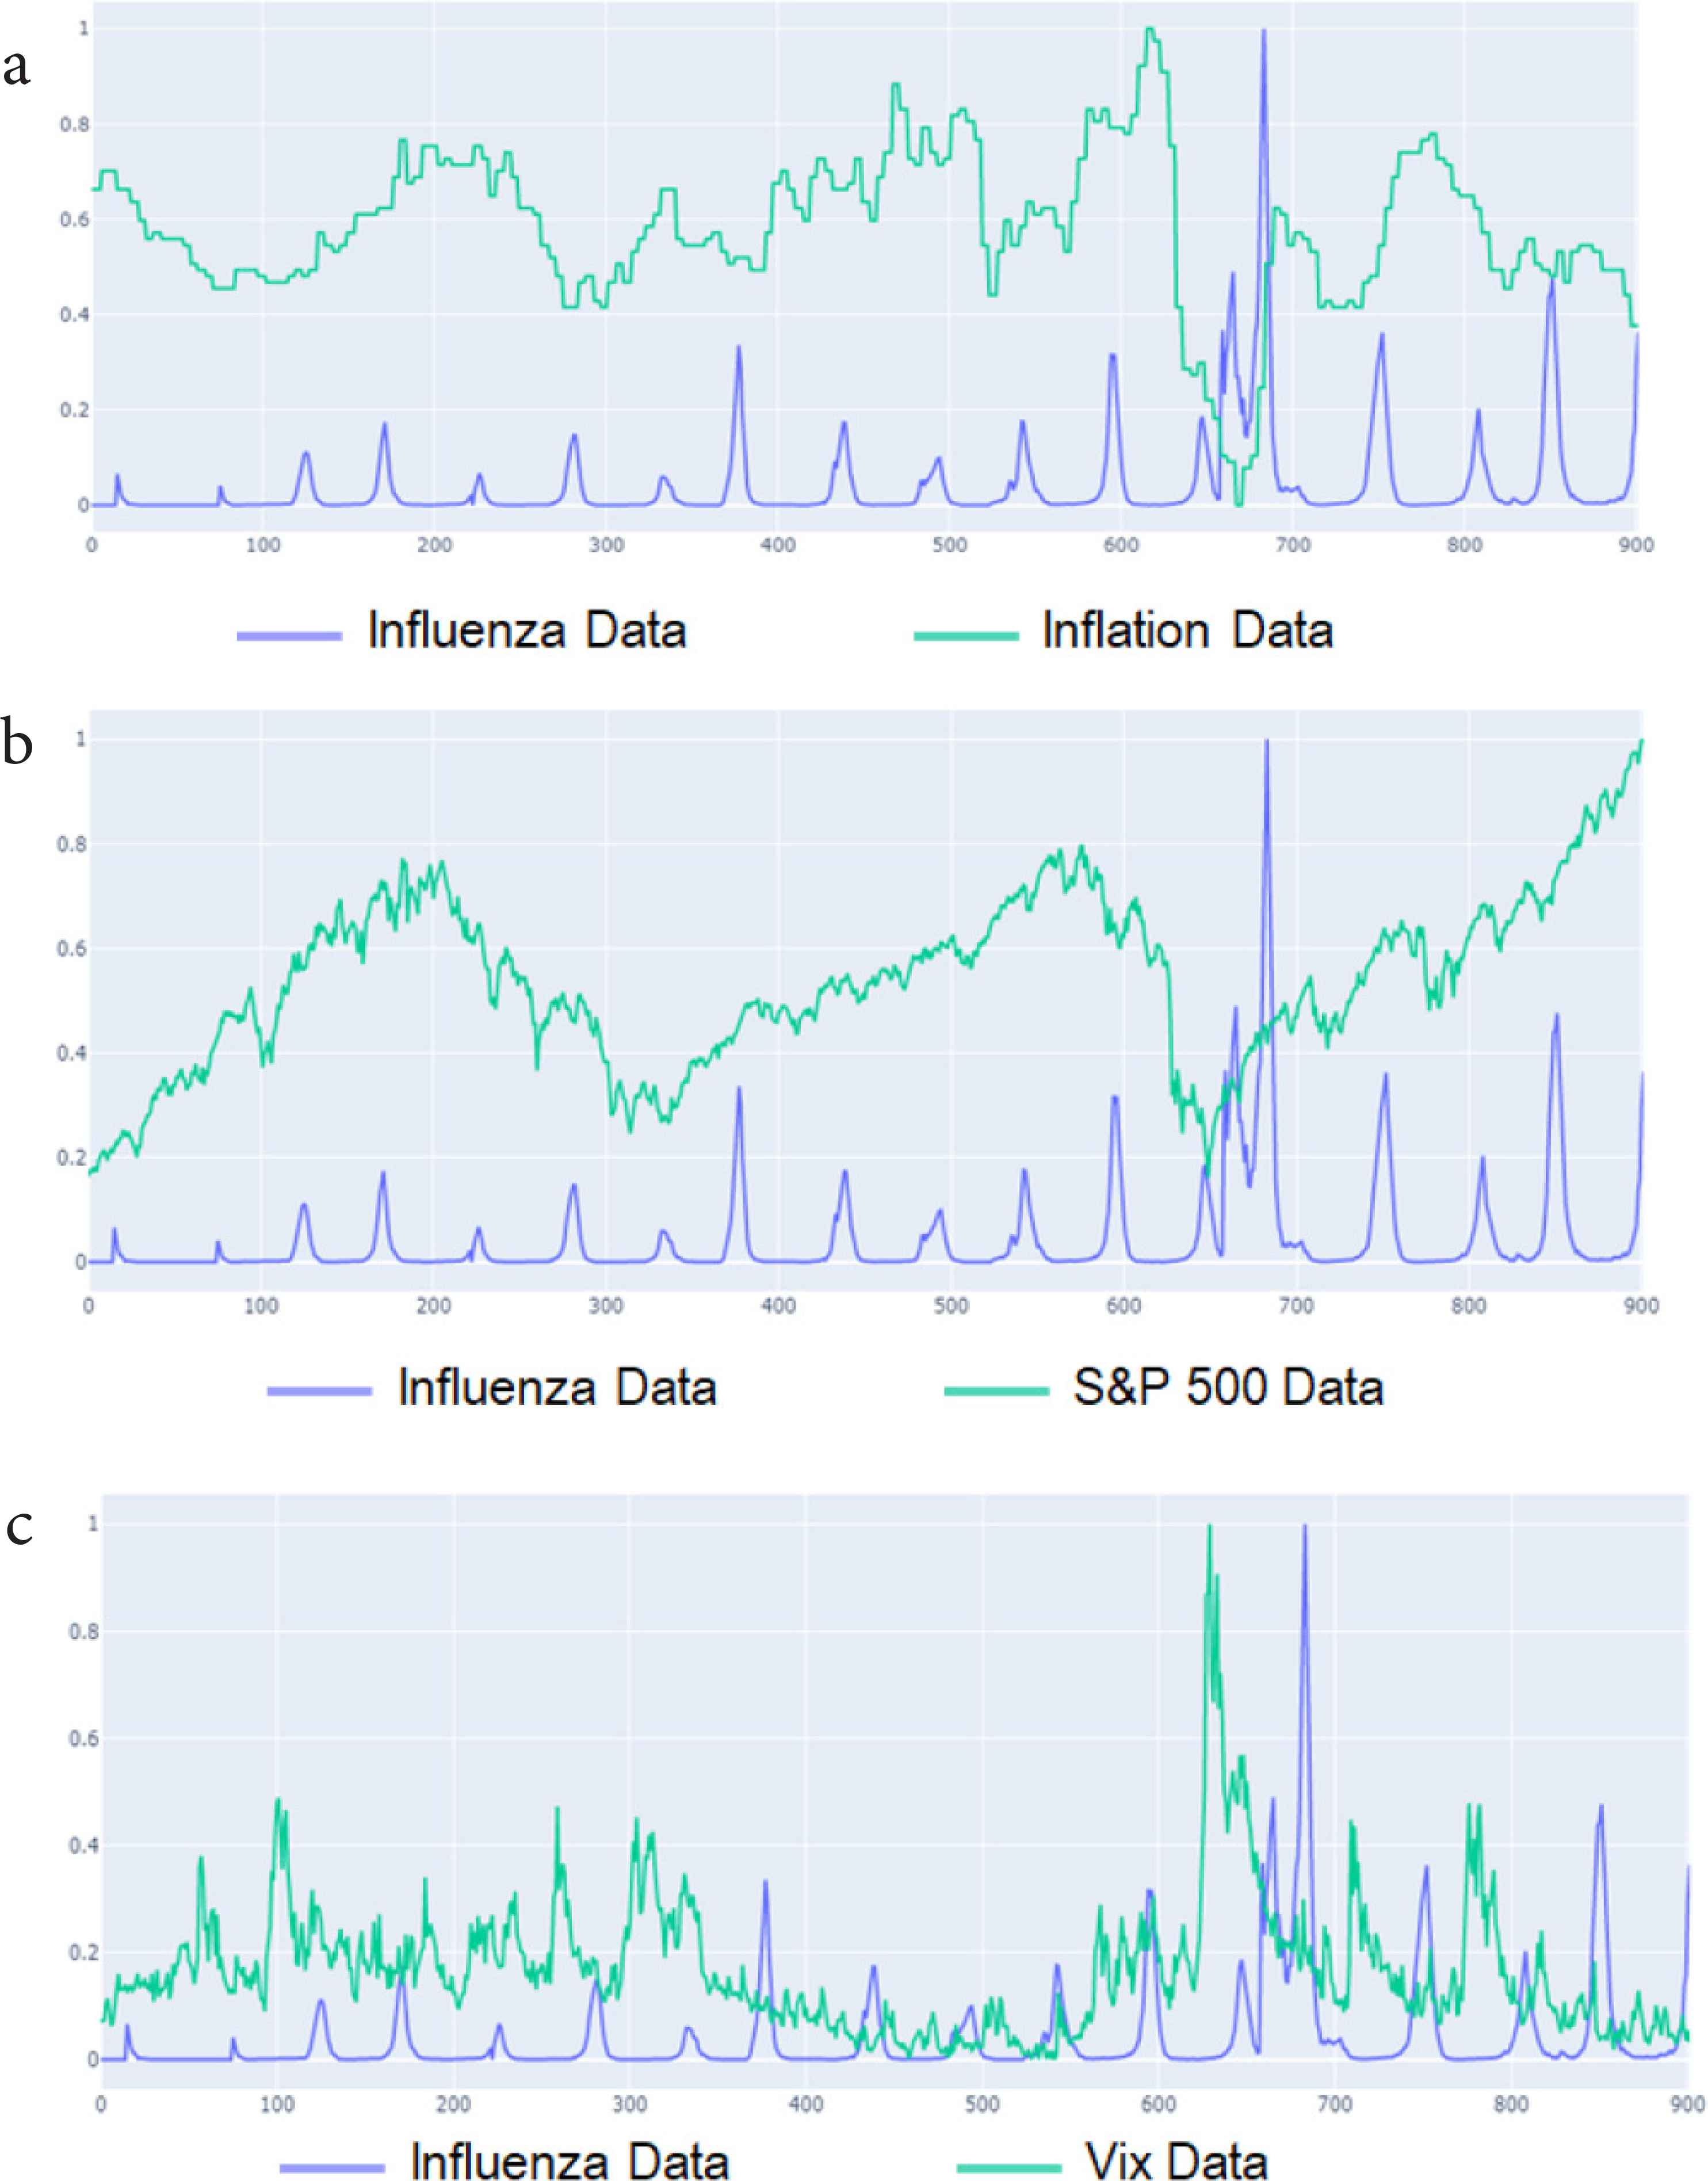
Key characteristics of dataset (a) Inflation trend. (b) S&P 500 trend. (c) VIX trend.
3.3. Performance Evaluation Criteria I – Mean Square Root Error
The Root Mean Square Error (RMSE) has been used as a standard statistical metric to measure model performance in meteorology, air quality, and climate research studies [23].
The mean square root error is a commonly used measure of the difference between the estimated value or the value predicted by the model and the value observed in the actual environment. When the data set with the actual value is A and the data set of the predicted values is B, the blew equation represents the mean square root error. The error of the pairs of elements in each set is obtained and then squared to determine the exact difference, averaging the overall error. And because this value can grow, the square root of that value is obtained. This is called the RMSE.
3.4. Performance Evaluation Criteria II – Pearson Correlation Coefficient
Pearson correlation is a numerical representation of the correlation between two consecutive variables. This approach allows us to determine whether the two variables have linear or nonlinear correlation with each of each other [24].
P(A, B) has the same expression for datasets A and B as the blew equation and shows correlation with the increase or decrease of pairs of each element. If each element shows a trend in the same direction, it means there is a quantitative correlation and the opposite direction means a negative correlation. P(A, B) means having a value between −1 and 1, and having no correlation between −0.1 and 0.1.
4. PERFORMANCE EVALUATION OF ECONOMIC INDICATORS IN RELATION TO THE TREND OF EPIDEMIC DISEASES
In this experiment, the Learning Rate was set to 0.01 in Tensor flow v.2.2 and 500 repetitive learning was performed. Table 4 shows the performance evaluation of economic indicators related to epidemic trends, with RMSE averaging the minimum value of Pearson correlation. As a result, the inflation rate showed a correlation of 0.77 between the forecast and the actual value, with a minimum RMSE value of 0.00003. In contrast, the S&P 500 and VIX indices showed a low correlation or correlation between forecast and actual values, indicating that this model was not suitable for predicting stock indices affected by various variables. The data trend can be seen in Figures 4–6
| Model | Economic indicators | Minimum RMSE | Correlation coefficient |
|---|---|---|---|
| Influenza | Inflation rate | 3.14835252818119e-05 | 0.776 |
| S&P 500 index | 0.08153034352600565 | −0.224 | |
| VIX index | 0.0004094831251936502 | 0.214 | |
| COVID-19 | Inflation rate | 3.613089354638002e-05 | 0.791 |
| S&P 500 index | 0.11546297194493421 | 0.358 | |
| VIX index | 0.000441256834722085 | −0.447 |
Performance evaluation of economic indicators in relation to the trend of epidemic diseases
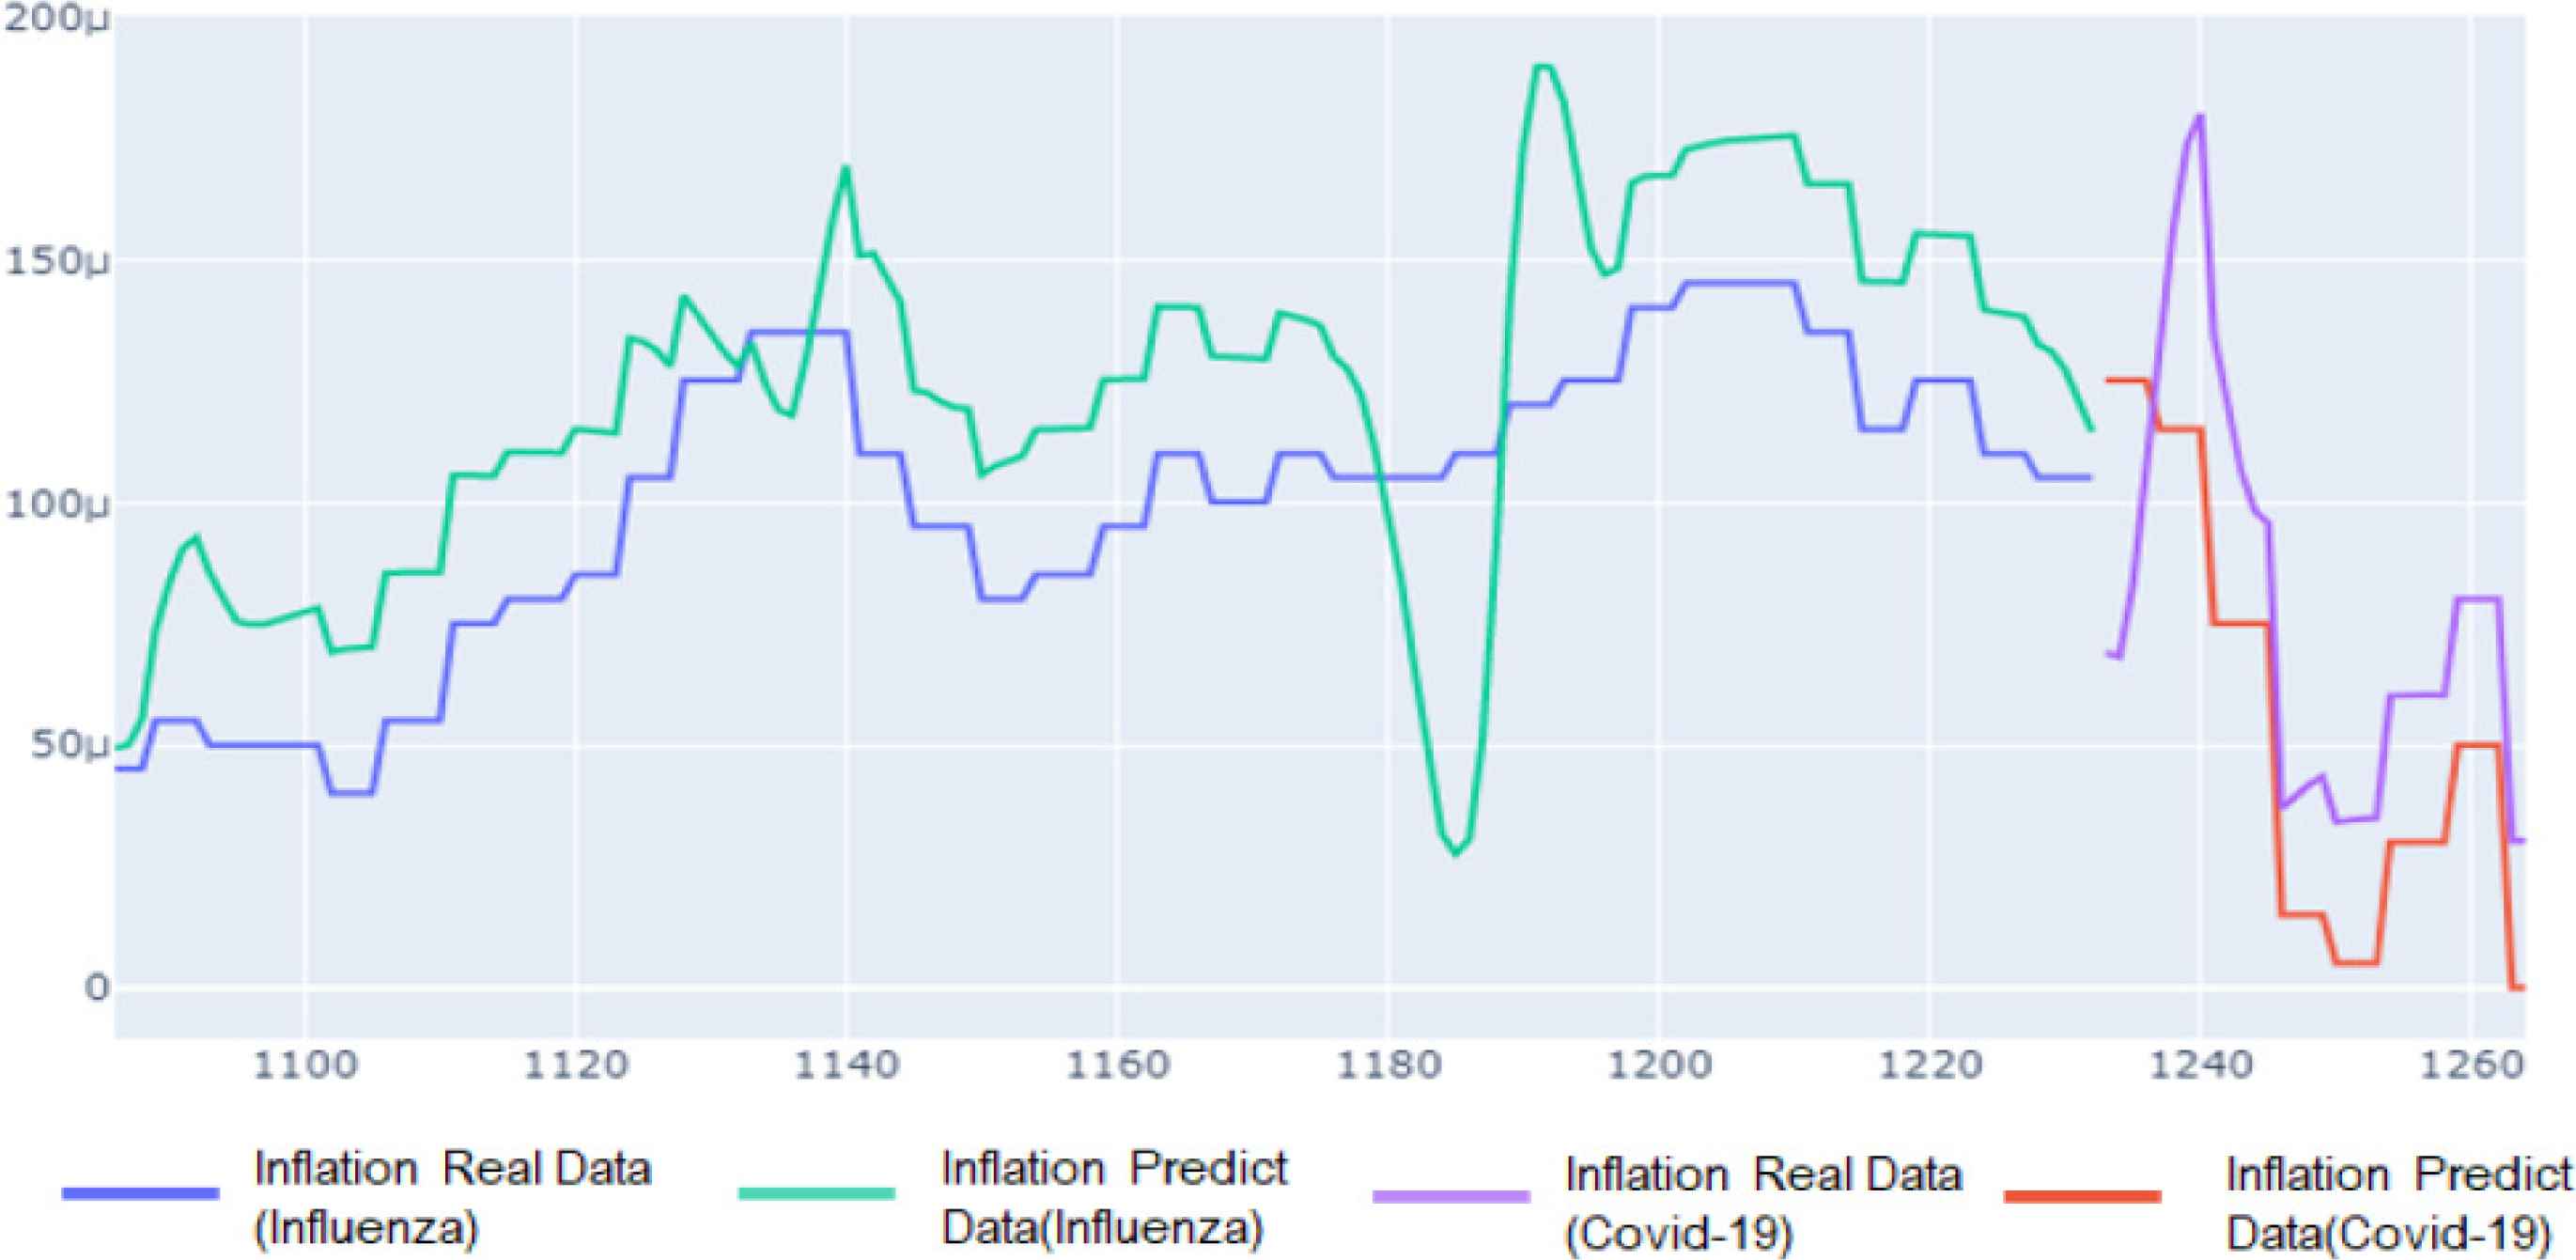
Comparison of inflation rate forecasts with actual value in relation to epidemic trends (Influenza: Left/COVID-19: Right).
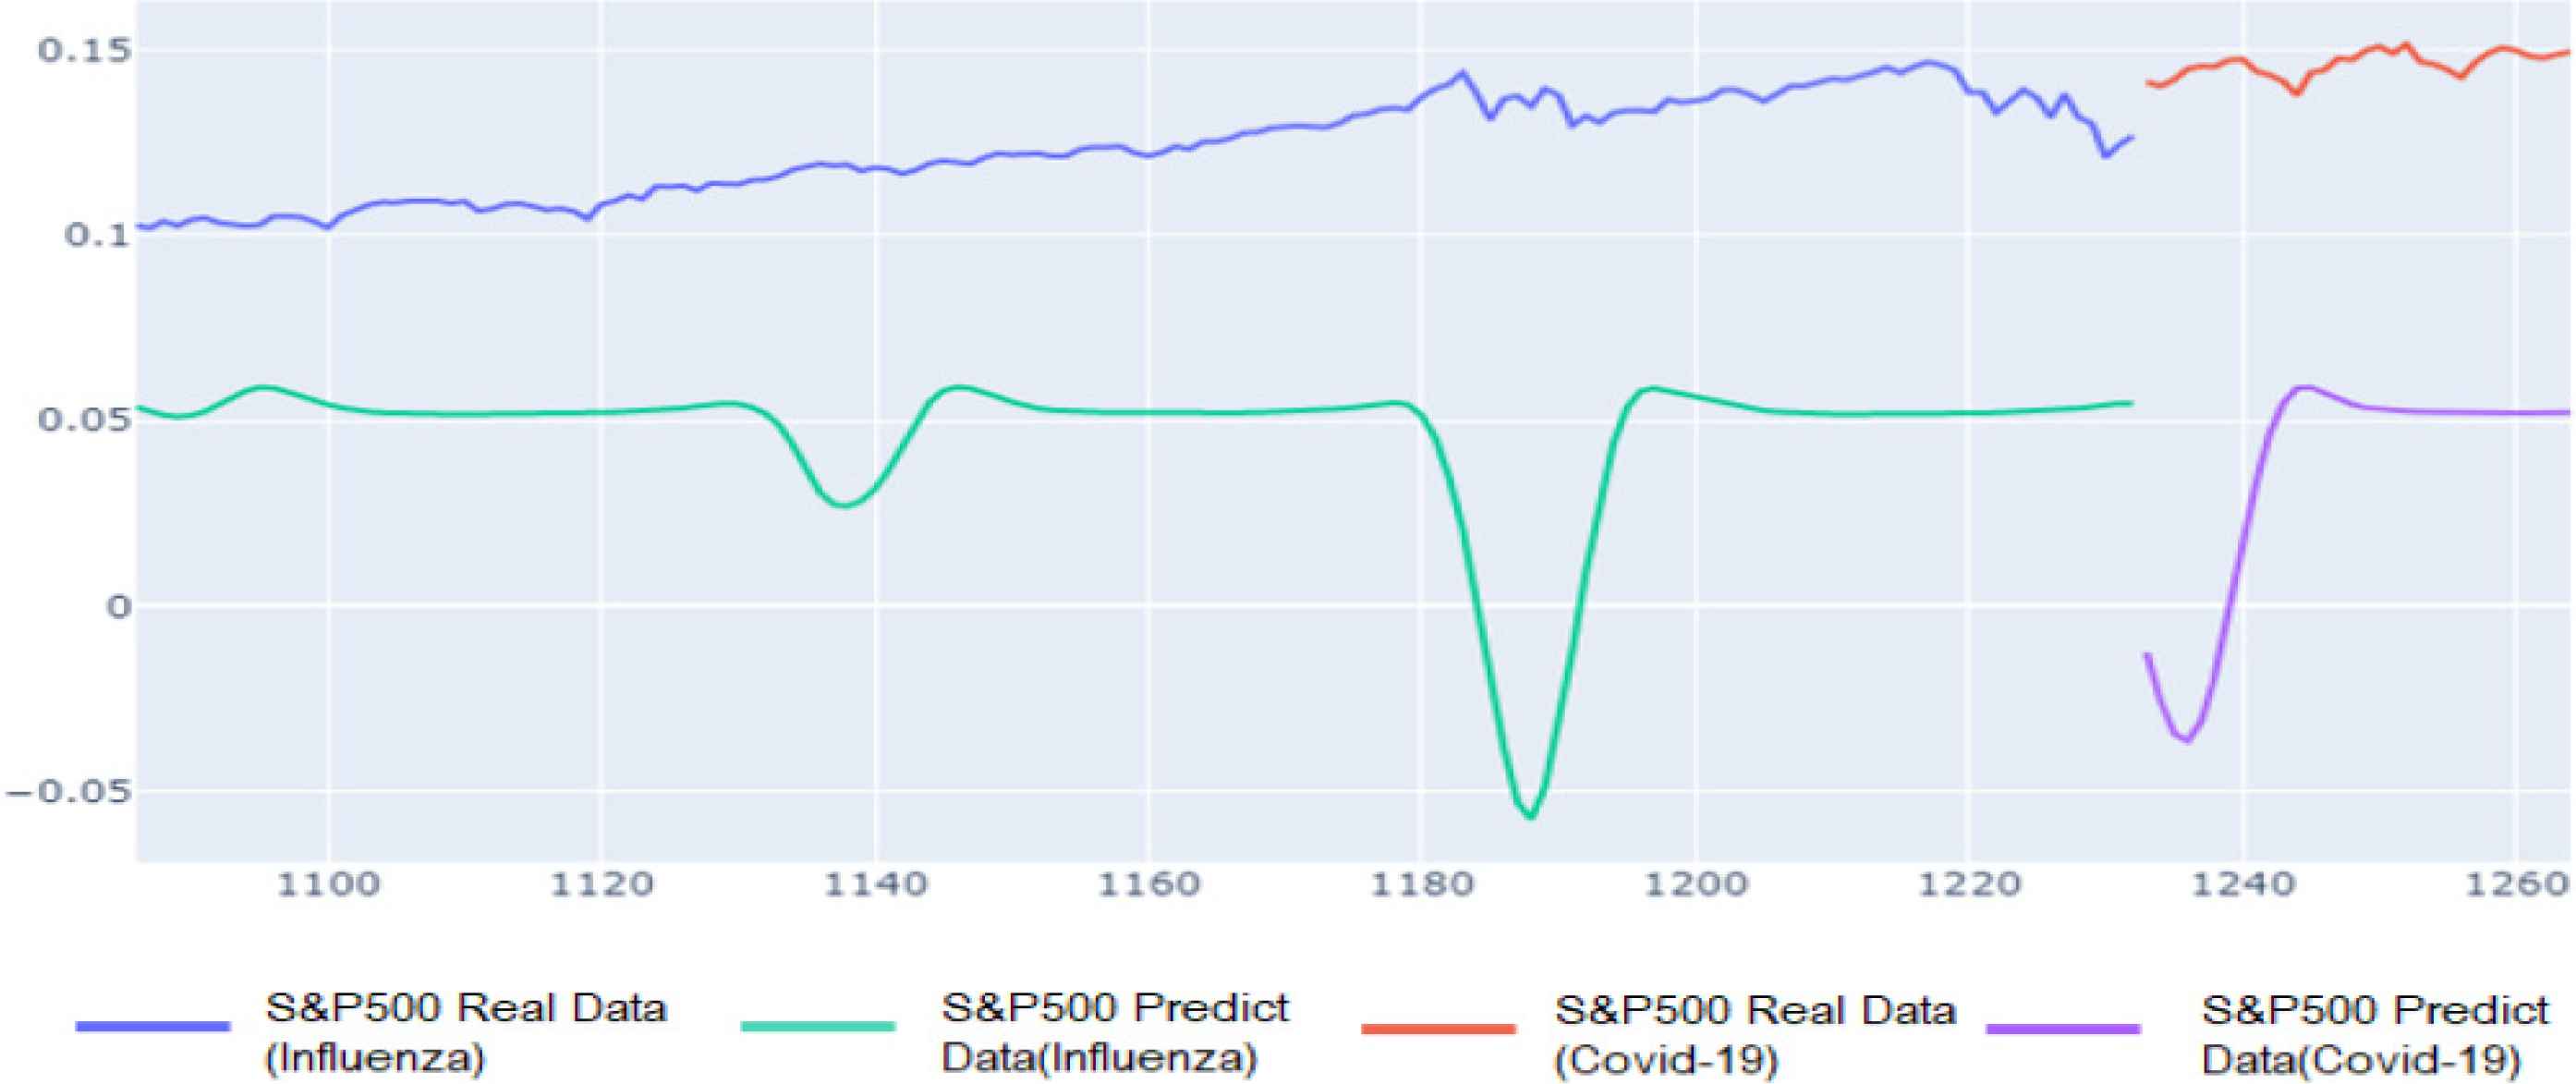
Comparison of S&P 500 Index forecasts and actual values related to epidemic trends (Influenza: Left/COVID-19: Right).
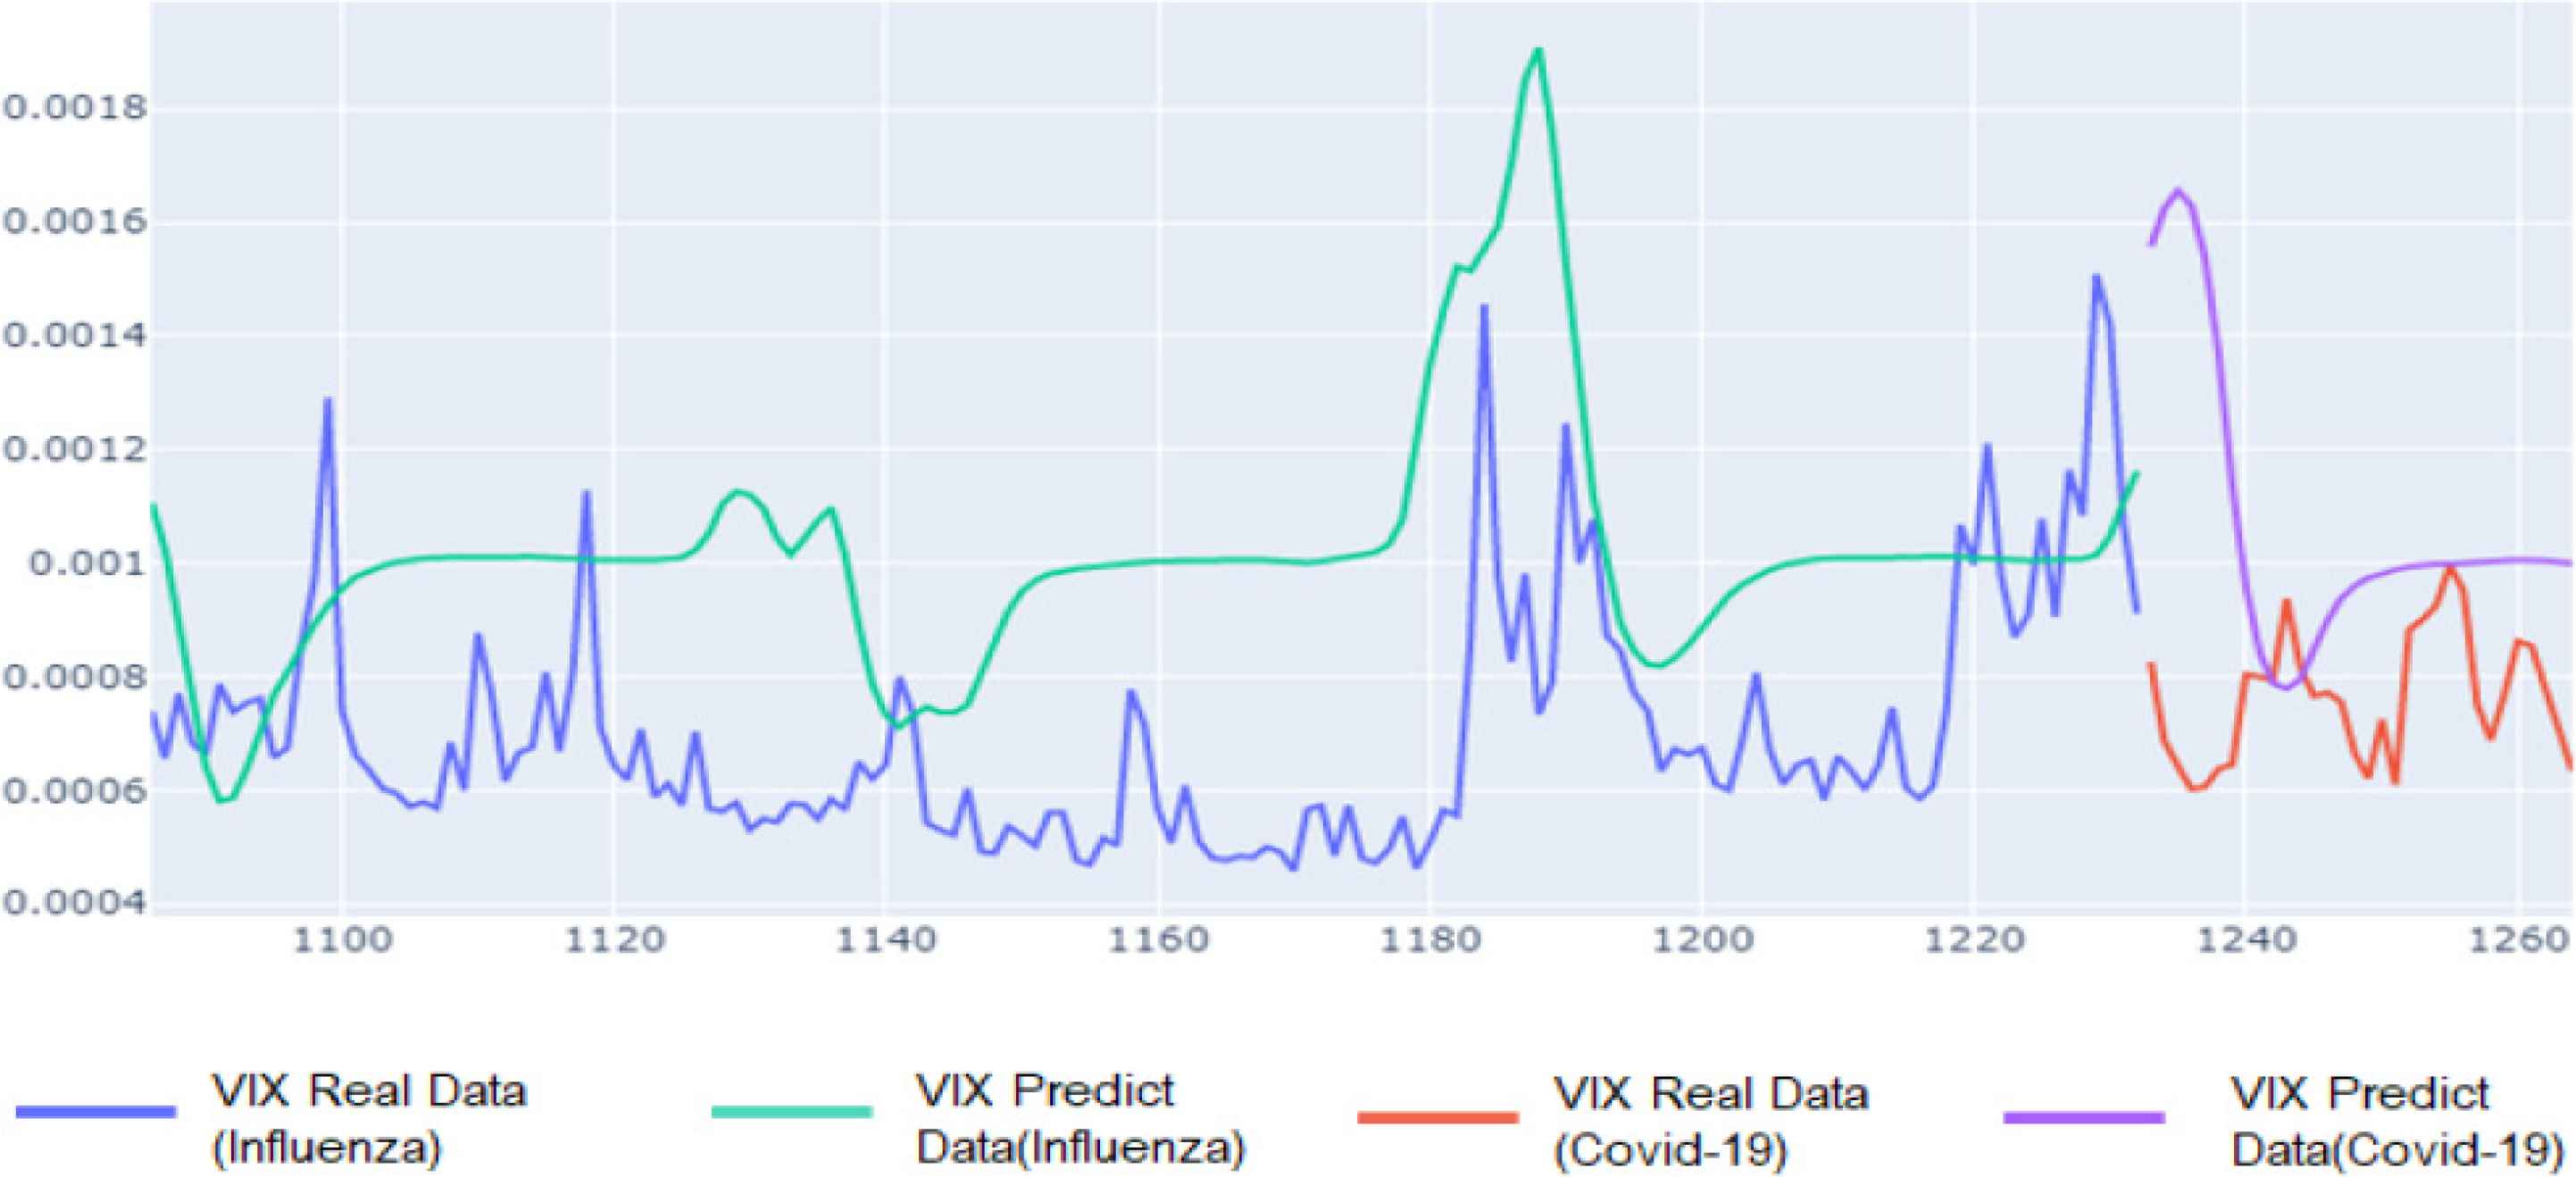
Comparison of VIX index forecasts and actual values related to epidemic trends (Influenza: Left/COVID-19: Right).
And the predicted value and the actual value were compared, and as a result, the difference between the predicted value of the inflation rate and the measured value showed a correlation of 0.79, and the minimum RMSE value was 0.00003.
5. TRAINING AND VERIFICATION
The authors predict in Table 5, Figure 7 the changes in COVID-19 trends and economic indicators for next year in the time series for inflation rates, which are highly correlated with this experiment.
| Quarter | Inflation rate |
|---|---|
| 2020 Q3 | 0.353 |
| 2020 Q4 | 0.599 |
| 2021 Q1 | −0.027 |
| 2022 Q2 | 0.696 |
Average quarterly inflation rate based on COVID-19 trends over the next 1 year
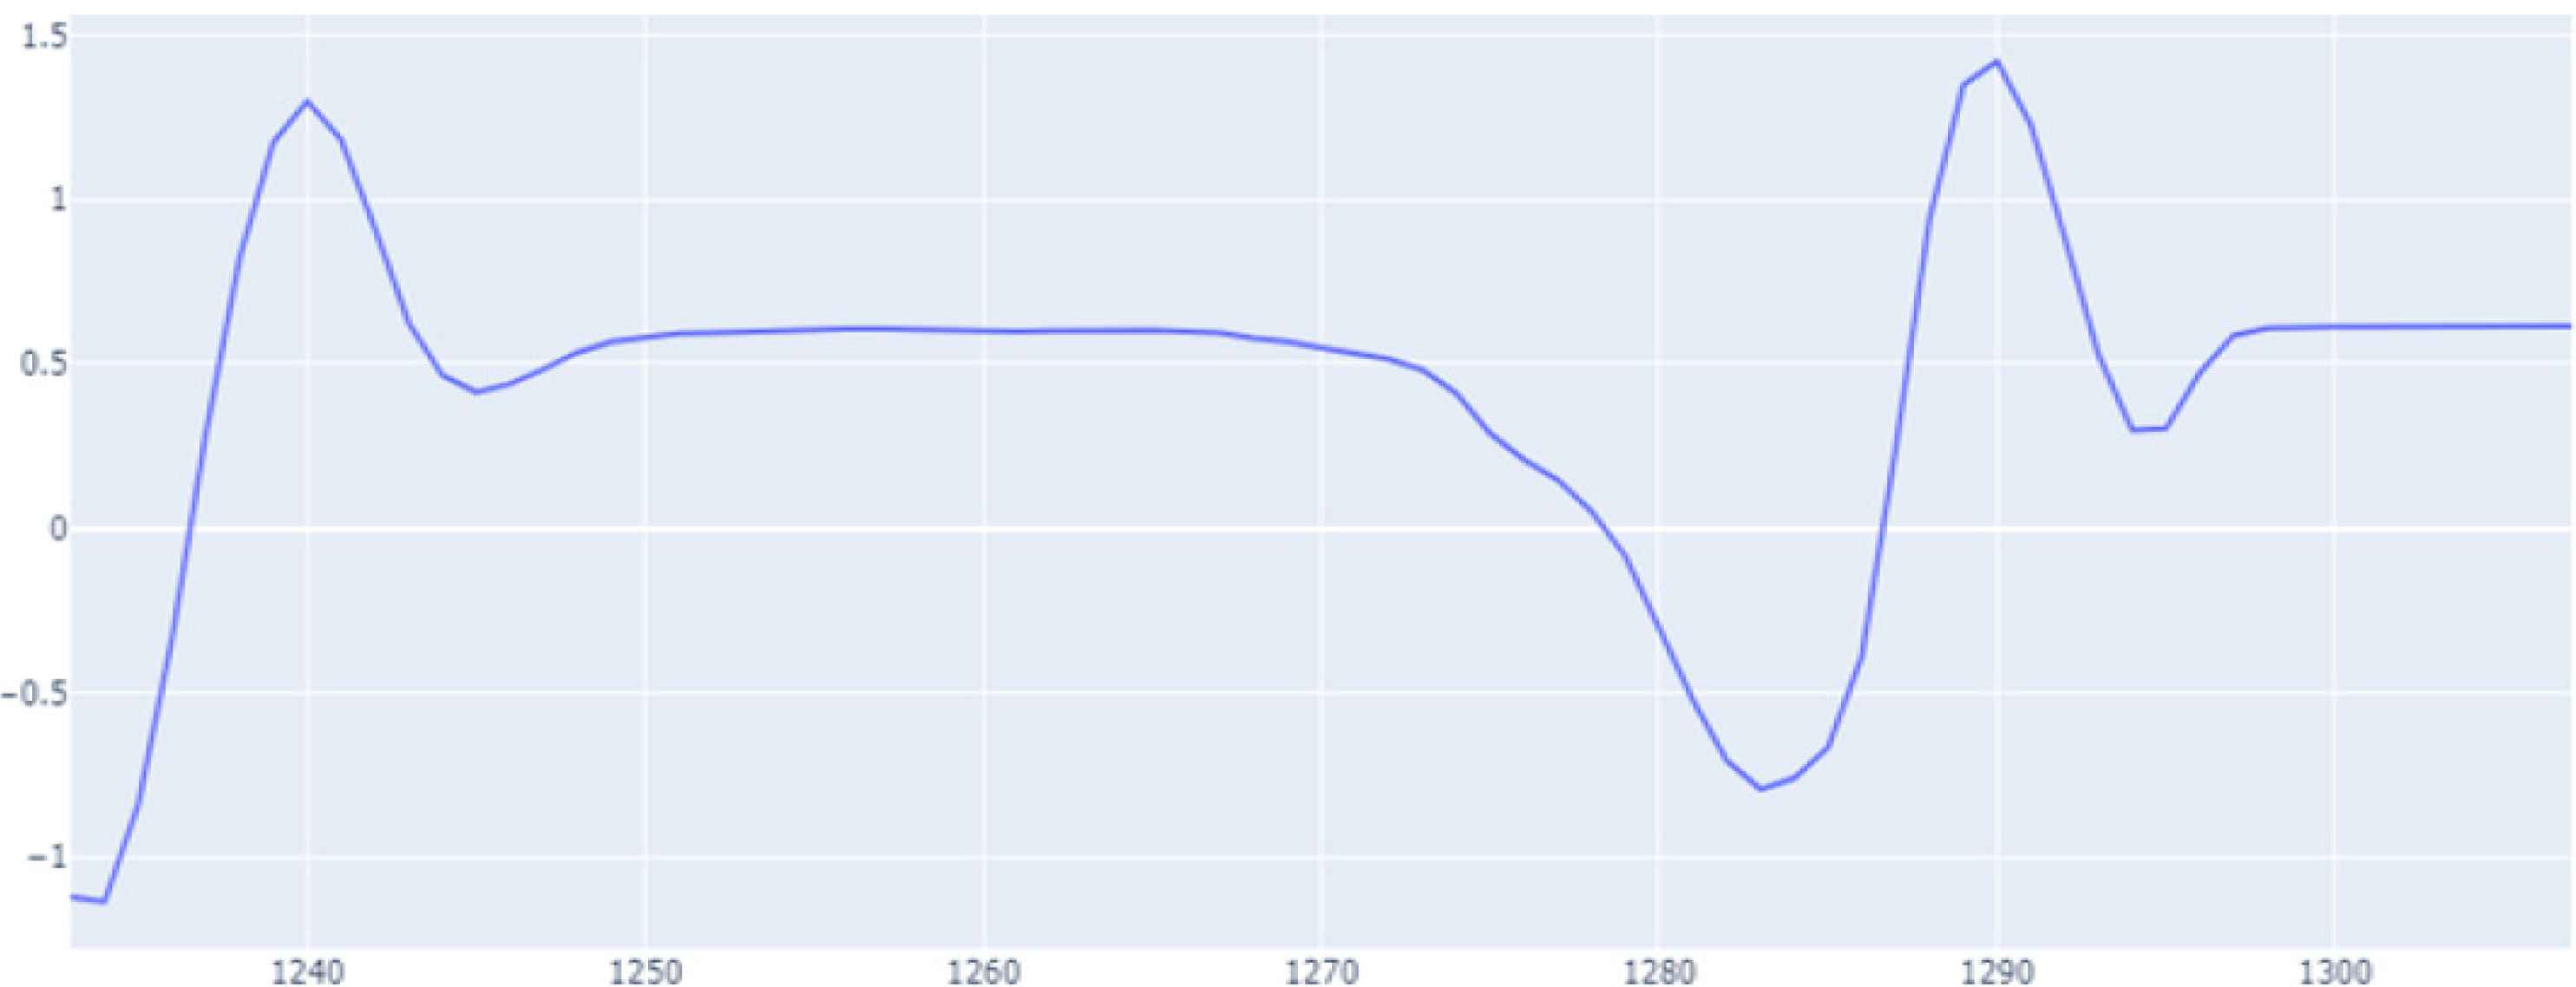
Inflation rate estimation graphs based on COVID-19 trends over the next 1 year.
This predicted value is meaningful as the first predicted value of economic indicators using deep learning. However, as it is currently difficult to determine when the spread of COVID-19 will slow down, it is necessary to improve the accuracy of the predicted values through several studies in the future.
6. CONCLUSION
This study proposed a model for applying deep learning on how to predict the economic impact of epidemic trends. This model was developed using LSTM algorithms that show high performance in time series forecasts, and performance results showed good performance in the inflation rate describing the price index. However, it did not in the S&P 500 and VIX indices, which represent the stock index. This indicates that it is not appropriate to predict a stock price index with too many variables.
In addition, this study predicted the inflation rate according to the COVID-19 case for the next one year for the inflation rate with high explanatory power in the proposed model, which can be used as an empirical reference for preemptive decision-making in future economic policy establishment.
The proposed method is almost the only model for predicting economic impact based on epidemic cases using deep learning. However, there is a threshold for not predicting various economic indicators.
In future studies, it is thought that a more suitable model for COVID-19 can be developed if the epidemic data is classified and predicted by the eight influenza types classified by the CDC.
In addition, if the economic forecast indicators are classified according to the existing economic scenario [2] and predicted using deep learning, it will be a model that can support preemptive decision-making with a more accurate prediction model.
CONFLICTS OF INTEREST
The authors declare they have no conflicts of interest.
REFERENCES
Cite this article
TY  - JOUR
AU  - Myung Hwa Kim
AU  - Ju Hyung Kim
AU  - Kyoungjin Lee
AU  - Gwang-Yong Gim
PY  - 2021
DA  - 2021/01/05
TI  - The Prediction of COVID-19 Using LSTM Algorithms
JO  - International Journal of Networked and Distributed Computing
SP  - 19
EP  - 24
VL  - 9
IS  - 1
SN  - 2211-7946
UR  - https://doi.org/10.2991/ijndc.k.201218.003
DO  - 10.2991/ijndc.k.201218.003
ID  - Kim2021
ER  -