
An Empirical Study on Darknet Visualization Based on Topological Data Analysis
- DOI
- 10.2991/ijndc.k.201231.001How to use a DOI?
- Keywords
- Darknet monitoring; topological data analysis; clustering; visualization
- Abstract
We are experiencing the true dawn of an Internet of Things society, in which all things are connected to the Internet. While this enables us to receive a wide variety of useful services via the Internet, we cannot ignore the fact that this means the number of devices targeted for Internet attacks has also increased. One known method for handling such issues is the utilization of a darknet monitoring system, which urgently provides information on attack trends occurring on the Internet. This system monitors and analyzes malicious packets in the unused IP address space and provides security related information to both network administrators and ordinary users. In this paper, Topological Data Analysis (TDA) Mapper is utilized to analyze malicious packets on the darknet, which grow increasingly complexity every day from a new perspective. TDA Mapper is a method of TDA that has continued to attract attention in recent years. In an evaluation experiment, by applying TDA to malicious packets monitored using the actual darknet, the malicious packets were able to be visualized. In this study, the author considers the overall image of the visualized malicious packets and examples extracted from the relationships among packets and reports on the effectiveness of the proposed method.
- Copyright
- © 2021 The Authors. Published by Atlantis Press B.V.
- Open Access
- This is an open access article distributed under the CC BY-NC 4.0 license (http://creativecommons.org/licenses/by-nc/4.0/).
1. INTRODUCTION
We are experiencing the true dawn of an Internet of Things (IoT) society, in which all things are connected to the Internet. For example, it is not unusual for ordinary users without any particular knowledge to operate their tablet while they are away from the house and control the electrical appliances in their house via the Internet. Despite the convenience this provides, we cannot ignore the problem of the increase in devices that are the target of attacks via the Internet [1].
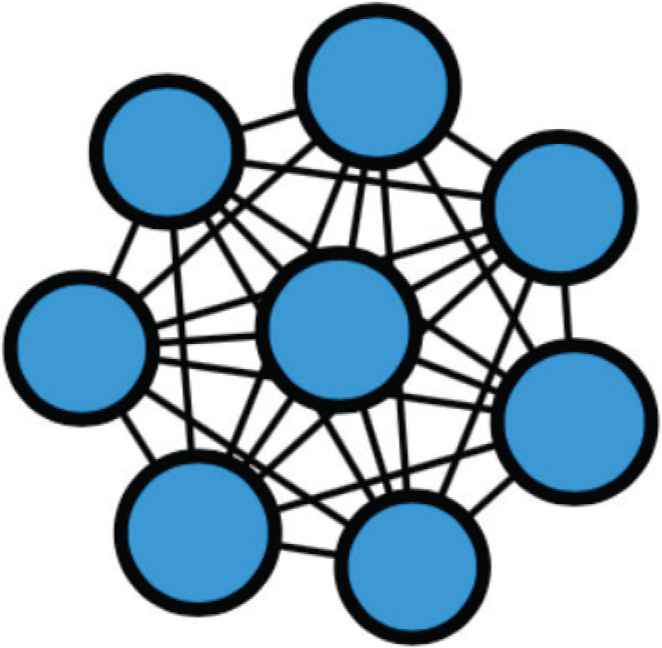
According to an Internet Initiative Japan and Symantec reports [2,3], many serious incidents are still occurring on the Internet, such as Distributed Denial of Service (DDoS) attacks, and the malicious spreading of information using software vulnerabilities [4]. We can easily imagine that attacks occurring on the Internet will continue to increase in complexity and scale moving forward. It is effective to use a darknet monitoring system to acquire an understanding of attack trends occurring on the Internet at an early stage (Figure 1). The darknet monitoring system places a packet capturer device in an IP address space (darknet), to which, though unused, packets can arrive on the Internet. This is a system that is able to grasp the latest attack trends spreading on the Internet by monitoring and analyzing arriving malicious packets.
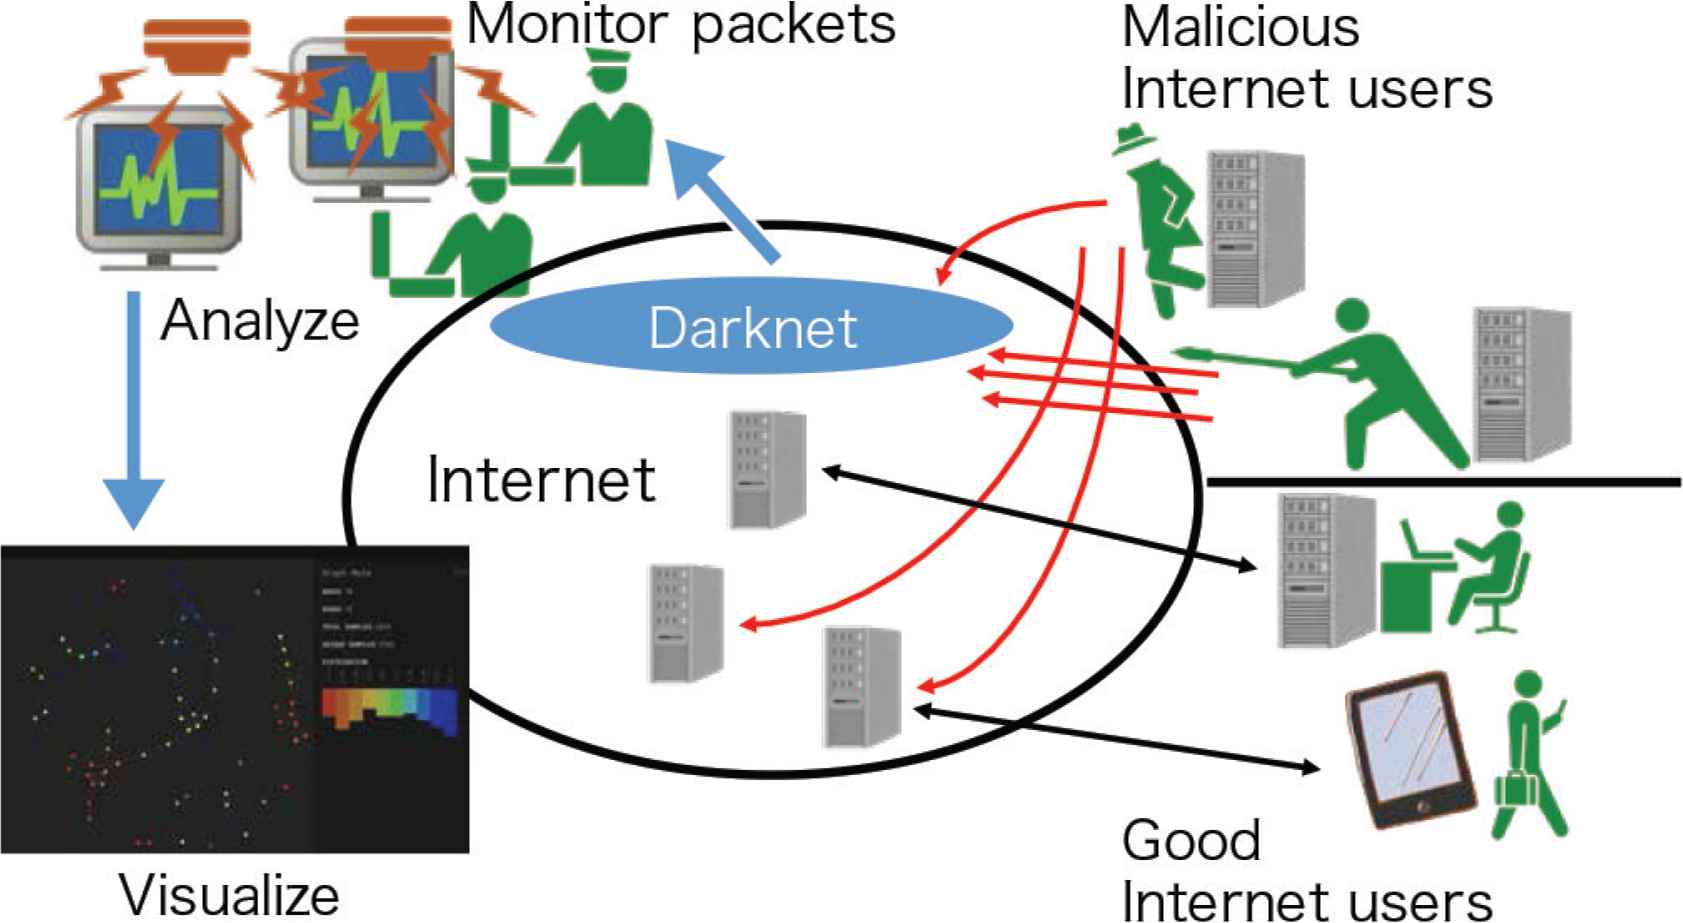
Overview of darknet monitoring system.
Part of the information obtained from the system is often disclosed to network administrators and ordinary users, and this contributes to the provision of security countermeasure information. In this paper, the author considers a visualization method that can analyze malicious packets, which are expected to increase in complexity moving forward from a new perspective. More specifically, based on the concept of topology, the author proposes a visualization method for malicious packets that uses Topological Data Analysis (TDA) Mapper, which is one method of TDA. TDA was originally a method proposed for the purpose of extracting topological features, such as relationships among data, and patterns, from the analyzed data. The purpose of this study is to develop a method that can visualize an overview of attack trends and extract the relationships among malicious packets and patterns by applying TDA to darknet monitoring packets.
In the evaluation experiment, by applying TDA to malicious packets monitored using the actual darknet provided by Japan Computer Emergency Response Team/Coordination Center (JPCERT/CC), an analysis of malicious packets was conducted. The author shall demonstrate examples of how overview of attack trends were visulalized and relationships among malicious packets extracted by analyzing the actual darknet monitoring packets with TDA, and report on the effectiveness of the proposed method.
2. RELATED WORKS
Darknet monitoring systems are being operated around the world to grasp attack trends on the Internet at an early stage [5].
In Japan, the National Institute of Information and Communi-cations Technology (NICT) is constructing the largest system. The darknet monitoring system nicter [6], operated by NICT, is said to monitor malicious packets in a range of approximately 300 K IP addresses. Additionally, this institution continues to develop a cyber-attack detection method, operating the anti-cyber-attack alert system DAEDALUS [7], which uses nicter.
There is a long history of network packet visualization research, which has a wide range of uses beyond security with various methods. An example of the visualization research related to security in recent years is the study by Fan et al. [8]. While applying methods of machine learning to packets to be analyzed, they have constructed a security information visualization system, focusing on its real-time properties.
The first study to apply TDA for darknet monitoring packets was the study by Coudriau et al. [9]. Coudriau et al. attempted to use TDA to analyze monitoring packets from several incidents that actually occurred in the past. However, this study is limited to suggesting the level of performance of TDA in categorizing attacks.
In previous studies by the author’s research team, there was analysis of darknet monitoring packets using TDA [10]. In this study, we create a feature vector that focuses on the sender IP address considered to be the attacker source, and performs visualization using TDA. However, it does not reach the stage of giving a reasonable interpretation of the output results.
In this paper, visualization of the raw packet data that contains many packets that were observed as noise on the darknet is visualized using TDA. Assuming implementation to a darknet monitoring system available to the public, the author shows the effectiveness of the proposed method by showing examples of visualizing attacks on a timeline and extracting relationships among malicious packets.
3. TOPOLOGICAL DATA ANALYSIS
Topological data analysis is a method of extracting unalterable topological features from complex high-dimensional data. By using this method, it is possible to extract features and patterns among the analyzed data.
Modern topology is said to have been established in the latter half of the 19th century. However, it is difficult to state that computer-based applied research has been sufficient thus far. According to Umeda (Fujitsu Laboratory), with the arrival of the age of Big Data and the increase in data accumulated by IoT devices, momentum aimed at developing a new data analysis method is increasing, and this demonstrates the effectiveness of TDA, which focuses on the data format [11].
Details related to the theoretical aspects of TDA and application examples executed on a computer are given in the studies by Singh et al. [12] and the study by Carlsson [13]. Singh et al. applied TDA to high-dimensional data and established the analysis method known as TDA Mapper, in which the analysis results are drawn in a two-dimensional format. Figure 2 is an example in which two types of diabetes discovered using statistical methods in the 1970s can be easily classified using TDA Mapper.
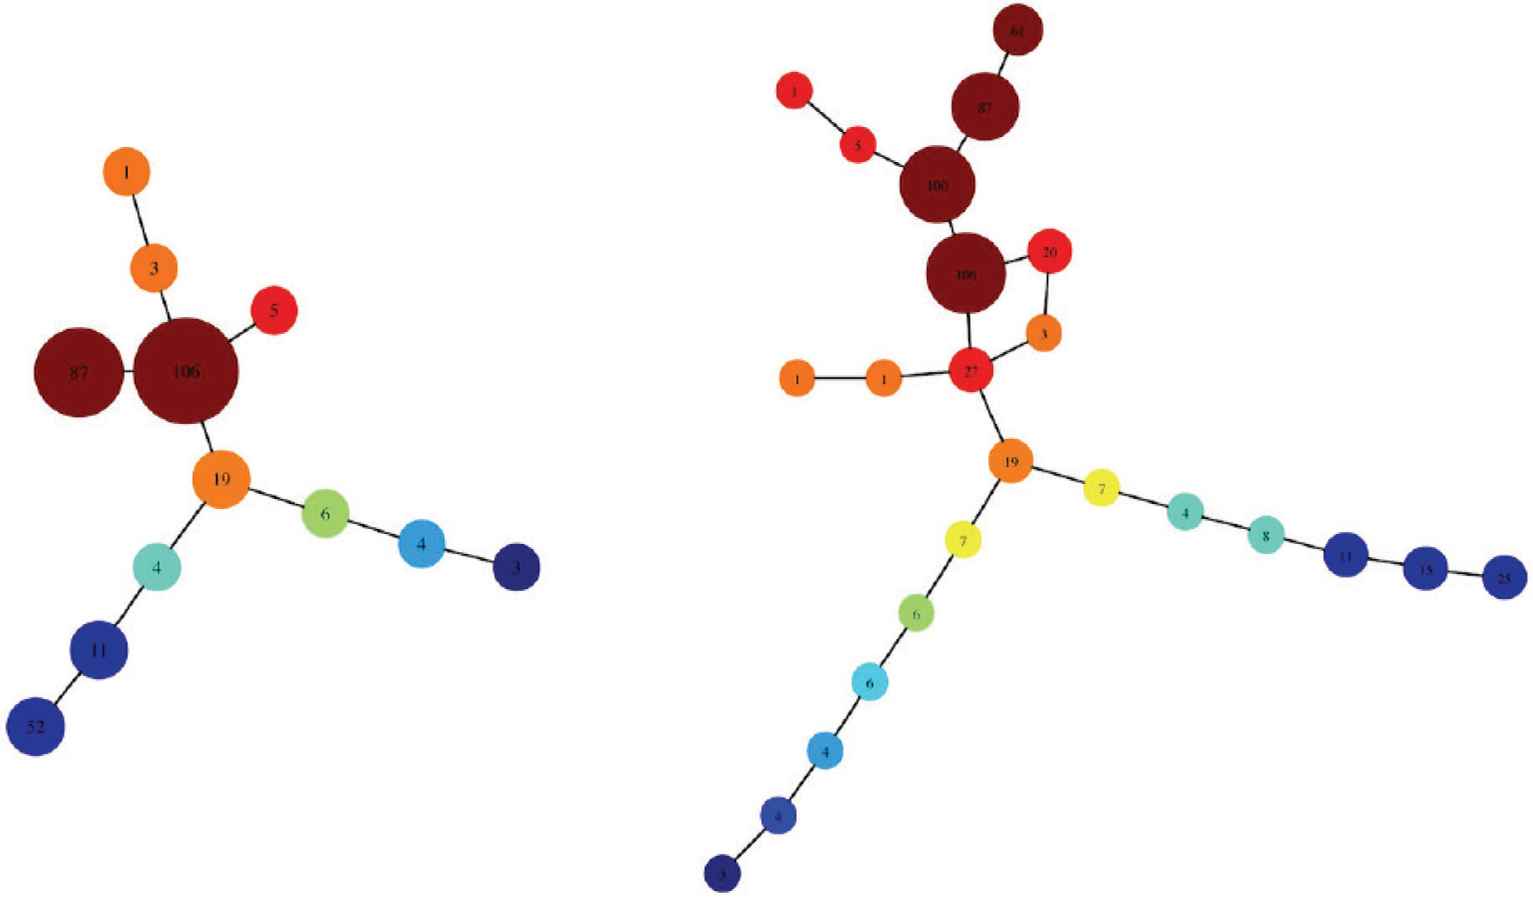
Example of successfully classifying adult diabetes and juvenile diabetes using Topological Data Analysis (TDA) Mapper (reprinted from Figure 5 in Ref. [12]). The visualization in figure on left has a low resolution while the one on the right has a high resolution. From both figures, it can be seen that the lower section has branched in two.
As TDA is an analysis method that is not limited by the properties of the analyzed data, it is considered to be effective in analysis for dealing with security incidents. In this paper, TDA Mapper is used to visualize malicious packets on the darknet. In the next section, while providing an outline of the procedure for the series of processes comprising TDA Mapper, a method of applying TDA Mapper to darknet monitoring packets will be proposed, assuming the deployment of a darknet monitoring system available to the public.
4. PROPOSAL FOR A METHOD OF APPLYING TOPOLOGICAL DATA ANALYSIS TO DARKNET MONITORING PACKETS
In this section, a method of applying TDA Mapper to darknet monitoring packets will be proposed.
When applying TDA Mapper, it is necessary to select a clustering algorithm for pre-processing and using the input data in advance. Following that, TDA Mapper carries out the three processes of
- (1)
Processing for splitting the multiple subsets of input data as a hypercube,
- (2)
Clustering processing within the subset, and
- (3)
Phase graph output (visualization) processing.
To implement this method, Python libraries, such as scikit-learn and KeplerMapper [14], were utilized. Next, the TDA Mapper application method will be described.
4.1. Pre-processing of Input Data
First, the feature vector comprising the input data will be defined. Here, filtering processing or two-dimensional reduction would normally be performed as necessary. In this paper, the five properties shown in Table 1 are used, from the packet header, as feature values.
| Timestamp | Integer value (UNIX time) |
| Source IP address | Integer value (32-bit) |
| Source port number | Integer value (16-bit) |
| Destination port number | Integer value (16-bit) |
| Protocol number | Integer value (8-bit) |
Feature values of monitoring packets
In other words, the individual monitoring packets are regarded as five-dimensional vector data with the five attributes shown in Table 1. Normally, adding information on the destination IP address to vector elements is thought to provide a higher possibility of gaining useful output results. However, with this method, information regarding the destination IP address is excluded.
This is because information concerning IP addresses in a darknet monitoring system is generally information that should be kept concealed. If the existence of the darknet monitoring system were exposed to the attacker, the reliability of the monitoring results would be lost [15–18]. In the proposed method, as it assumes deployment in a darknet monitoring system available to the public, the IP address of the monitoring system is not included in the input data subject for analysis.
In addition, as there is a major disparity between the numbers that can be used in the various elements of the input vectors, standardization is performed so that it has an average of 0, variance of 1, and only a section of the elements are not too greatly reflected in the output results.
4.2. Selection of the Clustering Algorithm
DBSCAN [19] was adopted as the clustering algorithm used in the processing procedure (2). There are two reasons for this, as follows.
First, with DBSCAN, there is no requirement to clearly specify the number of clusters in advance. As it is difficult to predict what kind of attacks will occur during the analyzed timeframe, it is not a good policy to determine the number of clusters in advance.
Another reason is that it is a method that is robust to outliers. In case TDA Mapper is used in the field of abnormality detection, it is considered that even if there are outliers, they should not be easily excluded. This is because they could be the origin point for a new attack.
4.3. Data Visualization Flow by TDA Mapper
- (1)
Split processing of input data
When visualizing using TDA Mapper, it is necessary to set two parameters. These are intervals to set the data split intervals, and overlap to set the overlap ratio for the intervals. The resolution of the output graph is changed based on the above parameters. By following the above parameters, the input data is split into multiple overlapping subsets as a hypercube (five dimensions in this method).
- (2)
Clustering
Clustering is performed using DBSCAN in relation to the split data included in individual hypercubes. The parameters required for DBSCAN are ε and minPts. With DBSCAN, if the neighboring data ε, has minPts or more than distance of, the data is classified as the same cluster.
- (3)
Visualization
Phase graph visualized in two-dimensions or more is outputted. Figure 3 is an example of outputting a phase graph generated using this method. The nodes on the graph represent clusters generated by individual hypercubes. At this time, if the same data is shared between nodes of different hypercubes, there is thought to exist a relationship between the nodes, and an edge expressing a consolidated relationship between the nodes is drawn.
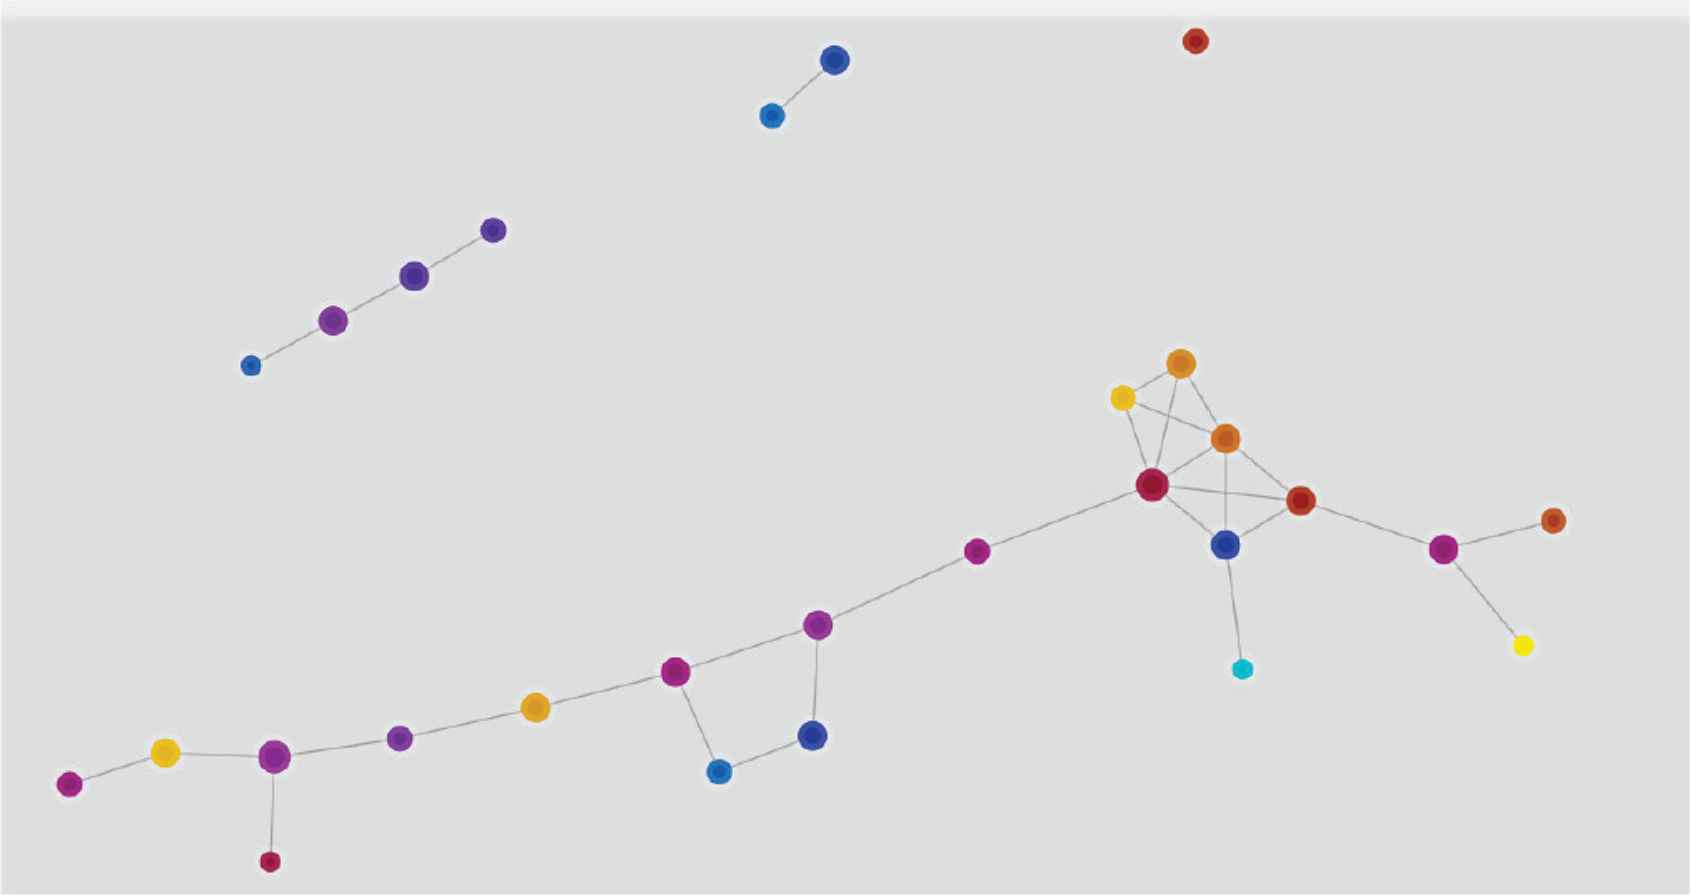
Output example of a phase graph in which darknet monitoring packets are analyzed using Topological Data Analysis (TDA) Mapper.
5. EVALUATION EXPERIMENT
This section shows the results of the evaluation experiment, in which the method of analysis described in the previous section was applied to actual darknet monitoring packet data.
5.1. Experiment Objectives
Proposed method is a new visualization tool that can be provided to darknet monitoring system users. Therefore, the author evaluated the effectiveness of the method from following two perspectives.
First, there is the macro perspective on phase graph output using TDA Mapper. The author focused on the number of output nodes and number of edges, and evaluated the effectiveness based on this information.
Next, there is the micro perspective on the output phase graph. By investigating packets constituting nodes and edges, the experiment extracted knowledge about the relationship among malicious packets. Two case studies are shown in this paper.
5.2. Experimental Method
The darknet monitoring packets used in this paper comprise data acquired from the Internet regular inspection monitoring system TSUBAME [20] operated by JPCERT/CC.
For the evaluation, approximately 60 K packets monitored from 0:00 on November 1st, 3rd, and 5th, 2017 were used. For the analysis program in which TDA Mapper was implemented, the output results were analyzed by inputting 10 K packets at a time based on a time series, and comparing the phase graph output based on the proposed method with the original data set.
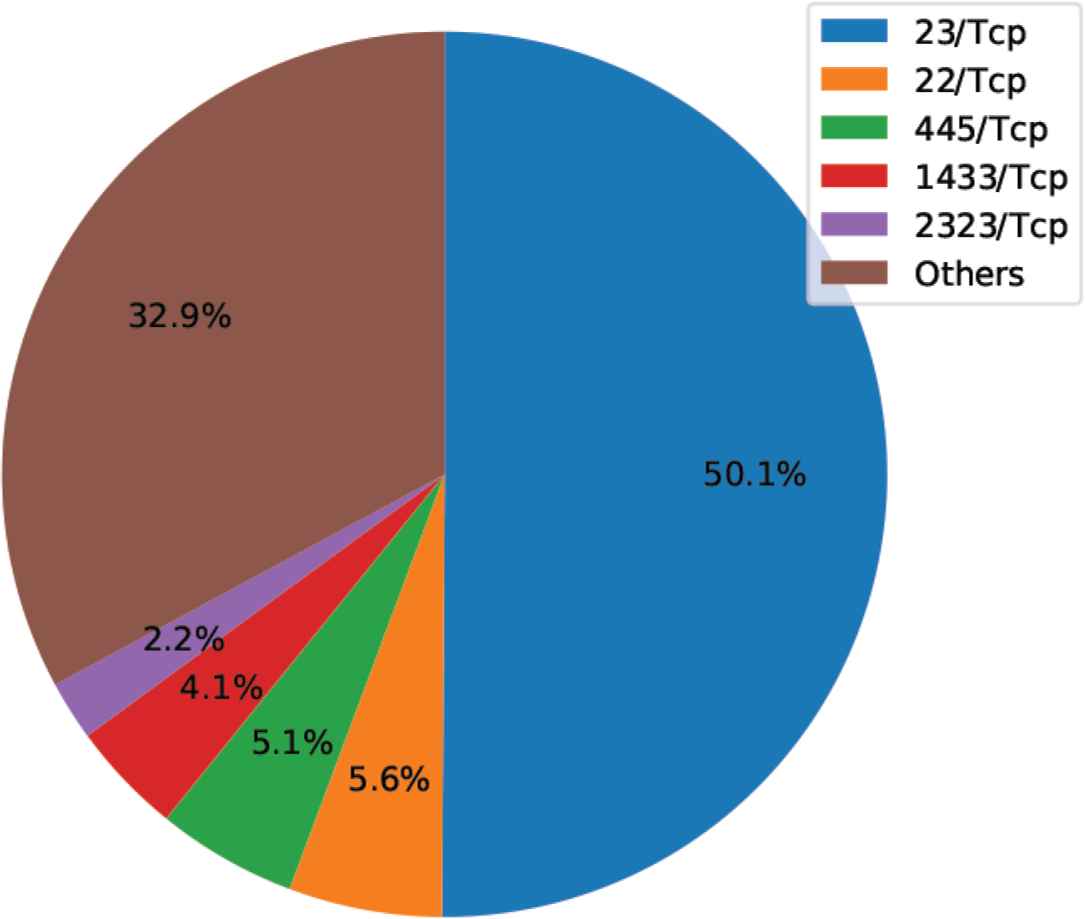
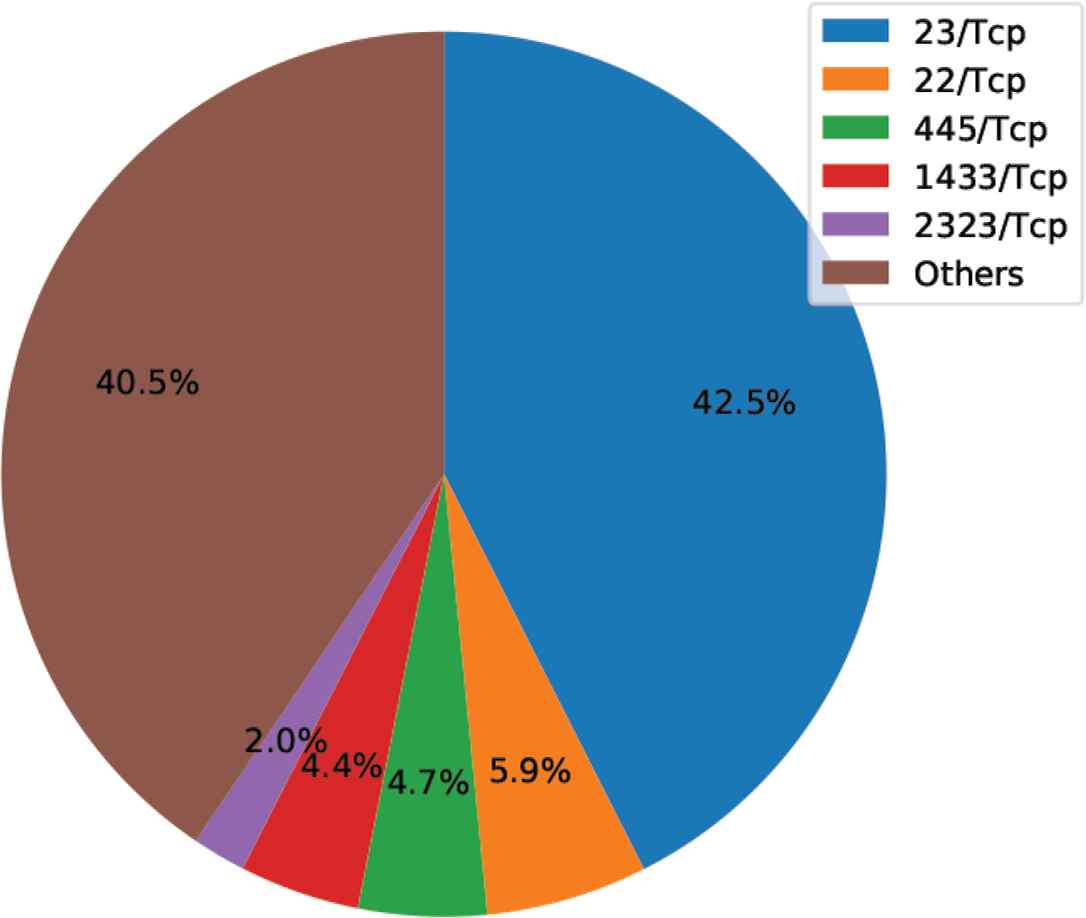
Figures 4–6 show the ratio of destination port numbers/protocols for the period used in the experiment as a pie chart. We can see that for both port numbers/protocols making up a large number, attacks have occurred consecutively in recent years and that attack trends occurred in virtually the same 3-day period.
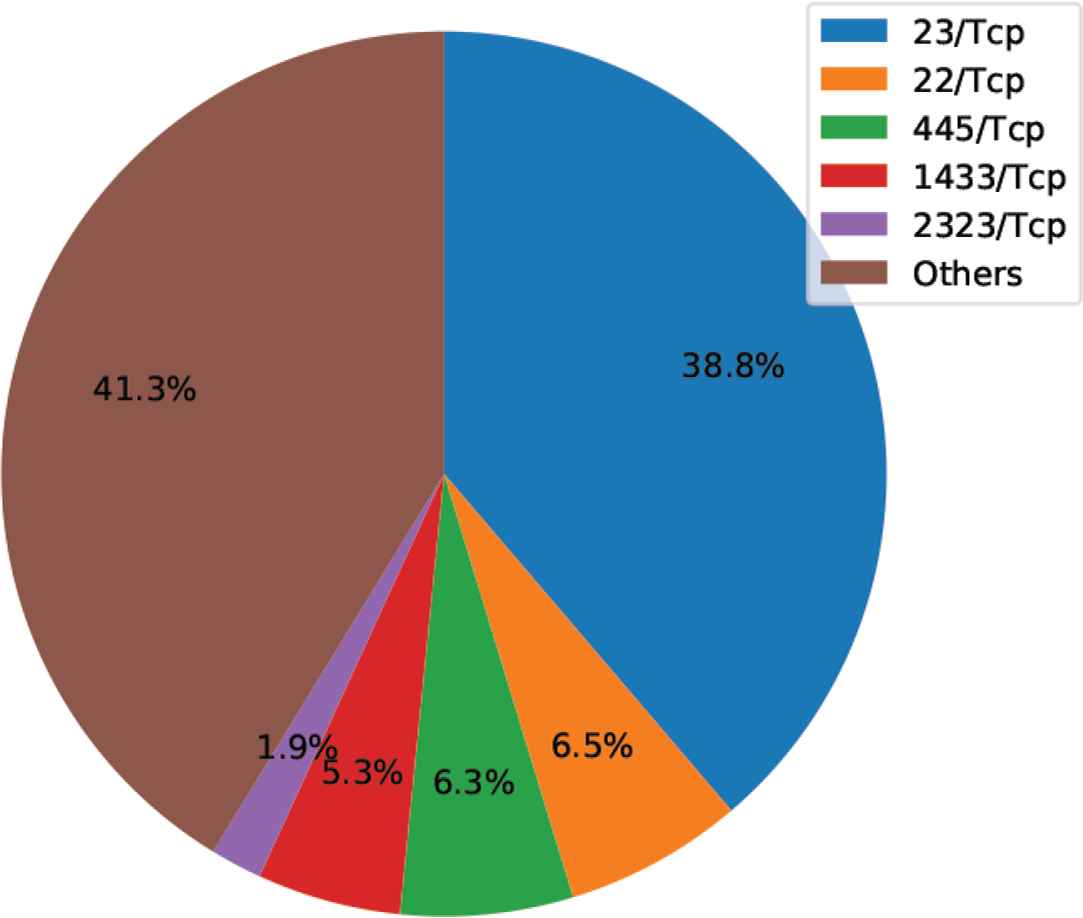
Ratio of destination port numbers/protocols in monitoring data (11/1/2017).
Ratio of destination port numbers/protocols in monitoring data (11/3/2017).
Ratio of destination port numbers/protocols in monitoring data (11/5/2017).
5.3. Experimental Parameters
As described in the previous section, it is necessary to set a total of four parameters with this method. These are intervals for setting the input data split intervals, overlap for setting the overlap ratio of the split data, the distance threshold ε for classifying in the same cluster in DBSCAN, and minPts as the minimum number of data points for generating a cluster. The parameter settings on this occasion are standardized as the settings shown in Table 2, based on the results of the study by Coudriau et al. [9] and the preliminary tests.
| intervals | 10 |
| overlap | 0.1 (10%) |
| ε | 0.3 |
| minPts | 20 |
Experimental parameters
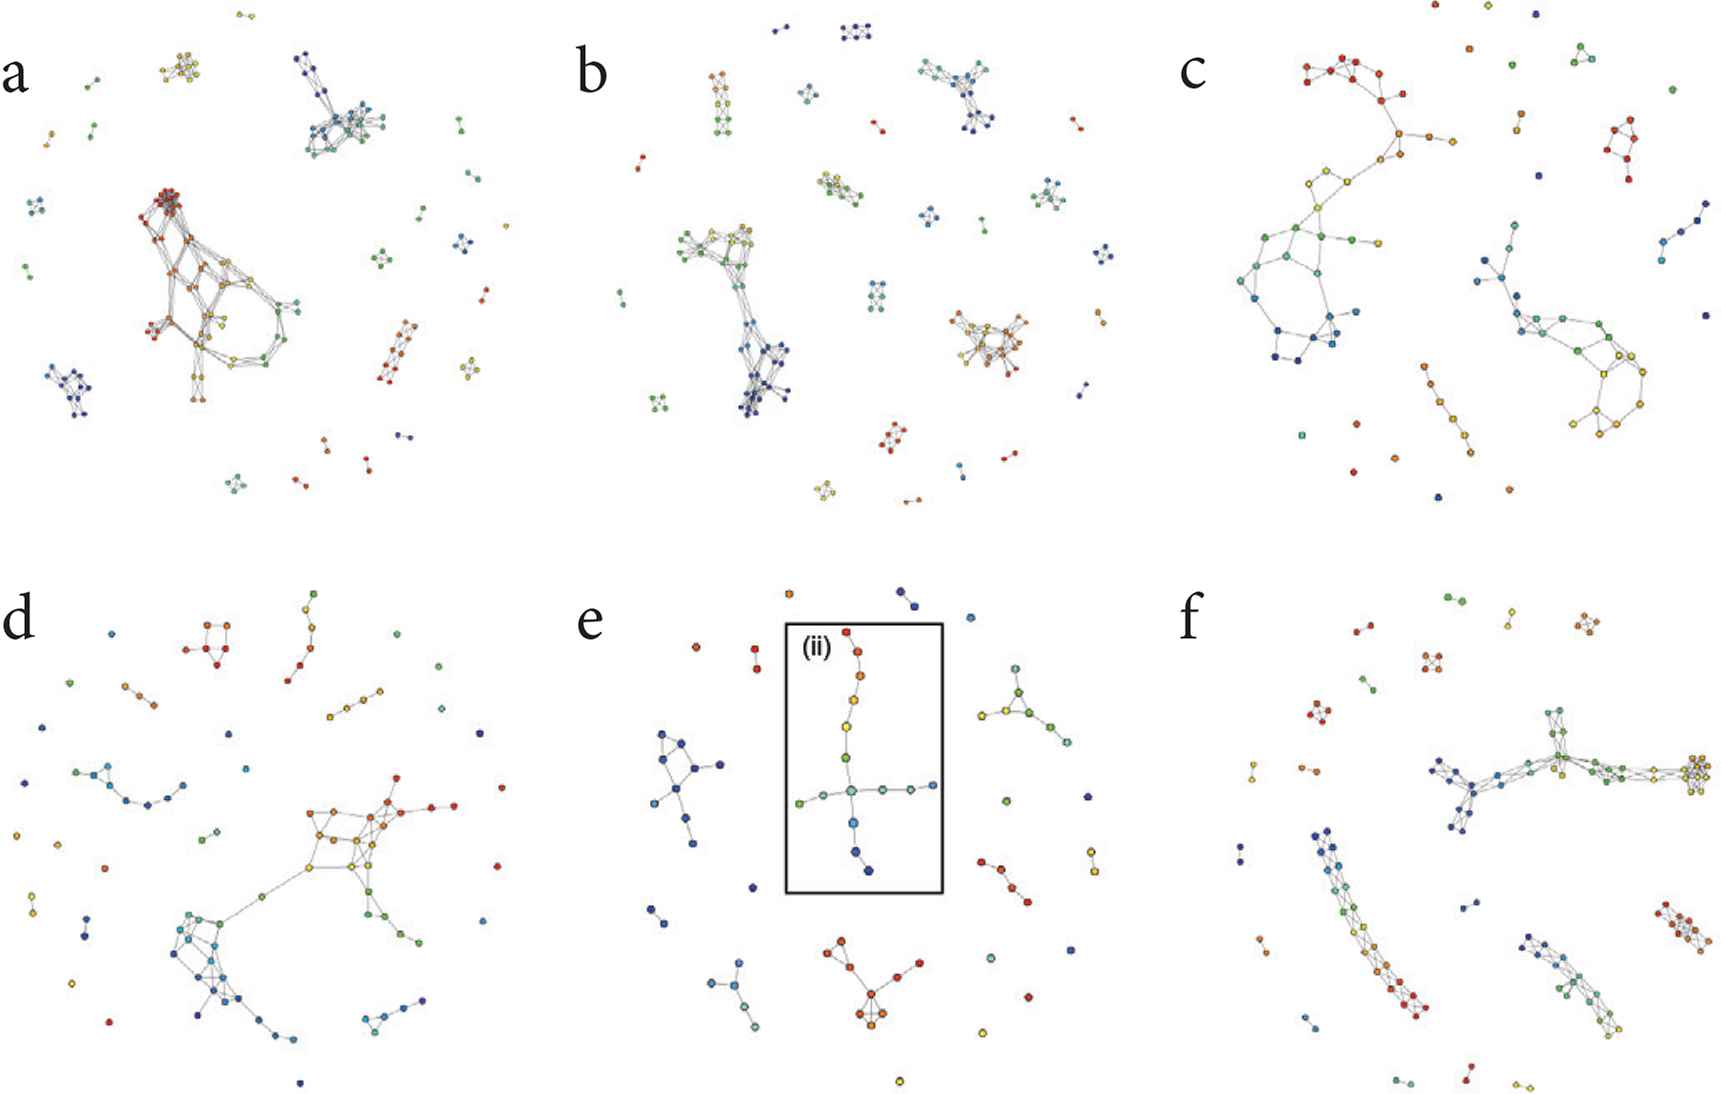
In this paper, two daily outputs are shown in detail for case studies discussed later. The output results of November 1st, 2017 on the phase graph are shown in Figure 7, and the output results of November 3rd, 2017 are shown in Figure 8.

Phase graph with Topological Data Analysis (TDA) Mapper to monitoring packets on Nov. 1, 2017 (consecutive 10 K packets). (a) Packet number 1–10000. (b) Packet number 10001–20000. (c) Packet number 20001–30000. (d) Packet number 30001–40000. (e) Packet number 40001–50000. (f) Packet number 50001–60000.
Phase graph with Topological Data Analysis (TDA) Mapper to monitoring packets on Nov. 3, 2017 (consecutive 10 K packets). (a) Packet number 1–10000. (b) Packet number 10001–20000. (c) Packet number 20001–30000. (d) Packet number 30001–40000. (e) Packet number 40001–50000. (f) Packet number 50001–60000.
5.4. Evaluation Test: Visualization of Attack Overview as Time Series
First, the effectiveness of the method was evaluated from a macro perspective of the phase graph output by TDA Mapper. As the phase graphs shown in Figures 7 and 8 are viewed from a macro perspective, focusing on the number of output nodes and edges, it is considered that it is possible to visualize the transition of the attack overview as a time series. Additionally, as the traditional analysis method used for comparison, the number of unique source IP addresses, number of source port numbers, and number of destination port numbers were summarized. These values were plotted on a graph to track the activity of the attacker. Figures 9 and 10 show the packets monitored on the darknet from 0:00 on November 1st, 3rd, and 5th, 2017 split into 10 K packets and depicted as a time series, comparing the previous method and the proposed method.
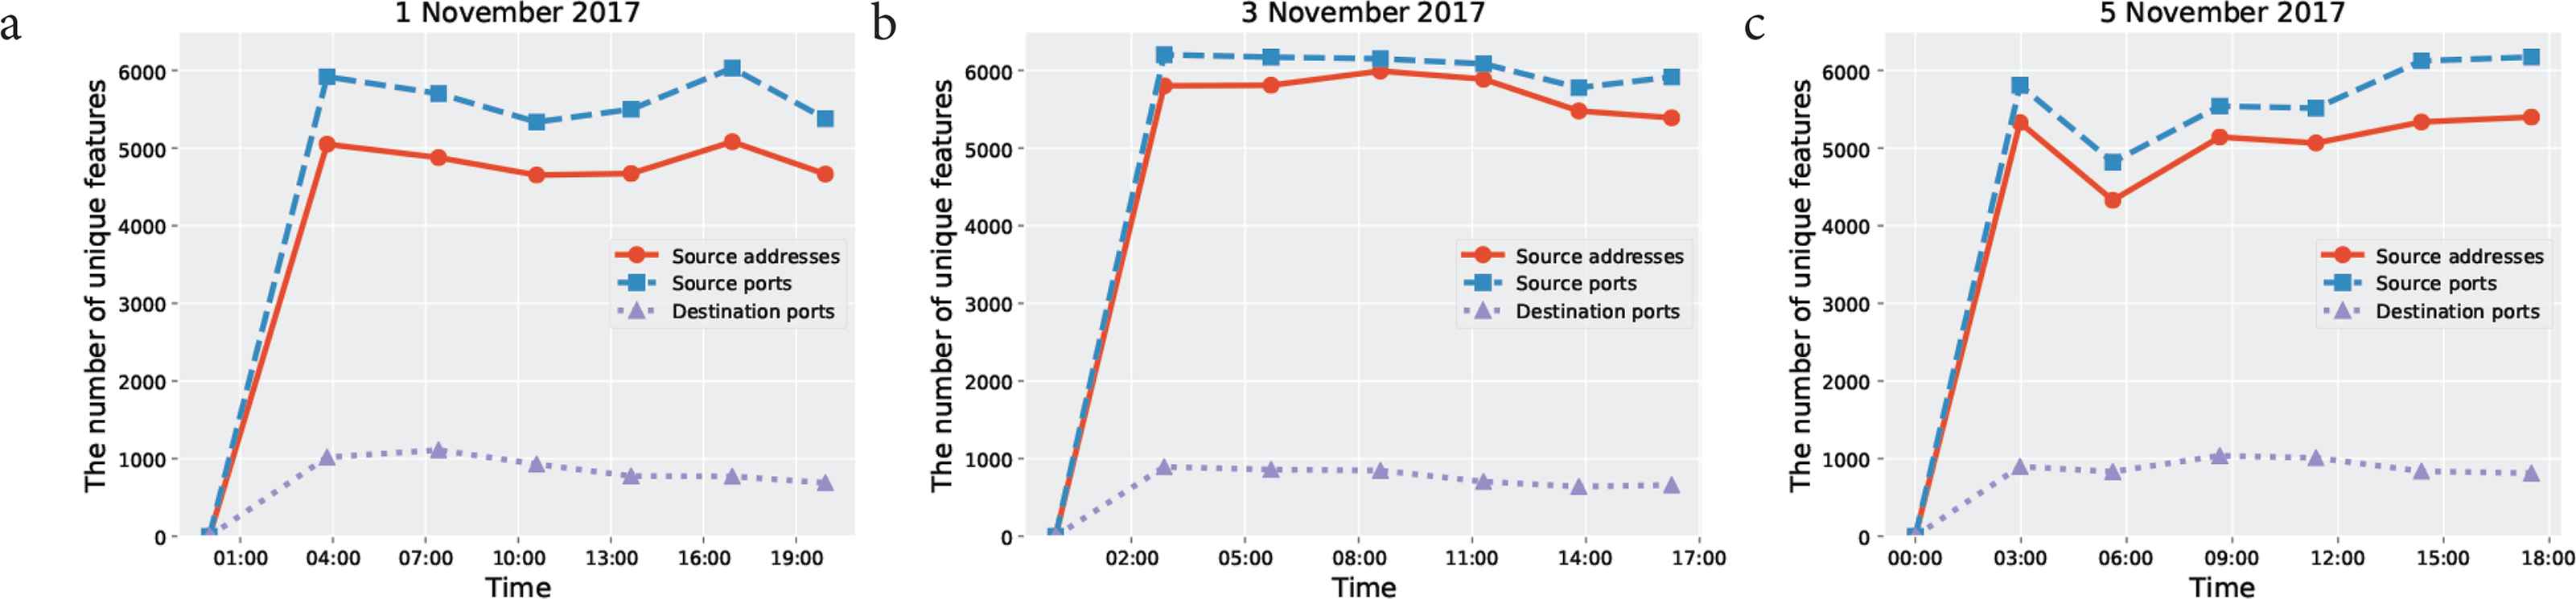
Transition in source IP addresses, source port numbers, destination port numbers per 10000 packets. (a) Results of November 1st, 2017. (b) Results of November 3rd, 2017. (c) Results of November 5th, 2017.
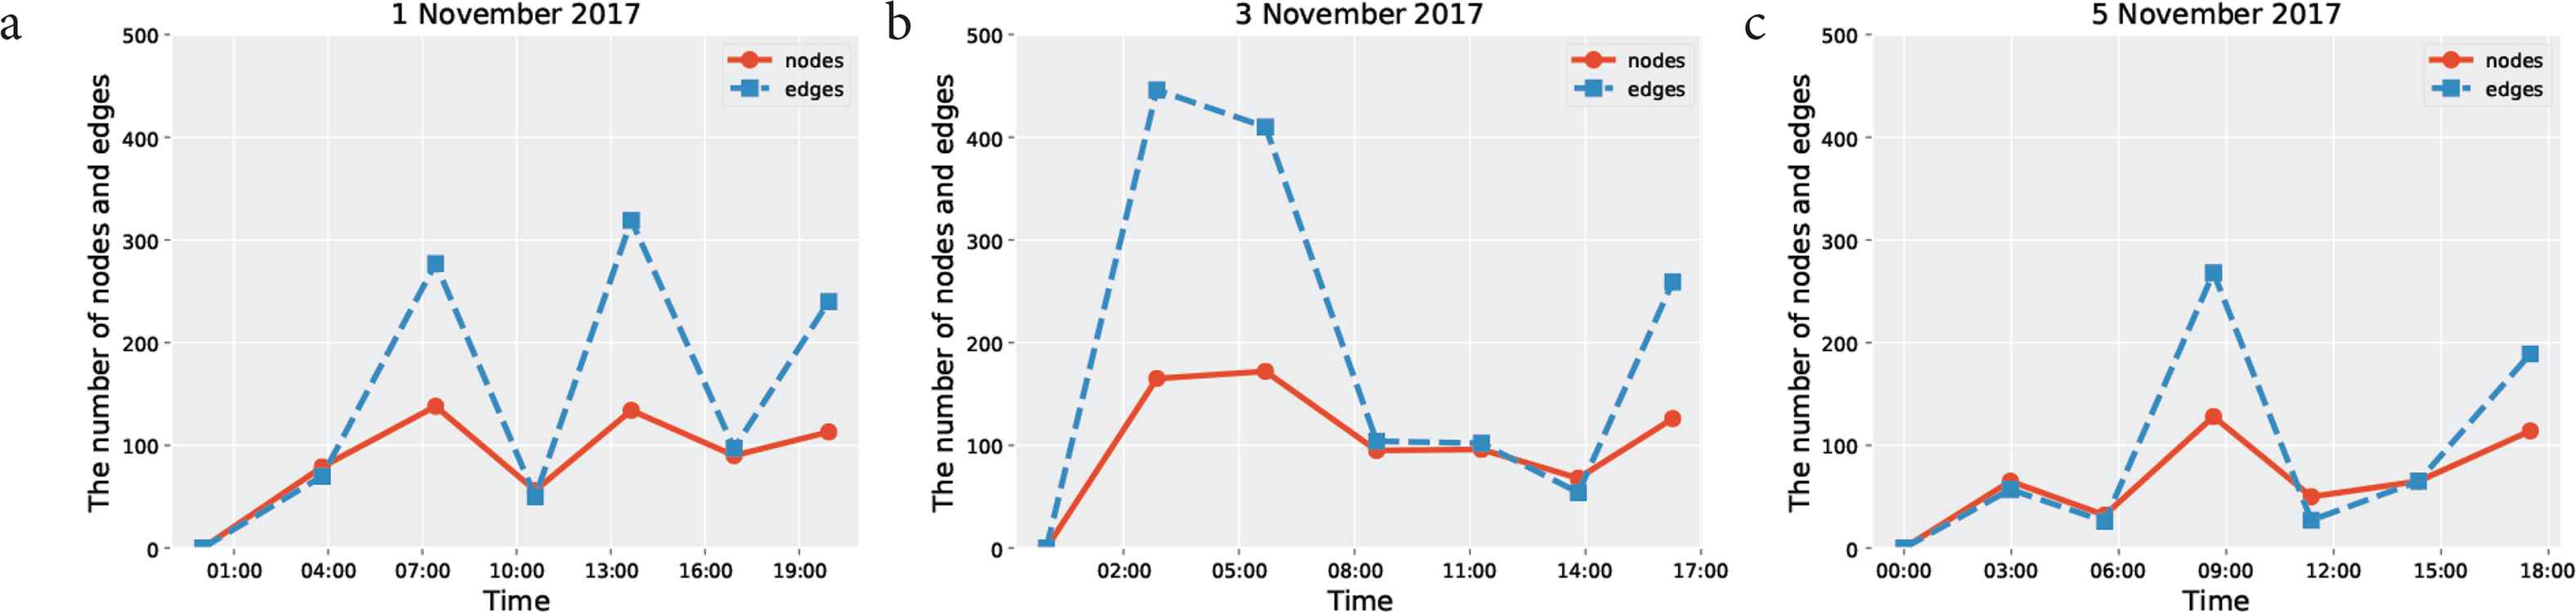
Transition in number of nodes and number of edges per 10,000 packets in output phase graph. (a) Results of November 1st, 2017. (b) Results of November 3rd, 2017. (c) Results of November 5th, 2017.
First, the results obtained from the previous method will be described. Figure 9a–9c each plot the number of unique source IP addresses, number of source port numbers, and number of destination port numbers appearing for each 10 K packet. From Figures 4–6 already shown, it can be seen that the monitoring packets arriving on the darknet for the 3 days of the test generally show the same tendencies. In other words, as they include a large number of source port numbers continuously used in attacks over the past several years, the number of unique destination port numbers is lower compared to the number of unique source IP addresses and source port numbers. In each of Figure 9a–9c, the number of unique source IP addresses, number of source port numbers, and number of destination port numbers all comprise flat graphs, indicating that there are no major fluctuations in values.
Next, with regard to the evaluation results using the proposed method, the transition in the number of nodes and number of edges in the output phase graph [transition in number of nodes and number of edges for Figures 7 and 8 (Figure of November 5th is omitted)] is plotted as a time series graph for each 10 K packet (Figure 10a–10c).
With TDA Mapper, how the phase graph is output differs depending on the data format. The input data on this occasion standardizes the information as much as possible from the packet data before input, so there is no processing that places specific weight on specific elements. Therefore, if looking at the graph, focusing on the number of nodes and number of edges, we can see a clear fluctuation in the number of edges. The number of edges expresses the number of relationships among the clusters; however, when plotting this value and publishing this transition, useful knowledge was not considered to be obtained yet.
On the other hand, the transition in the number of nodes is thought to provide some significant information. The number of nodes is the number of packet clusters with similar trends. Similar to the previous method, this is a virtually flat graph. The number of nodes being flat means that a major fluctuation has not occurred in the number of generated clusters, and it is surmised that packets with a similar trend arrived at the darknet.
5.5. Evaluation Test: Extraction of Relationship among Monitoring Packets
For the next evaluation test, the effectiveness of the proposed method from the micro perspective of the phase graph output by TDA Mapper was evaluated. In other words, the author focuses on the details of the nodes and edges comprising the output phase graph. In this paper, two examples of extracting the relationships among monitoring packets are shown as case studies.
Case study 1: For the first case study, the author focuses on the black frame (i) within Figure 7d. An enlarged view of this part is shown in Figure 11. The nodes and edges in Figure 11 are dense and, from this, it can be surmised that the same types of incidents are occurring in a concentrated manner.
Expanded diagram of the black frame (i) within Figure 7d.
Therefore, the packets comprising the nodes in Figure 11 were investigated, and the possible causes for the output results were analyzed and obtained. The result of the analysis was that all packets comprising the nodes had common characteristics. First, for the source IP address, all packets were from 124.160.x.x. Hereafter, IP address is anonymized. Additionally, the source port number was 7021 and the destination port number was 11042. For this reason, it would seem to be a reasonable interpretation that these results were from similar incidents occurring in a concentrated way in Figure 11. Because neither the source port number or destination port number described above are general port numbers, this is a case where interesting monitoring packets were extracted.
Case study 2: For the second case study, the author focuses on the black frame (ii) in Figure 8e. Figure 12 is an enlarged diagram of this. The phase graph focused on in the second case study is comprised of a total of 15 nodes. In the following description, for convenience, a serial number from 1 to 15 has been given to each node in Figure 12. For the form of the graph, the author can see, based around node 6, that the node links are branched in four directions. Here, the size of the node is related to the number of packets making up a cluster.
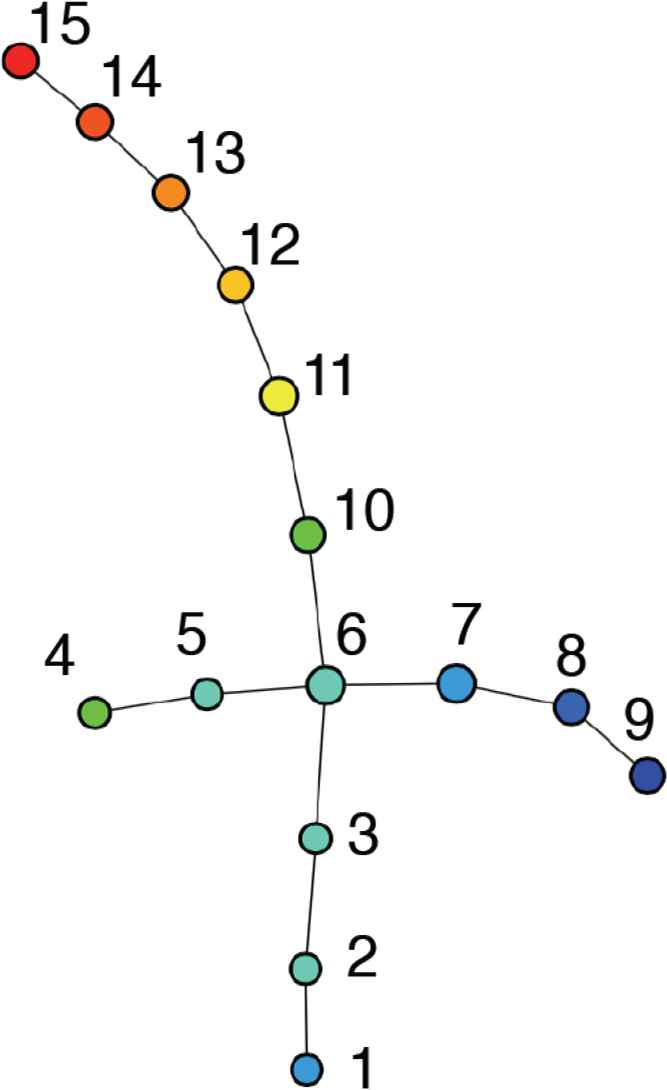
Expanded diagram of black frame (ii) within Figure 8e.
The node color is visualized more in blue the smaller the disparity in the difference among packets when forming the cluster, and more in red, the greater the disparity among the packets.
From the output phase graph, the question of what kind of algorithm is used for the automatic extraction of knowledge related to attacks is currently under investigation. However, the monitoring packets comprising node 6 were analyzed first, which is the starting point for the branching. Although it is difficult to make a clear distinction from the output graph image, node 6 is the largest cluster, made up of 154 packets. As this is the node positioned in the center of the branch, if this node is analyzed, it is considered possible to understand how the incidents occurred.
Node 6 includes packets made up of 12 unique source IP addresses. The ratio of destination port numbers showed that the scan of port 23 and port 2323 made up a large number, while packets for ports 445 and 502 also make up a small ratio. The port scans for these two ports are thought to comprise incidents.
Next, the analysis results from the packets comprising nodes 1, 4, 9 and 15 positioned at the edges branching in four directions will be discussed. As for the destination port numbers for the packets included in the node, node 1 had destination port numbers {1433, 22, 23, 445, 80}, node 4 had {1433, 22, 23, 2323, 2483, 445, 53}, node 9 had {23, 2323}, and node 15 had {23, 2323}. The author can see that clusters targeting port 23 and port 2323 are formed the more the author approaches nodes 9 and 15.
If the author focuses on the number of source IP addresses, in node 1 there were 19, in node 4 there were 16, in node 9 there were six, and in node 15, there were 20 packets clustered from unique source IP addresses. In addition, when the author investigated whether the source IP addresses were duplicated among the respective nodes, except for one overlapping address in the 185.188.x.x on node 9 and node 15, there were no duplicates seen.
When investigating all the nodes, the source IP address 185.188.x.x was an address that widely appeared in all nodes other than node 1–5. In this way, even in the case of darknet monitoring packets including large amounts of noise, this method is considered to be capable of visualizing the similarities and relationships among monitoring packets with a high degree of regularity. Moreover, it is possible to perform analysis from the new perspective of attack trends.
6. CONCLUSION AND FUTURE WORK
In this paper, the author envisages deployment in a generally publishable darknet monitoring system and proposed a method of visualizing malicious packets using TDA Mapper, which is one method of TDA for darknet monitoring packets.
As for visualizing attacks in a time series, the author has not yet seen promising results. On this point, the author needs a correction in terms of application and operation, such as co-use with an existing method.
On the other hand, when extracting relationships among malicious packets, useful results are thought to be achievable. In this paper, the author has shown two case studies, and it is considered that monitoring packets can be summarized. Moreover, even in the case of darknet monitoring packets with a lot of noise, such as those connected by edges on separate nodes that are deeply related, it has the potential to be a useful tool for visualization.
The author considers that there are the following three issues for this study moving forward.
First, there is the formularization of the method of determining parameters. In the evaluation tests on this occasion, the resolution of the phase graphs were manually adjusted to the extent that they could be analyzed using pre-tests. Therefore, the parameters can be determined according to the number of input packets or the scale of the darknet, and the aim is to reduce the complexity at the time of visualization through parameter adjustment.
Next, it is considered that the author can devise a method of automatic extraction of knowledge regarding attacks from the phase graph output by TDA Mapper. Even now, if the author performs further analysis in regard to the distinctive areas of the phase graph, it is possible to extract knowledge from the packets comprising the node. The author would like to also provide a general overview of packet groups comprising nodes for users without specialized technical knowledge.
Finally, it is also possible to consider higher dimensions for feature vectors comprising input data. The result of this would be that, whereas an increase in processing time would be a concern, it is considered that the higher the dimensions of data, the greater the potential there is for extracting new knowledge that would be difficult to detect with other methods.
CONFLICTS OF INTEREST
The author declares no conflicts of interest.
ACKNOWLEDGMENTS
The author would like to express gratitude to the JPCERT/CC, which provided actual monitoring data from the Internet when promoting this study.
REFERENCES
Cite this article
TY  - JOUR
AU  - Masaki Narita
PY  - 2021
DA  - 2021/01/13
TI  - An Empirical Study on Darknet Visualization Based on Topological Data Analysis
JO  - International Journal of Networked and Distributed Computing
SP  - 52
EP  - 58
VL  - 9
IS  - 1
SN  - 2211-7946
UR  - https://doi.org/10.2991/ijndc.k.201231.001
DO  - 10.2991/ijndc.k.201231.001
ID  - Narita2021
ER  -