
Sovereign bond issues: Do African countries pay more to borrow?☆
- DOI
- 10.1016/j.joat.2015.08.003How to use a DOI?
- Keywords
- Sub-Saharan Africa; Sovereign debt markets; Development finance
- Abstract
There is a new wave of external borrowing by African governments on private sovereign bond markets. The findings in this paper indicate that African economies pay higher-than-normal coupon rates on these markets; observed risk measures like agency ratings and debt to GDP ratios do not explain the deviation from the norm. We also find that countries in better financial standing tend to self-select into the private markets, such that their risk profiles cannot explain the high coupon rates. Further research steps and policy implications are discussed.
- Copyright
- © 2015 Afreximbank. Production and hosting by Elsevier B.V. All rights reserved.
- Open Access
- This is an open access article under the CC BY-NC license (http://creativecommons.org/licences/by-nc/4.0/).
1. Introduction
There is a new wave of external borrowing by African governments, and it is not from the Development Banks. No sub-Saharan African country had sold debt on private international markets in almost a decade before Seychelles issued a $200 million Eurodollar bond in September 2006. Now these countries once excluded from global finance appear to be the darlings of Eurobond markets. Many of the countries issuing debt were the subjects of debt restructuring and forgiveness at the turn of the century, through programs like the World Bank’s Highly Indebted Poor Countries (HIPC) and the Multilateral Debt Relief Initiatives.
In 2007, Ghana became the first HIPC nation to issue sovereign bonds in international markets. Tanzania and Zambia followed in Ghana’s steps, and their bonds were oversubscribed. Investors offered almost $12 billion as they clamored for a slice of Zambia’s $750 million bond issue in 2012.1 In July, 2014, Kenya raised $2 billion with a combination of 5 year and 10 year bonds. Once again, like so many other African issues it was oversubscribed, with $8 billion in bids.2 Even Ethiopia, one of the poorest countries in SSA floated a $1B bond issue in December, 2014. This trend provokes many questions that have not been systematically addressed in the literature; our paper explores whether borrowing costs are unjustifiably higher for African countries, as well as whether African issuers of international sovereign bonds may be particularly prone to crises — in being more likely to borrow than other countries with comparable macroeconomic fundamentals.
First, we ask whether the costs of borrowing are higher for African countries — beyond what can be explained by risk ratings and other observable macroeconomic variables. Higher costs of borrowing are interesting because those costs are part of the government’s debt burden and contribute to the risk of future default, even if in a small way. Secondly, higher borrowing costs motivate an inquiry into why governments will presumably take the high costs of the private market over the option of low-cost loans and grants from the development banking institutions. The paper then goes on to explore whether the countries participating in the sovereign debt markets are more vulnerable than average.
We focus on Africa because the region has been the locus of much work on debt relief and renegotiation to alleviate poverty, so it becomes important to examine whether the current wave of borrowing is consistent with these efforts. In the words of Stiglitz and Rashid (2013), “... are shortsighted financial markets, working with shortsighted governments, laying the groundwork for the world’s next debt crisis?”.
Nevertheless, one cannot deny the need for large investments in programs and infrastructure that support development on the continent.3 Governments must borrow to pay for policies and infrastructure in order to address growth and poverty goals in the long term, but borrowing comes with the risk of crises (Lane, 2012; Arteta and Hale, 2008; Cole and Kehoe, 1996). Past African debt crises often involved re-structuring with official lenders under terms that required painful conditionalities. These conditionalities often harmed economic development (Jorra, 2012; Stein, 2012; Sachs et al., 2004; Mkandawire and Soludo, 1999). With this history, and faced with the need for foreign debt, African governments often face unpleasant options in the choice between the discipline of private markets and the international financial institutions.4
Our analysis suggests that the interest rates charged by investors are higher for sovereign bonds issued by governments in sub-Saharan Africa. This unexplained “Africa Premium” is about 2.9% points after controlling for relevant facts like the period of issue, the credit ratings of issuers and their macroeconomic fundamentals. A back of the envelope calculation, using current debt estimates of $14 billion suggests that the governments of sub-Saharan Africa will pay roughly $300 million of interest each year that is not readily justified by the risk represented in ratings. With a reasonable discount rate of 5%, implied half-year coupon payments and average bond tenor of 10 years, this represents a net loss of $2.2 billion to African governments on outstanding obligations. This is one of the first set of studies, to the best of our knowledge, to test for a region-specific interest premium on bonds at the time they are issued.
The estimates derive from regressions that use a dataset comprising all sovereign bonds issued in Euro and US dollars between 2000 and 2014. The dataset was extracted from a proprietary database provided by DataStream. There is a short discussion of the data in the subsection that precedes the empirical analysis.
The focus on bonds issued in dollars or foreign currency is motivated in part by the need for unbiased estimates. Coupons are comparable for bonds issued in a common currency like the US dollar, regardless of the issuing country. The interest rate to be paid by the issuer or debtor excludes the risks of changes to exchange rates or other factors tied to currency. Simply put, within this dataset one can make reasonable comparisons of the coupon rates for bonds issued by different countries, or the same country over time.
Furthermore, the largest share of sovereign bonds issued on private markets are denominated in dollars, so our focus on that currency is fairly representative of international sovereign bond markets in general. That said, one must acknowledge that borrowing in a foreign currency puts borrowers at a disadvantage, especially when the borrowing country has no reliable revenue stream in the borrowed foreign currency. The foreign debts are usually reported to be necessary for investments that generate tax revenue in the borrower’s currency. In those instances, the borrowed funds could lead to pressure on the country’s foreign reserves and exchange rates when payments are due.
Second, the paper asks whether the profile of sovereign debt issuers from the African continent foretells a repeat of the previous decades’ crises. The second question is motivated by a disturbing fact: African countries are quickly returning to the levels of debt that preceded the 1997–2005 round of debt relief interventions. We examine the attributes of countries that took on additional debt, and compare the most salient elements of their risk-profiles to other debt issuers. From the data, it is clear that the first set of sub-Saharan African borrowers from international bond markets between 2007 and 2014 were less crisis-prone. Larger, richer African economies with recent trade deficits are more likely to offer loans on the sovereign bond markets after 2005. This pattern fits the global norm, however, there are exceptions: Seychelles successfully issued Eurobonds in 2006, but defaulted in 2008 after an economic downturn prompted by the debt crisis in Europe, Seychelles’ main source of tourist revenue.
In summary, the debt profiles of most of the African countries that issued bonds have been improving over the last decade, many in part due to debt forgiveness, combined with rising exports. Exceptions like Seychelles give cause for caution about taking the risk of debt when unforeseen contagion from the European crisis was just around the corner. A notable share of bonds covered in this paper was issued in the name of funding capital projects for development, while several were the result of debt restructuring and forgiveness efforts.
2. Literature
The literature on African sovereign bond issues is small but growing. One key element is the question by some authors on the accuracy of bond ratings as a reflection of the real underlying risks and the associated interest rate spreads compared to riskless bond issues (See Mora, 2006 for a review of some of this literature particularly in the context of the Asian crisis). Others have confirmed the usefulness of sovereign ratings to support the case that sovereign ratings reflect lenders’ assessment of credit quality and the macroeconomic soundness of the borrowing economy. For example Lee (1993), as well as Cantor and Packer (1995) demonstrate that ratings of Moody’s and S&P correspond to a number of key macroeconomic variables. Mora(2006) finds that ratings mostly corresponded to the predicted measures as determined by macroeconomic variables during the Asian crisis.
In the context of Africa, few authors have actually directly tried to measure the cost of borrowing relative to other comparable emerging region and country specific sovereign debt issues. A 2014 IMF study of African sovereign debt (Mecagni et al. 2014) argued that SSA countries have actually been sold at a discount relative to countries with similar debt ratings and hence SSA did not pay a region specific premium. Their exercise appears to be a simple comparison of shifting yield averages for three of four countries in the same debt rating category (four in all) against one or two African countries in each category. There is no attempt to analyze the comparability of the countries relative to perceived macroeconomic indicators.
Gueye and Sy, 2015 provide one of a few studies that try to estimate the hypothetical spreads for 19 SSA country bond issues using parameters from a finance model of push (general climate that attracts investors) and pull factors (country specific and largely dependent on policies) from 120 countries. They use an ordered probit model with macroeconomic indicators as independent variables to estimate sovereign credit ratings. They then estimated the relationship between secondary markets’ bond spreads and ‘push’ and ‘pull’ factors. Based on this relationship, they generate a country’s hypothetical bond spreads using its actual or estimated credit rating as a proxy for its ‘pull’ factors. Once they have the hypothetical yield spread, they approximate local currency yield curves by assuming the Fisher Effect (real interest rates that reflect the nominal rate minus the expected rate of inflation) or uncovered interest parity.
Their results show that the hypothetical SSA borrower would pay 338 basis points above the average emerging market borrower. However, it is interesting that in three of the four cases where the actual spreads are provided, SSA countries are doing much better than the projected spreads, i.e. they are getting a better deal than would be expected.
Our study uses a simpler, more straightforward empirical approach as well as more recent data — from 2006 to 2014. This was the period of greatest SSA activity on the bond markets, especially on the international bond markets. The Gueye and Sy(2015) study examines data only from 2000–2009 While the Gueye and Sy(2015) study also tries to construct hypothetical spreads for bond issues, based on market prices, our approach is simpler, closer to the data on the actual costs of borrowing for African countries and easier to interpret.
As we will show below, our study in contrast looks directly at the actual spreads paid relative to the spreads that would be justified based on the macroeconomic fundamentals and the ratings of agencies. Contrary to the other results described above, we find that SSA countries are forced to pay a premium for participating in the international bond markets.
The literature examining the vulnerability of SSA countries is also not well developed. An IMF produced study (Mecagni, et al. 2014) raises a number of issues: including the risk that public spending projects financed by sovereign debt may be poorly selected or executed and lead to higher recurrent spending which is not sustainable; could lead to a lengthening of maturity of public debt, cut access to concessional debt; increase the share of public debt in foreign currency; could help increase private sector and parastatal access to international capital markets leading to greater macroeconomic and structural vulnerabilities and could lead to appreciation of domestic currencies, hurting their competitiveness. However, there is no attempt to analyze the actual impact of these factors on African countries.
In the body of work that examines the risks that sovereigns represent to lenders, Tyson (2015) uses simulations to evaluate exchange risks, possible debt sustainable deterioration and vulnerabilities associated with the volatility of capital flows. For exchange risk she uses the worst case depreciation of the Ghanaian cedi — an estimated 30% additional value that would need to be paid in local currency terms following a devaluation in the countries issuing debt in 2013 and 2014. This would come to $10.8 billion or 1.1% of the regional GDP. However as Sy (2015a) points out, there is no reason to apply the exchange rate depreciation of one country to all of the other countries that have had much lower levels of depreciation.
Sy (2015b) also attributes rising spreads in new offerings in places like Ghana to some growth and some deterioration in macroeconomic fundamentals, or the pull side of debt. In addition, he also points to the huge mismatch in the high domestic interest rates associated with government debt in domestic currency terms compared to dollar denominated foreign debt as very worrisome. However, none of this has translated into a rise in external debt distress in the participating countries based on IMF sources.
None of these sources have statistically analyzed the impact of sovereignty on risk which is something we attempt below in the context of the identification of variables that predict the participation of African countries in sovereign bond markets.
3. Empirics
This section presents data on the bond issues of interest, and analysis that addresses the following questions (see appendices for a selection of country cases):
- •
Are bond issues by African governments priced at rates comparable to the rest of the world? In other words, is there an “Africa premium” on debt that is not explained by observable risk?
- •
What are the features common to countries that issued debt on private markets? Do these provide cause for concern given the history of debt crises in Africa?
3.1. Methods and data
3.1.1. Data
Table A1 in the appendix lists the bonds issued by African economies. These 24 bonds issued between January 2006 and December 2014 represent a tiny fraction of the international sovereign bond markets in that period. Fixed rate coupons bonds are a disproportionately high share of these bonds, and ten years is the modal bond tenure. The bonds were issued in US dollars; the most common currency for transactions of this nature.
Country risk was measured using Fitch’s historical sovereign risk ratings over the period of 1995 to 2013.5 Where Fitch ratings for a country are not available, the equivalent rating from either S&P or Moody’s was used. The ratings are expected to be a compact representation of country risk, and regressions not shown here confirm this — 58% of the variation in spreads can be explained by only dummies for the quarter of issue and Fitch ratings.
Each issuing country’s macroeconomic fundamentals are taken from the World Development Indicators database (World Bank, 2013). For reasonableness, the values of those variables in the year prior to bond issuance are used. High government debt ratios, low trade surpluses (high deficits), low foreign reserves and poor(i.e. high-numbered) agency ratings are all expected to predict high interest rates on bonds.
Coupon rates, issue dates and maturity dates are sourced from DataStream™. The analysis is limited to the 852 bonds with simple coupon structures, issued outside the borrower’s country after 2005 and denominated in US dollars.6 The coupon structure exclusion leaves only bonds with fixed, floating and index-linked rates: zero coupon bonds, strips and other complex instruments are left out. All the sovereign bond issues used for the analysis are in US dollars; limiting the sample to this currency improves comparability (we also considered using bonds issued in local currencies to establish baseline costs estimates – unfortunately we could not find reliable data on bonds issued in local currency for all countries in our sample). Finally, we limit the estimation sample to bonds listed on a market outside the issuing country, to avoid potential pricing effects of home bias (Cornand et al., 2014; Ahearne et al., 2004). This excludes bonds issued by the financial centers — Germany, France, the United Kingdom, Japan and the US, and ensures that African governments’ bonds are compared for the most part, with emerging economies that do not host sovereign bond markets. As these excluded economies generally have lower borrowing rates, their exclusion should lead to more conservative econometric estimates. 17 of these 852 bonds were issued by economies from sub-Saharan Africa.
What share of bond coupon rates can be explained by features of the bond issue and the issuers’ ratings? How do African economies fare, compared to other economies? Fig. 1 provides preliminary evidence using data from DataStream™ on dollar-denominated sovereign bonds issued between 2005 and 2014. The figure reports quarterly averages for the coupon or interest rate paid by all issuers outside sub-Saharan Africa, as well as the coupons for African countries that issued sovereign bonds in that period.
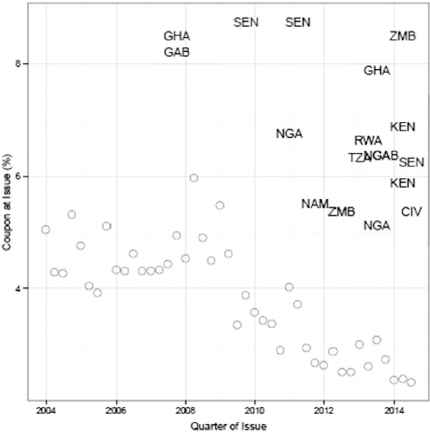
Coupon rates on sovereign debt: 2004–2014. Bonds limited to US-dollar denominated floating and fixed-rate bonds for comparability. Each African country that issued a bond is indicated by its 3-letter isocode. The global average for each quarter, excluding African countries is marked with a circle.
Data Source: DataStream.
The appendix discusses this figure in greater detail, to provide context for the analysis that follows. It cites market sources to show the contradiction between the pattern of over-subscription to the bonds and the high coupon rates charged, while describing the debt situations of the issuing countries. The analysis is preceded by a discussion of the data — a list of coupon-bearing sovereign bonds issued in Euro and US dollars between 2000 and 2014. The empirical analysis comprises reduced form linear regressions.
3.1.2. Estimation
In evaluating the pricing of bonds at issue, the primary econometric challenge is finding comparable bond issues — requires comparable countries and comparable bond features. Simple OLS identifies baseline case, with controls for these features.
The first regression exercise takes the yield at issue of each bond as the dependent variable. The selected set of predictors follows the pattern of papers like Hilscher and Nosbusch (2010) and uses measures of macroeconomic fundamentals as well as bond agency ratings. The primary measure of interest is a regional dummy to estimate whether unusually high coupon rates as associated with bonds issued by African governments (or HIPC participants).
Formally,
The fixed effects are dummy variables that represent region, continent and HIPC debt relief participation. Time dummies also capture the quarter in which the bond was issued. Because floating rate bonds generally involve lower coupon rates, a dummy for the bond type is also added to the regression.
3.1.3. Predicting sovereign debt market participation
In testing whether African countries paid more to borrow from the international markets, one must first consider whether the borrowing countries were those most qualified to issue debt within the region. The concern here is motivated by history: debt crises are a notable element of Africa’s economic doldrums in the 80s and 90s. The data, as shown in Fig. 2, indicate that African governments are accumulating debt on a scale like that seen before the last round of crises.
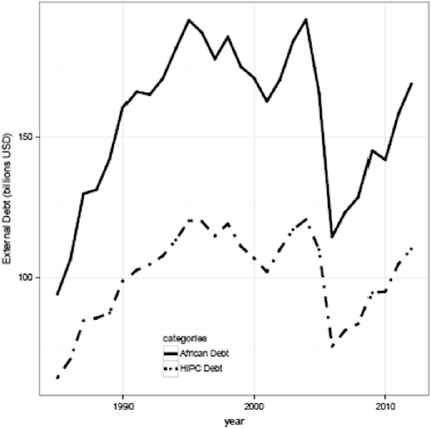
African government’s external debt: 1985–2012. Sub-Saharan African Countries only. HIPC indicates countries in the Highly-Indebted Poor Country debt-relief scheme. The large drop in debt around the turn of the century is largely due to debt forgiveness and restructuring.
Data Source: World Development Indicators
Therefore, it becomes interesting to know whether the countries that borrow are those with better macro-economic fundamentals.
This second step uses a probit estimator of the likelihood of African countries’ participation in the sovereign debt markets. African international bond market participation is lower than the rest of the world, so comparison with larger economies outside Africa would be unhelpful.
Formally,
All 112 countries for which the explanatory variables are available in the WDI database are included in this regression. The dependent variable is a dummy that represents whether a country issued sovereign debt on the international markets between 2006 and the end of 2013. The measure was constructed from the list of 1203 sovereign bond issues listed on DataStream™ for which the country data are in WDI.
Finally, the regression will include an HIPC dummy intended to estimate whether countries selected for restructuring under this scheme are more likely to turn to the private debt markets for sovereign debt.
3.2. Results
3.2.1. Lending rates at issue
Table 1 summarizes the coupon rates and its predictors for the subset of bonds with fixed or floating coupons.10 Following related papers in the literature, Hilscher and Nosbusch (2010); Kumar and Baldacci (2010), variables representing macroeconomic fundamentals were selected as the independent variables in the linear regression that follows. The table also includes sovereign credit ratings11, as well as the tenure of the bond — also known as tenor or duration to maturity.
| Variable | Mean | Std. Dev. | Min. | Max. | N |
|---|---|---|---|---|---|
| Smaller sample: debt ratio not missing | |||||
| Bond spread | 3.08 | 2.529 | −2.454 | 14.89 | 317 |
| HIPC dummy | 0.013 | 0.112 | 0 | 1 | 317 |
| GDP per capita | 8.449 | 0.676 | 6.408 | 9.640 | 317 |
| Debt/GDP | 0.464 | 0.299 | 0.02 | 1.895 | 317 |
| Reserves/GDP | 0.249 | 0.26 | 0.013 | 1.198 | 317 |
| Bond term | 13.328 | 7.681 | −1 | 40 | 317 |
| Larger sample | |||||
| Bond spread | 1.096 | 2.301 | −5.37 | 14.89 | 1203 |
| HIPC | 0.003 | 0.058 | 0 | 1 | 1203 |
| GDP per capita | 9.675 | 0.896 | 6.408 | 11.625 | 1203 |
| Debt/GDP | 0.464 | 0.299 | 0.02 | 1.895 | 317 |
| Reserves/GDP | 0.216 | 0.155 | 0.007 | 1.198 | 1203 |
| Bond term | 9.972 | 7.039 | −1 | 55 | 1203 |
Summary statistics on spreads at issue.
The majority of bonds issued by African governments have ten year tenors (the fraction of bonds in the sample with these short tenors is 62% for African countries vs. 57% for all regions). The debt to GDP ratio data is not available for a large share of countries that issued bonds. Only 317 of the more than 1700 bonds identified from DataStream™ had this debt ratio data. The results are presented for this limited sample.
The spreads on bonds issued by African governments are higher by 5.7 percentage points on average (6.8% for African governments vs 1.05% for others), if one fails to consider the timing of the bonds and other risk factors. African governments generally have ratings and macroeconomic fundamentals below the group averages observed in the data. Therefore, this section examines whether all of this difference in the cost of borrowing is justified by observable risk factors. Table 2 shows that participants in the HIPC initiative pay higher coupon spreads at issue than the average country, even after controlling for global factors and country-specific risk indicators.
| Variables | (1) Spread | (2) Spread | (3) Spread | (4) Spread | (5) Spread | (6) Spread |
|---|---|---|---|---|---|---|
| Sub-Saharan Africa Africa region dummy | 4.04 *** (0.77) | 1.84 *** (0.71) | 2.90 *** (0.52) | 1.16 *** (0.35) | ||
| Asia region dummy | 0.90 (0.56) | 0.17 (0.20) | ||||
| Europe dummy | −0.69 (0.53) | −0.67 *** (0.18) | ||||
| HIPC | −0.79 (1.14) | −0.95 (0.82) | ||||
| GDP per capita | 0.53 ** (0.22) | 0.15 (0.24) | 0.10 (0.24) | 0.23 * (0.12) | 0.22 * (0.12) | 0.04 (0.12) |
| Reserves/GDP | −2.66 *** (0.66) | −1.43 * (0.75) | −2.62 *** (0.70) | −1.56 *** (0.41) | −0.64 (0.46) | −1.66 *** (0.41) |
| Bond tenor | 0.01 (0.02) | −0.01 (0.02) | −0.00 (0.02) | −0.03 *** (0.01) | −0.04 *** (0.01) | −0.03 *** (0.01) |
| Debt/GDP | 1.53 *** (0.48) | 2.04 *** (0.65) | 1.27 ** (0.51) | |||
| Constant | −2.89 (2.27) | −0.23 (2.42) | 0.79 (2.40) | −3.08 ** (1.42) | −2.43 * (1.47) | −1.20 (1.44) |
| Observations | 317 | 317 | 317 | 1203 | 1203 | 1203 |
| Adjusted R-squared | 0.46 | 0.48 | 0.41 | 0.58 | 0.58 | 0.57 |
| Fitch ratings | Y | Y | Y | Y | Y | Y |
| Quarter fixed-effects | Y | Y | Y | Y | Y | Y |
| Number of African bonds | Y | Y | Y | Y | Y | Y |
Standard errors in parentheses.
p < 0.1.
p < 0.05.
p < 0.01.
Spread on sovereign bond issues.
The same also applies to countries from sub-Saharan Africa in general. This raises two questions that deserve further research in a separate paper — (1) why would African countries leave the option of low lending rates from the multilateral lending institutions for the higher interest rates of the private markets? (2) are the higher rates likely to contribute to the risk of default in the future for these governments?
In interpreting the linear regression estimates — presented in Table 2, sub-Saharan African countries paid coupon rates at least 2.9 percentage points higher than the norm on bonds issued on the private international markets during the period in review. HIPC participants paid bond coupon rates that were not statistically different from the mean after controlling for other predictors. The reported R2 values are adjusted downwards to account for the high number of time fixed-effects and ratings variables.
Interpreting columns 1–3 of the table gives a conclusion that does not utilize much of the variation in the data. There are only five SSA countries represented in the smaller sample (Gabon, Ghana, Nigeria, Rwanda and Zambia), and only 7 of the 19 bonds issued after 2006 from the region.
When the debt to GDP ratio variable is dropped from the estimation, the sample size increases to 1203. These results are shown in columns 4–6. The apparently biased results of these columns do not, however, contradict the main implications of columns 1–3. The evidence suggests that bonds issued by African governments tend to incur higher interest payments to investors, even after considering risk, as measured by rating, and their ability to pay as measured by foreign reserves.
This is contrary to findings by Mecagni et al. (2014), which implied there was no sub-Saharan Africa-specific premium; on the contrary, they suggested that the Sovereign bonds were trading at a discount. As we argue in the introduction and show in the preceding paragraphs, our approach uses more controls than the IMF study. Specifically, we incorporate variables representing perceptions of risk.
The country-specific risk proxies yield coefficients that fit expectations. High existing debt ratios predict higher interest rates; a country with a Debt/GDP ratio of 100%, roughly twice the mean, is expected to issue bonds that incur an additional 0.6% of interest, after controlling for other factors. Sovereign bond ratings also correctly predict higher coupon rates. The ratings do not help explain differences between African countries, as the majority of the continent’s bond issuers share ratings between B and BBB+.
3.2.2. Predicting market participation
The variables used to predict participation in the international private sovereign bond markets are summarized in Table 3. The samples of interest here are the 42 sub-Saharan African countries represented in the first panel of the table and in the second panel — the 112 countries for which macroeconomic data are available.
| Variable | Sub-Saharan Africa | All countries | ||||
|---|---|---|---|---|---|---|
| Mean | Std. Dev. | N | Mean | Std. Dev. | N | |
| Bond issue dummy | 0.24 | 0.43 | 42 | 0.46 | 0.50 | 112 |
| ln(GDP) | 22.29 | 1.40 | 42 | 23.24 | 2.03 | 112 |
| GDP growth | 6.07 | 4.39 | 42 | 6.41 | 4.34 | 112 |
| ln(GDP per capita) | 6.66 | 1.05 | 42 | 7.45 | 1.09 | 112 |
| GDP per cap growth | 3.44 | 4.44 | 42 | 4.67 | 4.45 | 112 |
| Reserve imports ratio | 0.41 | 0.35 | 42 | 0.47 | 0.44 | 112 |
| Trade surplus | −0.20 | 0.24 | 42 | −0.15 | 0.21 | 112 |
| Concessional debts share | 0.79 | 0.22 | 42 | 0.62 | 0.32 | 112 |
| Debt GDP ratio | 0.41 | 0.36 | 42 | 0.31 | 0.27 | 112 |
| HIPC dummy | 0.71 | 0.46 | 42 | 0.30 | 0.46 | 112 |
(Source Data: WDI, DataStream)
Summary statistics.
The summary data is broadly consistent with expectations. A smaller fractions of African countries issued bonds on international markets compared to broader set of countries in the global economy — the bond issue dummy for African economies is about half of the comparable population. The GDP and GDP per capita of the African subsample is also less than the global average, while GDP growth is comparable. Similarly, as expected, debts and concessional debts as a share of GDP are higher for African economies. The reserve to imports ratio is also lower for African economies, suggesting the need to control for the relative availability of foreign reserves in the estimation that follows.
Finally, given the concern that international bond issues could drive a return to crises for HIPC countries — recent beneficiaries of debt relief, Table 3 suggests checking whether HIPC countries are more likely than average to issue foreign debt. HIPC countries are almost all African.
These summary statistics provide context for the analysis that follows: examining whether African countries that issued international bonds appear to differ remarkably from the global set of bond issuers in terms of these macroeconomic fundamentals. Another way of setting up the question: how much better are the 11 of 42 SSA countries that issued dollar bonds than their SSA peers? Do they stand out as well as the 54 of 112 countries that issued bonds?
Table 4 shows a positive correlation between larger, richer economies with recent trade deficits and offering loans on the sovereign bond markets after 2005. The first three columns represent a linear probability model — a simple OLS regression on the dummy variable that indicates whether a country issued a bond overseas. The last three are probit regressions, which assume a normal distribution for the innovations in the predictor variables.
| Y = 1 if country issued bond(s) on international markets | ||||||
|---|---|---|---|---|---|---|
| (1) (SSA) | (2) (SSA) | (3) (World) | (4) (SSA) | (5) (SSA) | (6) (World) | |
| ln(GDP) | 0.21 *** (0.07) | 0.21 ** (0.08) | 0.10 *** (0.03) | 0.93 ** (0.40) | 0.99 ** (0.42) | 0.35 *** (0.12) |
| GDP growth | −0.00 (0.08) | −0.04 (0.09) | −0.07 (0.04) | 0.19 (0.35) | 0.00 (0.38) | −0.28 * (0.17) |
| ln(GDP per capita) | 0.18 * (0.10) | 0.17 * (0.10) | 0.10 (0.07) | 0.65 (0.45) | 0.84 * (0.48) | 0.31 (0.27) |
| GDP per cap growth | −0.03 (0.07) | 0.02 (0.08) | 0.07 (0.04) | −0.37 (0.39) | −0.24 (0.45) | 0.28 * (0.17) |
| Reserves imports ratio | −0.10 (0.14) | −0.08 (0.14) | −0.15 * (0.08) | −0.05 (0.66) | 0.60 (0.71) | −0.49 * (0.28) |
| Trade surplus | −0.70 ** (0.34) | −0.69 * (0.34) | −0.08 (0.23) | −4.03 ** (1.68) | −5.55 ** (2.45) | −0.19 (0.83) |
| Concessional debts share | −0.45 (0.35) | −0.51 (0.34) | −0.28 (0.22) | −3.13 (2.02) | −5.34 * (2.75) | −0.99 (0.74) |
| Debt GDP ratio | 0.21 (0.22) | 0.22 (0.21) | 0.12 (0.17) | −0.10 (1.19) | −0.76 (1.33) | 0.45 (0.63) |
| HIPC dummy | 0.14 (0.13) | 0.13 (0.12) | 1.71 * (0.87) | 0.55 (0.41) | ||
| Constant | −5.25 ** (2.26) | −5.15 ** (2.34) | −2.27 * (1.25) | (11.80) −24.37 ** | (11.55) −26.47 ** | (4.68) −9.54 ** |
| Observations | 42 | 42 | 112 | 42 | 42 | 112 |
| R-squared | 0.37 | 0.38 | 0.37 | |||
| Pseudo R2 | 0.39 | 0.43 | 0.32 | |||
Robust standard errors in parentheses.
p <0.
p < 0.05.
p < 0.01.
Participation in sovereign bond issues.
The HIPC dummy in column 2 does not change the observed estimates in any significant manner. This preliminary check of correlations allays the concern that countries selected for the HIPC initiative are more likely to return to the debt markets right after obtaining relief for old debts. Large economies, and to a less significant level, richer economies are more likely to issue external debt in private markets. This is true for African economies, as it is true outside the continent (according to column 3 of the table). The growth in GDP and GDP per capita do not appear well correlated with the dependent variable.
The results also suggest that countries with low ratios of foreign reserves to imports, as well as those with low trade surpluses are more likely to be on the list of bond issuers. Taken at surface value, this is less encouraging, and suggests the risk that borrowing countries may face balance of payments challenges when the bonds come due. Foreign currency taken to make local infrastructure investments in the typical case is unlikely to produce funds in the required currency for repayment. However, when one considers that the mean of the trade surplus variable is −0.2 for African countries (from Table 3), it appears that the countries issuing foreign debt on private markets are fairly typical.
High debt to GDP ratios are not significantly associated with issuing debt, neither is participation in the HIPC debt relief scheme. These two coefficients favor the view that the countries issuing debt are lower risk than the general pool. This regression is by no means a test of whether countries consider concessional debt and private as substitutes, but it suggests that countries with lower than average concessional debt share of the total debt portfolio are more likely to be in the sovereign debt sample. This may simply be explained by the HIPC initiative’s reduction of concessional debts. However it could also be that the IMF and World Bank have more leverage over poorer African countries in blocking their participation in the sovereign debt markets or that concessional debt is seen by nations as not so concessional when you consider the punishing conditionality that accompanies it. The probit estimator for the HIPC dummy suggests that countries taking part in this scheme are more likely to issue private bonds; however, when one considers that several debt relief negotiations involved repackaging old debt into bonds the effect becomes insignificant (The appendix further discusses the history of each of the sovereign debt issues from sub-Saharan Africa).
This section of the results indicate that after controlling for country features like the HIPC designation, African countries issuing debt are largely comparable with their global peers. The African countries that issued debt in dollar markets between 2006 and the first half of 2014 generally had better macroeconomic fundamentals than their African peers — more so than the average bond issuing country stands out from the set of 112 economies for which we have data.
4. Conclusion
The data indicate that the last decade of high average export and GDP growth means that borrowing is less risky for many African countries. This has allowed many, especially the larger and relatively wealthier African economies, to return to the private markets for international bonds. HIPC participants are no more likely than the average country to seek debt from the international private markets.
Nevertheless, African governments pay a premium in borrowing costs — about 2.9 percentage points more than their macroeconomic fundamentals or credit risk ratings will support in our basic regression analysis. Higher coupon payments not explained by observable risk measures may only be described as a penalty on African governments due to investor bias. This penalty or premium represents a crude net present value estimate of $2.2 billion in coupon payments. This additional cost of borrowing arguably represents a penalty from the markets that could be applied to offer better development prospects.
Appendix A. Context for the sovereign bond issues
The numbers above fail to do justice to some of the most interesting questions raised in the paper’s introduction - why do countries borrow from private markets? What are the proceeds used for? How are the bonds they issue received on the international debt markets? This appendix provides some of the background, gathered from news sources and official documents on each of the African sovereign bonds issues that form the subject of this paper. The context provided helps with interpreting the paper’s main questions and conclusions. In all, excluding South Africa, there have been 24 bonds issued by a dozen sub-Saharan countries between 2006 and 2014. A selection of these are discussed.
A.1. HIPC countries
A.1.1. Ghana
$750 million October 2007
and $750 million August 2013
Ghana’s inaugural sovereign bond was oversubscribed. It received $3.2 billion in bids for its $750 million issue, which pays a coupon rate of 8.5% (Stiglitz and Rashid, 2013). The markets seemed to think the issue was overpriced at that time, as the yield fell 343 basis points in secondary trading to reach 4.82% by early May of 2013.
| Country | Year | Coupon type | Coupon at issue | Issue date | Tenor |
|---|---|---|---|---|---|
| Cote d’Ivoire | 2009 | Step-up | 5.75 | 31-Dec.-09 | 23 |
| Cote d’Ivoire | 2014 | Fixed | 5.375 | 23-July-14 | 10 |
| Congo | 2007 | Step-up | 3.5 | 30-Jun.-07 | 22 |
| Ethiopia | 2014 | Fixed | 6.25 | 11-Dec.-14 | 10 |
| Gabon | 2007 | Fixed | 8.2 | 12-Dec.-07 | 10 |
| Gabon | 2013 | Fixed | 6.375 | 12-Dec.-13 | 11 |
| Ghana | 2007 | Fixed | 8.5 | 4-Oct.-07 | 10 |
| Ghana | 2013 | Fixed | 7.875 | 7-Aug.-13 | 10 |
| Ghana | 2014 | Fixed | 8.125 | 11-Sept.-14 | 12 |
| Kenya | 2014 | Fixed | 6.875 | 24-Jun.-14 | 10 |
| Kenya | 2014 | Fixed | 5.875 | 24-Jun.-14 | 5 |
| Namibia | 2011 | Fixed | 5.5 | 3-Nov.-11 | 10 |
| Nigeria | 2011 | Fixed | 6.75 | 28-Jan.-11 | 10 |
| Nigeria | 2013 | Fixed | 5.125 | 12-Jul.-13 | 5 |
| Nigeria | 2013 | Fixed | 6.375 | 12-Jul.-13 | 10 |
| Rwanda | 2013 | Fixed | 6.625 | 2-May-13 | 10 |
| Senegal | 2009 | Fixed | 8.75 | 22-Dec.-09 | 5 |
| Senegal | 2011 | Fixed | 8.75 | 13-May-11 | 10 |
| Senegal | 2014 | Fixed | 6.25 | 30-July-14 | 10 |
| Seychelles | 2006 | Fixed | 9.125 | 3-Oct.-06 | 5 |
| Seychelles | 2010 | Step-up | 5 | 1-Jan.-10 | 16 |
| Tanzania | 2013 | Floater | 6.332 | 8-Mar.-13 | 7 |
| Zambia | 2012 | Fixed | 5.375 | 20-Sep.-12 | 10 |
| Zambia | 2014 | Fixed | 8.5 | 14-Apr.-14 | 10 |
List of African sovereign bond issues: 2006–2014.
According to the Ghanaian press, the funds from the issue were invested in energy and transport infrastructure, as intended. The published documents suggest that the government spent 68% of the disbursed proceeds on the country’s energy sector, 12% on roads, 7.4% on the purchase of 2.2 million shares in the AngloGold Ashanti gold mining corporation of South Africa, 5.6% on a purchase of crude oil by the Volta River Authority, 1.9% on railways, 1.9% on the bond’s first coupon payment and 0.9% to meet the government’s payroll obligations for the month of November, 2007. Of the proceeds spent on the energy sector, approximately 38% of total proceeds went to the Volta River Authority, 18% to the Electricity Company of Ghana, 7.2% to the Bui Dam project and 4.5% to purchase an equity investment in the West Africa Gas Pipeline (Ghanaweb, 2012).
The success of the first bond issue appeared to make the case for a second foray to the international debt markets. It made financial sense; the yield on the foreign bonds were 5% in April 2013 while yields on government bonds issued on the domestic market exceeded 20% in 2012. By the summer of 2013 a plan to issue a second tranche of debt on the private markets was approved by the Ghanaian legislature, motivated in part by the need for infrastructure investment (IOL, 2013).
On August 7, 2013 Ghana issued a 10-year Eurobond. The intended target of a $1 billion issue was revised to $750 million at a yield of 7.875%, in response to the market. This was not as oversubscribed as the first issue. The government received $2.2 billion of bids, for a bid-cover ratio of approximately 3:1 (Sulaiman and Kopodo, 2013). The market’s response may have been due to the government’s 2012 fiscal deficit, which was nearly 12% of GDP. The yield on Ghana’s previous bond issue hovered around 6% at the time of the second issue. The government announced plans to spend the proceeds on ports and electrical infrastructure.
Ghana issued yet another Eurobond on September 11, 2014. It reached its target of $1 bn at a coupon rate of 8.125% — lower than expected given its fiscal difficulties. It was oversubscribed at a 3:1 ratio. The issue was a soft amortizing bond, amortizing in years 2024, 2025 and 2026 with principal repayment in three installments of $333 million in 2024 and 2025 and $334 million in 2026. The timing was just prior to its negotiations with the IMF, and was viewed by many to strengthen its bargaining position (Bigg and Kopodo, 2014). According to the Ghana government the $1 billion will fund capital expenditure in the 2014 Budget, support pipeline projects and refinance domestic and external debt. Clearly the IMF was not too pleased. Following the issue:
Managing Director of the International Monetary Fund (IMF), Christine Lagarde, has cautioned African countries against piling up debts through excessive bonds issue. According to her, unless Ghana and other African states are borrowing from the international market to finance infrastructure, Eurobonds may not be a good thing. ‘I think it (Eurobonds issues) should be done with measure like everything. No excess, no abuse’, she said. (Business News of Saturday, 2014).
At the end of 2012, Ghana’s external debts stood at 30.5% of GDP; private debts were 21% of the external debt portfolio. The total foreign-currency debt represented 66% of exports in 2013, compared to 551% near the end of Ghana’s economic crisis in 1984 (World Bank, 2013).
A.1.2. Republic of Congo
$480 million June 2007
This bond was issued as part of a sovereign debt restructuring negotiation between Congo. and its private-sector creditors. Congo defaulted on its foreign debt in 1985, and by 2004 principal, interest and penalties totaled more than 200% of GDP. In 2006, Congo reached the decision point of the Heavily Indebted Poor Countries initiative and thus became eligible for participation in the debt relief program. It negotiated bilateral debt relief with its Paris Club creditors, and soon began discussions with its private creditors as part of the HIPC initiatives requirements.
Congo issued a sovereign bond on terms negotiated with its creditors, whose expenses it paid during the negotiation process. The bond that resulted from these negotiations was fairly intricate, with terms crudely summarized as follows: The exchange of principal and related eligible interest for twenty-two-year securities, amortized in thirty-four semi-annual installments growing from 1% in year five to 4% in year eighteen, with a fixed annual interest rate rising from 2.5% for the first year to 6.0% after the tenth year. 92% of the private creditors approved this debt exchange deal, in what seemed an acceptable exit strategy from 20 years of default(Richards, 2010).12
At the end of 2012, Congo’s external debts stood at 21% of GDP, of which private debts were 36%. The external debt to GDP ratio was 158% in 2003(World Bank, 2013).
A.1.3. Senegal
$200 million December 2009
and $500 million May 2011
Senegal was the only African sovereign to issue a bond in the crisis years of 2008–2009. Borrowing at a time of tight global credit markets, the Senegalese government issued as its first sovereign bond a five-year Eurodollar bond in a $200 million issue at a yield of 9.473%. Two years later, at a time of easier credit, Senegal updated its credit rating and issued a second bond to extend, enlarge and refinance the first. By exchanging old bonds for new, the Senegalese government extended the maturity of its sovereign bond from five years to ten, enlarged its sum from $200 million to $500 million, and reduced its yield by 35 basis points, to 9.125%. The second issue was heavily oversubscribed, with total bids that came to $2.4 billion (Minney, 2011).
To hedge against the exchange rate risk inherent in borrowing in a foreign currency, Senegal entered into a euro-dollar swap deal with a South African bank at the time of the bond issue. The World Bank’s Multilateral Investment Guarantee Agency, or MIGA, guaranteed Senegal’s payment obligations under this swap deal. As a member of the West African Economic and Monetary Union, Senegal’s currency is the CFA franc, which is pegged to the euro. That peg ensures that the euro-dollar exchange rate drives most of the exchange rate risks associated with Senegal’s dollar debts.
Senegal tapped the sovereign debt markets for another bond issue in July 2014. Senegalese President Macky Sall, before the bond was issued had announced, “It’s for infrastructure projects.” The issue was 7 times oversubscribed, leading to a drop in the coupon rate from 6.625% to 6.25%.13 {Economist Intelligence Unit, July 24 2014.}
The high coupon payments on the previous bond issues left the Senegalese government few options until global interest rates fell and investor confidence in the leadership and stability of the political system grew. Timing seems to be the main question.
At the end of 2012, Senegal’s external debts stood at 38% of GDP, of which private debts were 7%. The total foreign-currency debt represented 147% of exports in 2012, compared to the 241% about the time it started debt restructuring under the HIPC’s initiative in the previous decade (World Bank, 2013).
A.1.4. Cote d’Ivoire
$2.3 billion March 2010 and $187 million November 2012
The Ivoirian bond issue of 2010 is by far the largest ever by a country from sub-Saharan Africa, (with the obvious exception of South Africa). It amounts to more than double the second-largest issue (that of Gabon in 2007). That said, the amount is only large in comparison to other African countries.
The bonds were issued to resolve past defaulted loans as part of the HIPC debt relief process. The 2010 Eurobond was exchanged for defaulted Brady bonds (themselves issued in a 1998 debt restructuring). This bond exchange involved a 20% discount as debt relief and concessional terms including a grace period of 2.5% annual interest, and a concessional rate that began in 2012 to rise slowly toward a final interest rate of 5.75%(IMF, 2012). The Ivoirian government had been in default almost continuously since 1983.
In the November that followed the first bond issue, incumbent Ivoirian president Laurent Gbagbo lost his bid for reelection but refused to concede, plunging the country into civil war. In January of 2011, the Ivoirian government defaulted on a $29 million coupon payment to Eurobond holders. The next month the yield on the defaulted bond surged to 18% in the secondary market. The civil war continued until Gbagbo was arrested in April and power transferred fully to Alassane Ouattara. In all, the government defaulted on three coupon payments totaling about $96 million.
The new president moved quickly to reassure foreign bondholders that all their arrears would be paid in full. In June of 2012, his government paid the scheduled coupon of $43.7 million, followed soon by a good faith payment of $2.1 million toward outstanding arrears. In October, the government made a proposal to bondholders regarding arrears, and in November Cote d’Ivoire rolled these arrears over into a new $187 million bond issue that spreads the three missed coupon payments out over the following two years. By January 2013, the country’s sovereign bond yield in the secondary market had fallen below 6.5%. In July 2014, the country successfully raised an additional $750 million on the bond markets. The bond issue was heavily oversubscribed, with nearly $8.5 billion in bids (EIU, 2014).
At the end of 2012, Cote d’Ivoire’s external debts stood at 40% of GDP, compared to 89% in 2003 (World Bank, 2013). The IMF Debt Sustainability Analysis for Cote d’Ivoire predicts that the debt-to-GDP ratio will decline(IMF, 2012).
A.1.5. Zambia
$750 million September 2012
The Zambian bond issue was vastly oversubscribed. This may have been simply due to timing; Zambia issued its bond on the day after the US Federal Reserve announced the third round of quantitative easing. At that time, both S&P and Fitch had Zambia at only a B+ credit rating, highly speculative” in layman’s terms. Furthermore, Zambia derives 77% of its total export receipts from copper, a commodity for which the standard deviation of prices in 2001–2010 was five times the same measure in 1981–2000. Nevertheless, the Zambian government’s initial offer of a $500 million bond issue was greeted by $11.9 billion of bids, an initial bid cover ratio of almost 24. The government decided to increase the issue to $750 million and paid only 5.625% interest, for a spread of only 384 basis points over U.S. Treasuries (Republic of Zambia, 2012; IMF, 2013c).
To illustrate the effect of timing, Spain had a credit rating four grades higher was paying 5.78% to borrow new funds at that time. The extensive roadshow which the government undertook to advertise the upcoming debut bond issue to prospective buyers may also have contributed to the success of the launch.
The stated purposes of the bonds were investments in the transportation and energy sectors (IMF, 2013c). ZESCO, the Zambian state electricity company, received $255 million of the proceeds and will invest $186 million in the Kafue Gorge Lower hydroelectric dam project, expected to generate 750 MW when completed in 2017, and $69 million to improve the distribution network. $120 million was allotted to Zambian Railways. In the first quarter of 2013, the Zambian government disbursed $289 million of the bond proceeds, and in June the secretary of the treasury reported that $94 million was still on hand(Kunda, 2013; Lusaka Times, 2013). The delays in spending the funds procured through the bond issue may suggest that the Zambian government was not fully prepared to invest $750 million at the end of 2012. The Zambian government later issued two more bonds: one in April 2014 for $1 billion, and a second in July 2015 for $1.25 billion at the high coupon rate of 9.375% (Cox, 2015).
At the end of 2012, Zambia’s external debts stood at 26% of GDP, of which private debts were 15%. The total foreign-currency debt represented 56% of exports in 2012, compared to 559% in 2003 (World Bank, 2013).
A.1.6. Tanzania
$600 million February 2013
Tanzania’s intention to issue a bond had been declared for years (Ngwanakilala, 2010). Since 2008, successive Tanzanian administrations announced plans to get a credit rating in order to sell a Eurobond, made preliminary inquiries toward acquiring a credit rating, and returned to the cycle of announcements and inquiries in the following year. One may deduce that the bond markets did not offer Tanzania favorable terms.
In February 2013 the government issued $600 million of unrated, unlisted Eurobonds in a private placement. Several features of this transaction are remarkable: the bond was issued without a credit rating, which excludes investors unwilling to buy unrated debt. It is the first floating rate note issued by sub-Saharan country in this wave of borrowing from the bond markets. Rather than a constant interest rate set at the time of issue, the Tanzanian government pays LIBOR plus 600 basis points 10. The floating rate guarantees the investor a minimum return set by the LIBOR while exposing the borrower to coupon payments that go as high as the LIBOR would go. The bond issuers also excluded US investors — it was not registered under the required US Securities Laws. The reduced potential demand may have contributed to the relatively high interest rate Tanzania pays on this bond.
An IMF staff report described the purpose of the bond issue as “financing capital projects”(IMF, 2013c). The Tanzanian government announced plans for additional borrowing from the private markets in June 2013. These are intended for a natural gas pipeline. At the end of 2012, Tanzania’s external debts stood at 41% of GDP, of which private debts were 5%. The total foreign currency debt represented 138% of exports in 2012, compared to 338% in 2003(World Bank, 2013).
A.1.7. Rwanda
$400 million April 2013
Rwanda’s inaugural bond issue was so oversubscribed that the government considered extending the size of the bond, before it finally settled on the original offer amount. The $400 million the bond issue was met with a $3.5 billion order book, for a bid-cover ratio of over 8:1 (Sulaiman, 2013). This gave the government an opportunity to increase the size of its bond issue. That opportunity was declined according to the Finance Minister, because there were no other well-identified profitable investment opportunities and because the government feared accumulating unsustainable debt (Kwibuka, 2013).
Rwanda planned to spend $50 million to build a hydroelectric power plant, and $150 million to finish building the Kigali Convention Centre. The other half of the bond proceeds were to improve the state airline, RwandAir, and repay loans previously contracted to build the convention center (Kay and Pronina, 2013). At the end of 2012, Rwanda’s external debts stood at 17% of GDP, of which none was private debts. The total foreign-currency debt represented 136% of exports in 2012, compared to 997% in 2003 (World Bank, 2013).
A.2. Non-HIPC countries
A.2.1. Seychelles
$200 million September 2006
$30 million August 2007
$168 million February 2010
Seychelles 2006 issue of private debt on the international markets met with initial success. There are no numbers to define the level of success, but the more relevant question is whether the debt is sustainable.
To settle other debts, the Seychellois government secured a B rating with a stable outlook from Standard & Poor’s in 2006, and on that basis issued Eurobonds to the tune of $200 m. The bid-cover ratio was not disclosed. With the proceeds of that bond, the government restructured existing foreign debt and paid off sovereign arrears, principally to the African Development Bank, the World Bank, the European Investment Bank and a private creditor, Tokyo Bank Mitsubishi Ltd. (Central Bank of Seychelles, 2007).
In August 2007, Seychelles issued an additional $30 million Eurobond to bolster foreign currency reserves. The level of debt appears to have contributed to Seychelles’ debt crisis in 2008(Government of Seychelles, 2011). At that point, public debt was to 151% of GDP. This was in the face of declining revenue from European tourists, as Europe was going through the beginnings of its own crisis. Its current account deficit in 2008 was 52% of GDP.
Seychelles defaulted on payments due July 1, 2008, and its S&P rating fell from CCC to SD. The terms of existing foreign debt were renegotiated into a new bond package. Bond-holders agreed to cancel half of the face value of the debt and reschedule the other half into a new, 16-year Eurobond with an increasing interest rate, a 2026 maturity and a six-year grace period.
At the end of 2012, Seychelles external debts stood at 179% of GDP, of which private debts were 12%. The debt GDP ratio in 2003 was 62% (World Bank, 2013).
A.2.2. Gabon
$1 billion December 2007
$1.5 billion December 2013
Like Cote d’Ivoire and the Republic of Congo, Gabon issued a Eurobond to its existing creditors to exchange new debt for old at a discount. Through a combination of this $1 billion Eurobond, a CFAF 81.5 billion bond in January 2008, and a loan from the Central Bank of West African States, Gabon prepaid $1.6 billion of bilateral loans, or 86% of its Paris Club debt, at a total discount of CFAF 130 billion, equivalent to a discount of about $291 million. These transactions decreased the government’s external debt from 32.5% of GDP to 15% (IMF, 2009, 2013b).
Gabon’s second bond issue scaled up to $1.5 billion, priced to yield 6.375% (Financial Times, 2013), almost 2% below the previous issue’s coupon of 8.375%. The prospectus states that the funds are for the development of roads, transport infrastructure and a dam. The projects are part of the Gabonese government’s plans to diversify the economy away from oil, which accounts for almost half of GDP. The rest of the funds should buy back the balance on the previous bond issue.
At the end of 2012, Gabon’s external debts represented 27% of exports, compared to 113% in 2003. 54% of these debts were private (World Bank, 2013).
A.2.3. Nigeria
$500 million January 2011
and $500 million July 2013 — 10 year term
and $500 million July 2013 — 5 year term
It is not clear to a lay observer that Nigeria needs to borrow. Nigeria exported $86 billion of crude oil in 2011. Some reports suggest that the bond issues were to gain the attention of potential foreign investors. Eurobond yields on the secondary market were also supposed to provide an objective measure or benchmark for the country’s risk (IMF, 2013c). This should in principle, help liquidity in the domestic bond market (Panizza, 2008).
The 2011 bond issue was oversubscribed 2.6 times at a yield of 7.1%. Given that the Nigerian bond market has now grown to the largest in sub-Saharan Africa, the state may have succeeded in its goal of stimulating its domestic private bond market.
The stated purpose of the subsequent $1 billion, dual-tranche issue of sovereign bonds, half with a 5-year term and half with a 10-year term, is to finance power projects (Kay, 2013). At that time, the government had $7 billion in its Excess Crude Account, which buffers government spending against fluctuations in revenue due to oil price volatility, plus a $1 billion sovereign wealth fund. The desire to create a yield curve may have motivated the separate 5- and 10-year notes. Lower yields would be paid on the loans with the shorter term, and the difference between the two borrowing costs provides a tangible measure of risk for the borrower.
The issue as a whole was oversubscribed by a factor of 4. The issuer received bids of $1.77 billion for the 5-year bond, at a yield of 5.375%, and $2.26 billion for the 10-year bond, at a yield of 6.625%. At the end of July 2013, Eurobonds accounted for about 19% of the Nigerian government’s foreign debt (Nigeria Debt Management Office, 2013).
At the end of 2012, Nigeria’s external debts stood at 4% of GDP, of which 5% was private debts. The total foreign-currency debt represented 7% of exports in 2012, compared to 127% in 2003(World Bank, 2013).
A.2.4. Namibia
$500 million October 2011
Namibia got coupon rates of 5.75% at issue on its sovereign debt, surprising given its good credit ratings, and the $2.7 billion in bids received, for a bid-cover ratio of 5.4. The much poorer and lower-rated Zambia would get better credit terms when it issued bonds a year later. That said, on the same day, Italy also issued debt but paid 6% on bonds of the same tenor. Timing seemed critical to the coupon commitments that issuers received.
The bond was issued for the purposes of lender diversification, benchmarking and attracting foreign investment. The proceeds of the bond paid for a part of the Targeted Intervention on Employment and Economic Growth, which was a three year, $14.7 billion fiscal stimulus program intended to reduce the country’s chronically high unemployment rate by creating 104,000 new jobs in the country through public works and infrastructure spending (Bank of Namibia, 2012).
Namibia’s external debts are not available in the development indicators database (World Bank, 2013).
A.2.5. Angola
$1 billion August 2012
Angola has issued no Eurobonds. Here is the backdrop to this entry (Ramnarayan, 2012):
- •
The government of Angola borrowed $1 billion from VTB Bank of Russia in August 2012.
- •
VTB Bank created a special purpose vehicle called Northern Lights III B.V.
- •
Northern Lights III issued to select buyers $1 billion of loan participation notes with a 7% coupon in a private placement. The coupon payments on the bond will be drawn from the Angolan government’s payments to VTB.
The unusual structure of this issue — a synthetic bond issued by a bank, not a sovereign, through a special-purpose vehicle in a private placement, shields information about why the government of Angola wanted to borrow $1 billion, how it was received by the market and how it spent the proceeds. At the end of 2012, Angola’s external debts stood at 19% of which 38% was private debt. The total foreign-currency debt represented 32% of exports in 2012 compared to 94% in 2003 (World Bank, 2013).
Footnotes
We are grateful to Andrew Jensen and Samantha Cunningham for their research assistance and the feedback from the editor of the JAT and an anonymous reviewer.
Sources that describe the oversubscription of these bond issues include Sulaiman (2012a, 2012b) for Zambia and Kenya.
There is significant overlap between the 49 countries categorized as SSA and the 39 HIPC countries. SSA is home to 34 of the HIPC participants — countries subscribed to internationally managed debt relief schemes to relieve poverty. Selection into the HIPC program is based on per capita income and IDA eligibility (IMF, 2013a; Birdsall et al., 2002).
The Commission on Africa convened by British Prime Minister Tony Blair recommended a $75 billion hike in aggregate public spending in the region as a condition for meeting the Millennium Development Goals. The Commission’s number included proposals to double annual public investment in infrastructure to approximately $40 billion. Against this funding gap, on must consider that in 2011, government budget deficits totaled 3.1% of GDP for the African continent.
In principle, the borrowing rates of a country with the option of concessional lending from the International Financial Institutions should be lower if the option of low-cost funds is a potential bargaining tool. This is not evident from the data.
The ratings data required combining two historical releases that showed the bond ratings given to countries and the dates when those ratings were given. See (https://www.fitchratings.com/web_content/ratings/sovereign_ratings_history.xls) for ratings. This shows a country’s rating on the day a specific bond was issued.
The country of issue is determined from each bond’s ISIN identifier; the first two characters of the ISIN indicate the country in which the bond was issued (XS may also be used as a generic indicator bonds issued on the international markets).
US Treasury numbers are available for 1-,2-,3-,5-,7-,10-,20- and 30-year tenors. To calculate the spread, the tenors for each bond in the sample are rounded to the nearest US treasury tenor.
This paper takes the position that investors and governments take their GDP data as is, because no other measure is available. This disclaimer is necessary in the light of evidence that GDP in many African countries is often mis-measured (Jerven, 2013); Ghana and Nigeria recently had significant increases in GDP because of recalibration or measurement exercises. Past mis-measurement of GDP does not bias our regression estimates if lenders and borrowers do not use alternative measures of economic size.
GDP and GDP per capita are NYGDPMKTPCD and NYGDPPCAPCD respectively in the WDI database; these are transformed to logs. The change on the prior year is also included to check whether trends in these variables are correlated with making bond issues. Foreign reserve is measured as the ratio of the WDI indices (FIRESTOTLCD/NEIMPGNFSCD). Trade surplus is measured as the difference between imports and exports in dollar terms, divided by the sum of exports and imports. Past borrowing is measured as the share of concessional lending in total external debt (DTDODALLCCD/DTDODDECTCD), and debt as a share of GDP (DTDODDPPGCD/NYGDPMKTPCD).
Estimating the yield on complex coupon and zero coupon bonds would be problematic, as the structure of these bonds change the risk proposition significantly for borrowers and lenders. Only 1 zero coupon issue was issued by an African government in the sample, so this category is ignorable.
The letter ratings were included as categorical variables. While the coefficients are not shown, higher ratings consistently predict lower spreads in all the regressions reported in the table. No ratings were available for Tanzania, Seychelles in 2006, Cote d’Ivoire and 20 of the bond issues selected for testing
To handle its defaulted debt to private creditors, Congo had the option of making a unilateral exchange offer along the lines of those extended by Pakistan, Ukraine and Ecuador in 1999. The debtors unilateral offered in such a scheme only required a certain majority of the creditors to accept the terms on behalf of all private creditors, empowered by the Common Action Clause (CAC) in the original loan terms. Set against the option of a unilateral offer, it is possible to justify Congo’s consensual negotiated resolution with its creditors. Its oil revenues deposited in foreign bank accounts are vulnerable to writs of attachment issued by foreign courts in response to lawsuits, which many of Congo’s creditors had filed and won. In the absence of a negotiated debt restructuring, the risk of losing export revenue to lawsuits appeared non-trivial
Wall Street Journal June 28, 2013; Economist Intelligence Unit, July, 24, 2014 and put it on next page after “political system grew.”
References
Cite this article
TY  - JOUR
AU  - Michael Olabisi
AU  - Howard Stein
PY  - 2015
DA  - 2015/11/18
TI  - Sovereign bond issues: Do African countries pay more to borrow?☆
JO  - Journal of African Trade
SP  - 87
EP  - 109
VL  - 2
IS  - 1-2
SN  - 2214-8523
UR  - https://doi.org/10.1016/j.joat.2015.08.003
DO  - 10.1016/j.joat.2015.08.003
ID  - Olabisi2015
ER  -