
Modelling the economic impact of the tripartite free trade area: Its implications for the economic geography of Southern, Eastern and Northern Africa☆
- DOI
- 10.1016/j.joat.2017.05.003How to use a DOI?
- Keywords
- F13; F15
- Abstract
This study evaluates the economic impact of the proposed COMESA-SADC-EAC Tripartite Free Trade Area (TFTA) on 26 African countries. It uses the Global Trade Analysis Project (GTAP) computable general equilibrium (CGE) model and database to measure the static effects of the establishment of the TFTA on industrial production, trade flows and consumption in the TFTA. The results indicate a significant increase in intra-regional exports as a result of tariff elimination, boosting intra-regional trade by 29%. Particularly encouraging is the fact that the sectors benefiting most are manufacturing ones, such as light and heavy manufacturing, and processed food. Concerns have been raised that industrial production in the TFTA could concentrate in the countries with highest productivity levels - namely, Egypt and South Africa. Simulation results suggest that these fears are exaggerated, with little evidence of concentration of industries in the larger countries.
- Copyright
- © 2017 Afreximbank. Production and hosting by Elsevier B.V. All rights reserved.
- Open Access
- This is an open access article under the CC BY-NC license (http://creativecommons.org/licences/by-nc/4.0/).
1. Introduction
Negotiations for the formation of a Tripartite Free Trade Area (TFTA) between three existing regional economic communities - the East African Community (EAC), the Common Market for Eastern and Southern Africa (COMESA), and the Southern African Development Community (SADC) – have now been ongoing since the first TFTA summit held in Kampala in October 2008. In a decisive move forward at a meeting held in June 2015 in Egypt, the member states of the three blocks agreed to move forward to the establishment of a TFTA.1,2
The implications in economic terms for the countries involved are potentially enormous - the TFTA involves 26 (almost half of all African) countries, spanning the whole Eastern side of the continent from the Cape to the North African coast. If fully implemented, it would create Africa’s largest free trade area. The TFTA area currently has a total population of 683 million people and a combined Gross Domestic Product (GDP) of USD 1.2 trillion at market exchange rates of 2015 (World Bank, 2016). This represents more than half (54.3%) of the Africa’s total GDP, and 58% of Africa’s population.3 The TFTA thus constitutes a very significant market by any standards and collectively places the block as the 14th largest economy in the world.
As with most regional integration schemes, the underlying economic rationale of the agreement is to provide greater opportunities to reap economies of scale, greater competition, a more attractive internal market for investment (both foreign and domestic), and an acceleration of intra-regional trade. As stressed by the EAC (2014) on the TFTA, “in opening our markets to each other, the development of regional value chains will be enhanced. We would increase intra-Africa trade, stimulate economic growth and lift people out of poverty”. Beyond that, the agreement also has a great symbolic importance – the TFTA is expected to serve as the basis for the completion of a Continental Free Trade Area (ostensibly to be completed by 2017), with the aim of boosting trade within Africa by 25–30% in the next decade, and ultimately establishing a continental-wide African Economic Community.
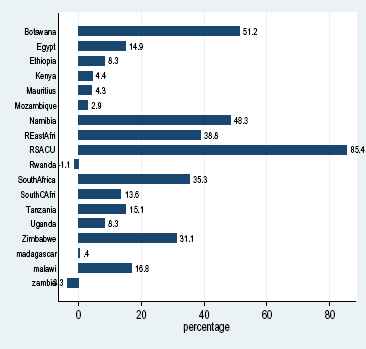
It needs stressing that the current levels of intra-regional trade are low – in COMESA, intra-regional trade has oscillated in recent years between just 5–10% of total trade, and for SADC, intra-regional trade was actually declining in the early 2000s (from around 15 to11 percent) (principally due to the sharp rise in commodity exports from the SADC region to the rest of the world) (Fig. 1). The EAC has been more successful in maintaining a relatively high level of intra-regional trade (between 18 and 20% of total trade since 2008), but pointedly the share has not been growing significantly over the last decade. By 2014, intra-regional trade within the TFTA accounted for just 16.7% of total trade of the 26 TFTA members.
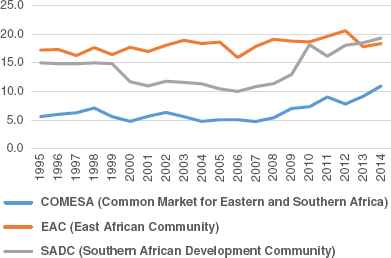
Intra-Regional Trade as a percent of Total Trade, 2000–2014.
Source: UNCTAD (2016)
Compared with an integrated area like the European Union, where intra-regional trade already represented around two-thirds of total trade at the onset of the European Single Market in 1993, it can be appreciated that, regardless of the differences in geography (above all, the much larger geographic span of the TFTA) and the constraints to trade because of serious infrastructural deficits, there is the potential for a significant increase in the volume of intra-regional trade under the TFTA.
A particularly pertinent question is what will be the economic geography implications of these changes. At the time of implementing the European Single Market in the early 1990s, there was a rush in academic interest in how it might impact on different member states and the implications for the location of industry across the integrated block (e.g. Corado, 1990; Krugman and Venables, 1990; Krugman, 1991). This reflected concerns that the Single Market might result in a concentration of industry in the ‘core’ countries of the EU (Germany, France, Belgium, Luxembourg, and the Netherlands) to the detriment of the more peripheral countries like Spain, Portugal, Ireland and Greece.
Such concerns are equally legitimate within the TFTA - not only does it span an enormous geographic area, but the existing economic geography is highly uneven. GDP within the block is not evenly distributed – indeed, the two largest economies (Egypt and South Africa) together account for more than 50% of the TFTA’s total GDP. The seven largest economies (South Africa, Egypt, Angola, Sudan, Ethiopia, Kenya and Tanzania) together account for more than 80% of the GDP of the total area, the remaining 19 countries accounting for just one-fifth (Fig. 2).
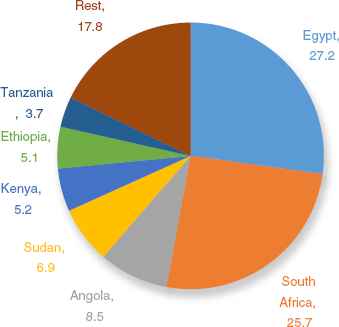
Share of GDP between 26 Members of the Tripartite Area, %, 2015.
Source: Own Elaboration from World Bank (2016)
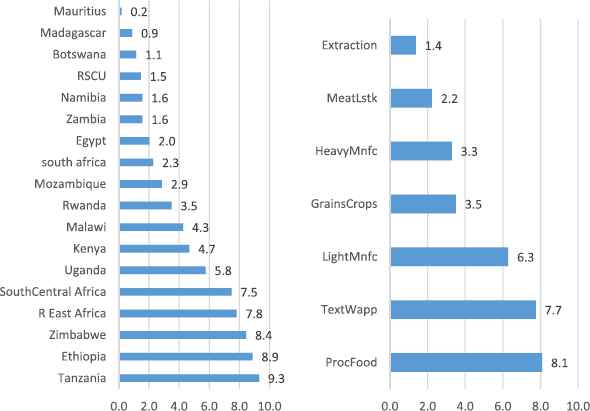
Perhaps even more striking from an economic geography perspective is the extent to which manufacturing capacity is unevenly distributed across the TFTA. Two thirds of manufacturing value added produced within the TFTA are accounted for by South Africa and Egypt alone (Fig. 3). At a time when industrialisation has risen sharply up the agenda of priorities for African states (UNECA, 2015), this raises fears that the free trade area could result in a polarisation of the benefits at the two geographical extremes, at the expense of the relatively weak and undeveloped manufacturing sectors in rest of the TFTA.
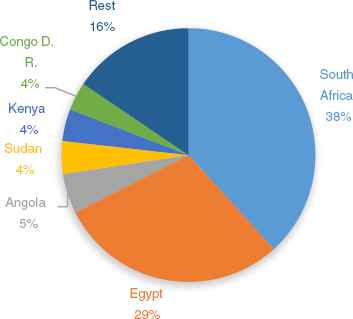
Share of tripartite manufacturing value added, percent, 2015.
Source: UNIDO (2017)
Compounding such concerns is the fact that average productivity differences (as reflected in average GDP per capita) between the richest and poorest members of the TFTA are enormous. The richest TFTA member in 2015 (Seychelles) had an average GDP per capita more than 56 times that of the poorest member (Burundi) (Appendix Table 1). South African and Egyptian per capita GDP was 20 and 13 times larger than Burundi’s. If we compare these differences with those existing in the EU-12 at the time of the formation of the Single Market Programme (SMP) in 1993, it will be noted that the scale of the gap is several multiples in the TFTA (Appendix Table 2).
Another key challenge in the establishment of the TFTA is the elimination or reduction of Non-Tariff Measures (NTMs). Trade costs within the TFTA have been declining over recent decades, with tariffs falling as a result of multilateral, regional and bilateral trade liberalisation. However, NTMs have not declined at the same pace as tariffs and consequently countries in the region have not the realised the full benefits of integration.4 Some NTMs are employed as tools of trade policy (e.g. quotas, subsidies, and export restrictions), while others stem from non-trade policy objectives (e.g. technical measures). The TFTA has a relatively high incidence of such non-tariff measures, even when compared to the rest of Africa. According to what must be admittedly incomplete WTO data,5 TFTA countries account for as much as 87% of (recorded) NTMs within Africa. Again, however, the geographical distribution of NTMs within the TFTA is uneven. Technical barriers and phytosanitary measures to trade are the most common NTMs, with four countries - Uganda, Kenya, South Africa, and Egypt - accounting for 86% and 72% of reported NTMs, respectively (See Appendix Table 3).
Against this backdrop, the purpose of this paper is to evaluate the economic effects of the proposed TFTA on industrial production, trade, and consumption across the member states. It focuses on the effects of the TFTA on the economic geography of the region. While several studies have explored the welfare effect of trade integration in Africa, very few specifically study the impact of integration on economic geography. The paper aims to improve our understanding of the economic impact of the TFTA in the region, as well as the distribution of benefits among member countries. The results have important implications for regional trade and industrial policy.
The paper is organised as follows: the second section provides an overview of the theoretical literature regarding industrial geography focussing on recent contributions collectively know as the ‘new economic geography’ and discussing its possible implications to the TFTA. The third section reviews the relevant empirical literature studying the impact of regional integration within the African continent. The fourth section describes the computable general equilibrium (CGE) model and methodology used for the simulations. The fifth section presents the results of the simulation and discusses the results. The final section makes some concluding observations.
2. The “New Economic Geography” and its relevance to the TFTA
In the 1990s there were a number of interesting attempts to formalise models which analyse spatial patterns of economic activity, attempts which collectively became known as the “New Economic Geography” (NEG). Contributions to this literature (e.g. Krugman and Venables, 1995; Baldwin, 1999) developed an (ostensibly) novel approach to the way we think about location - the emphasis being on agglomeration, on the way in which firms tend to cluster together and how regions are formed. The distinctive trait of these models was that, in contrast to the partial equilibrium models which characterised most previous analysis of industrial location, these newer contributions involved full general-equilibrium models. Wherein resource constraints were incorporated, the geographical distributions of population, demand and supply were made endogenous. The two-way feedback between location decisions by individual agents and these distributions became the focal point of interest (Krugman, 1998).
Krugman’s (1991) model of economic geography explicitly addresses itself to the likely impact that economic integration can have on the geographical distribution of industry, emphasising the trade-off between fixed costs, economies of scale and transport costs. It is developed in a general equilibrium framework with linear demand, cost functions and resources endowments, plus imperfect competition as a justification for trade. The specifications of the model, together with some comments on the effect of changes in some of the parameters, can be found in the aforementioned article. The general conclusions which can be drawn from the model are, however, easily resumed. Krugman distinguishes between two regions, a centre and periphery. Before integration, trade costs are presumed to be high, and thus the distribution of manufacturing industry is dispersed between the two regions. After integration, however, trade costs fall, provoking a relocation of industry. Exactly how industry relocates depends on the relative importance of both trade costs and the prevalence of scale economies. Were trade costs to fall to negligible levels, then the periphery may well benefit from the process of integration. Firms would be attracted to the lower costs of the periphery and would not have to face any additional access costs from being located there. But the outcome is more complicated at intermediate levels of transport costs (Fig. 4).
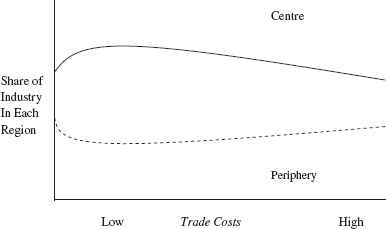
Distribution of manufacturing industry between centre and periphery.
Source: Adapted from Krugman and Venables (1990)
If regional integration is an imperfect process, and trade costs remain considerable, Krugman hypothesizes a situation whereby it may pay to concentrate production at the location with higher costs but better market access, so as to take advantage of scale production economies. Because of the difficulty of reducing trade costs to a negligible level, Krugman foresaw the possibility of a sizeable re-allocation of industry in favour of the centre, and away from the periphery, when trade liberalisation is incomplete. Although peripheral countries are unlikely to lose overall from the formation of a regional market (because the impact of lower consumer prices is felt no matter where the production of goods takes place), there is thus a possibility that richer regions will gain most because of their enhanced attractiveness as locations for those industries (Barry, 1996: 348).
The conclusion that some authors (for example, Corado, 1990) drew is that it is necessary to deepen the integration process, so as to lower the costs of market access from the periphery and thereby make peripheral regions more attractive. Crucially, however, this interpretation relies on one’s conception of whether or not trade or non-trade barriers can be eliminated, or at least minimised so as to have a negligible effect. If it is believed that significant barriers will remain, then, following the “second-best theorem”, it may be better for peripheral countries to resist further integration.6 Indeed, other authors (e.g. Barry, 1996; Dignan, 1995) drew a quite different conclusion to that of Corado, warning that dedicating too many resources towards the development of transport infrastructure in the periphery could theoretically have a negative impact on the locational advantages of the peripheral regions. The advantages of a central location for industries where increasing returns are dominant would still not be overcome, and the improvement of transport provision in peripheral areas would simply facilitate access for centrally-located firms to sell their goods there. This represents a powerful and polemical argument.7
Although most of the initial applications of the ‘new economic geography’ were confined to European integration, the findings have some direct relevance to the countries of the TFTA too. Countries in the region are actively engaged in trying to reduce both transport costs, through improved infrastructure, and reducing trade costs, particularly those related to ‘non-tariff barriers’. Take, for instance, the case of landlocked Rwanda. Approximate estimates, by comparing FOB and CIF cost of imports suggest that trade and transport costs add on average 22% to the cost of goods for landlocked Rwanda,8 compared with reported estimates of international transport costs of 12.6% on the delivered value of exports for Africa as a whole, and a world average of 6.1% (UNCTAD, 2015:40). Reducing such costs has thus become a government priority, both through actions domestically and attempts to pressure trading partners to remove the impediments to the free movement of goods. However, the lessons of the new economic geography suggest that one should not presuppose that such a strategy will result in the desired impact. The reduction in ‘distance costs’ may help attract mobile investments, but equally runs the risk of facilitating market access for producers based in other countries, with larger domestic markets and a greater ability to reap scale economies.
A World Bank (2012) report on the economic geography of the EAC argues that “implementing and deepening the current program of regional infrastructure improvements would ensure that consumers and producers throughout the region are better connected to each other and to global markets”. However, the same paper also suggests that only the coastal areas of East Africa offer a viable option with regards to building up manufacturing export processing zones, while the three landlocked EAC partners (Burundi, Rwanda and Uganda) would struggle to attract their share of mobile investments in industrial capacity.
A similar concern exists that in a larger TFTA market, economic activity could polarise at the extreme ends, in the countries with the largest domestic markets and therefore with greater capacity to attract increasing return industries where proximity to the bulk of their clients is important. In other words, industrial activity would concentrate in Egypt and South Africa. These fears materialised themselves in different ways. Tanzania actually left COMESA in 2000 precisely because of fears that it would open the ‘floodgates’ to cheaper more competitive imports from Egypt (East African Trade Review, undated, accessed 7/7/2015). The New Economic Geography does at least alert policymakers to the possibility of ‘unexpected outcomes’ from deeper regional integration, and that a reduction in distance and trade costs does not necessarily lead to the desired outcomes, in terms of ability to attract a greater share of industrial capacity.
3. Previous empirical studies on the impact of economic integration in Africa
Empirical studies of regional economic integration can be divided into partial equilibrium analyses, computable general equilibrium (CGE) models and econometric studies. Although not without their detractors9, CGEs are widely used because of the way they attempt to capture the interactions between sectors. In a partial equilibrium setting, such interactions on relative prices and factor utilization between sectors are lost. CGE models use economic data to estimate how an economy or region might react to changes in policy or to external shocks. They adopt a multi-sector and multi-region general equilibrium framework, and are able to capture interactions of different sectors and markets in a given economy and at the international level. Applications of CGE models to trade policy across the world are numerous.10 In this brief review, given the nature of the empirical analysis, we will focus on previous CGE studies on regional integration for African economies.
A number of authors have focused on the effects of African continental trade agreements and customs unions. Mevel and Karingi (2012) explore the effects of the African continental free trade area and Customs Union (CU). They use the MIRAGE CGE model to study the potential effects of the FTA and the CU. They found that a continental FTA would significantly contribute to increasing trade within the African continent. They also found that the formation of a continental CU would not result in any additional increase in intra-African trade, as compared to the FTA.
Cheong and Tongzon (2013) also used the MIRAGE CGE model to assess the economic impacts of establishing the continental FTA, with a focus on the effects of regional integration on agricultural production and employment. The results indicate that, for Africa as a whole, the establishment of regional FTAs would increase continental exports, real income, and real wages for all categories of workers, although the estimated changes are small. The formation of a larger FTA at the continental level would amplify these gains. In particular, agricultural and food exports would be significantly stimulated following the removal of relatively high tariff barriers, and unskilled workers employed in agriculture would see their purchasing power enhanced. Intra-African trade as a share of Africa’s total trade would increase by about 50% over a 12-year period, from 10.2% of total trade in 2010 to 15.5% by 2022.
Minor and Mureverwi (2013) use the GTAP CGE model to determine the impact of several proposed trade agreements – such as the completion of the regional integration with SADC, the TFTA and the African Continental Customs Union - on Mozambique’s poorest households. They find that the poorest agricultural households gained real income because of increased sugar prices, as exports to Kenya increased. The top two quintiles in both rural and urban areas also gain real income because of higher rents on capital in the agricultural sectors. In contrast, poor urban households (second and third quintiles) experience a negative impact on real incomes. With respect to the African Continental-wide CU, they found a negative impact on Mozambique, with poor households (those in the first three quintiles) bearing a disproportionate burden.
Hallaert (2007) uses a CGE model to evaluate the impact of the SADC FTA on Madagascar’s economy. He finds that the SADC FTA would have a limited impact on Madagascar’s real GDP. However, Madagascar’s trade and production pattern would change, benefiting the textile and clothing sector. Dimaranan and Mevel (2008) estimate the potential impact of the formation of a COMESA customs union through the use of the MIRAGE CGE model and the GTAP database. They find that the customs union would result in overall expansion of trade in the region. However, it would also hurt some members in terms of lost tax revenue and significant terms of trade losses. Mashayekhi et al. (2012) analyse the impact of further regional trade liberalisation on the SADC region. They use the GTAP CGE model to analyse the effects of further regional integration, finding a positive welfare and employment effects from the elimination of intra-SADC tariffs.
In the first extensive analysis on the TFTA, Willenbockel (2013) simulates the impact using a combination of the GLOBE CGE model and the GTAP 8.1 database. Assuming a complete tariff liberalisation between the three blocs, he finds that the TFTA leads to a welfare benefit of USD 578 million. However, under the most ambitious TFTA scenario, which combines complete tariff liberalisation for intra-TFTA trade with a reduction in non-tariff trade barriers, the projected aggregate net benefit for the TFTA group rises to over USD 3.3 billion per annum. This represents more than five times the gains resulting from full intra-TFTA tariff liberalisation alone. In this most ambitious scenario, the total volume of intra-TFTA trade is boosted by USD 7.7 billion, an increase of nearly 20%. Significant sectoral production effects are concentrated in a sub-set of sectors, including sugar products with backward linkage effects to sugar cane production, beverages and tobacco and light manufacturing, and to a lesser extent for some countries in textiles, metals and metal production, and chemicals.
Because all the studies discussed above have used different models, databases and variations in the model closure, the results from these studies vary. It is worth stressing that all these CGE models are also highly sensitive to the parameters used and the model closures employed. For example, smaller Armington trade elasticities result in lower welfare gains from liberalisation, while the larger trade elasticities result in larger gains (Hertel et al., 2002; Burfisher, 2011).11
4. Model data and specification
For the simulations, we use the GTAP 9 database which describes global bilateral trade patterns, production, consumption and intermediate use of commodities and services. The underlying data in the GTAP 9 database refers to a 2011 baseline. This represents a marked improvement on the previous GTAP 8.1 database, which included less regional detail and was based on 2007 input–output data. The model is run using an aggregation that includes 18 individual TFTA countries and 3 composite regions countries which make up the TFTA region. The 57 sectors which make up the GTAP database was aggregated into 10 major sectors.12
The GTAP CGE model is a system of equations that describes economic linkages between several global regions and sectors. The model closure determines which variables are exogenous and which are endogenous. Endogenous variables have values that are determined within in the model. For example, prices and quantities are endogenously determined within the model. The exogenous variables have values that are fixed at their initial levels and do not change when the model is solved. Because there is no theoretical framework for choosing between different closures, the choice of closure should be guided by the structure of the economy under investigation. At odds with the aforementioned study by Willenbockel (2013), our study uses a fixed wage closure for unskilled labour, allowing for high levels of unemployment in the tripartite region. This we believe represents a more accurate reflection of the labour market within the TFTA.
Equations in the GTAP CGE model are both ‘behavioural’ and ‘identity’ equations. Behavioural equations describe the economic behaviour of producers, consumers, and other agents in the model. The Cobb–Douglas utility function describes consumer preferences in the standard GTAP model. The functional forms are nested constant elasticities of substitution (CES) production functions. Land, labour (skilled and unskilled) and capital substitute for one another, and composite intermediates substitute for value added at the next CES level (with fixed proportions applying in the standard model).
In the default GTAP closure, labour and capital are assumed to be mobile across all uses within a country and immobile internationally. Bilateral international trade flows are modelled to follow the Armington specification by which products are differentiated by country of origin. The Armington elasticities are the same across regions but are sector-specific. As mentioned in the previous section, the magnitude of the Armington elasticity can significantly alter simulation results, as can changes in the model closure.
The standard GTAP model assumes perfect competition and constant returns to scale in production (Hertel et al., 2007). This is often contested as ‘unrealistic’. However, in reality the issue is not so clear-cut. Although one early study (Harris, 1984) claimed that the introduction of scale economies and imperfect competition could result in much larger gains from trade liberalisation than usually estimated,13 subsequent studies challenged the notion that those additional gains were due to incorporating imperfect competition and scale economies, but rather due to other modelling choices made by Harris.14 A study by Abayasiri-Silva and Horridge (1998) suggests that the most theoretically-sound ways of modelling increasing returns to scale and imperfect competition – such as Lerner pricing and internal scale economies - often have little effect on the simulation results. Again, for the sake of tractability, our model maintains the standard assumptions of perfect competition and returns to scale.
A final important element to take into account in the standard GTAP model is its static nature. In some situations, (e.g. a discrete policy change that will produce a one-off impact on the economy), this may be considered reasonable. In recent years, however, dynamic CGE models have become increasingly popular.15 Dynamic CGE models explicitly trace each variable through time - often at annual intervals. Typically, these models tend to magnify welfare and GDP effects.16 Our modelling framework retains the more traditional static GCE. There are some justifications for this choice. Although dynamic models may be considered more realistic, they are also more challenging to construct and solve. So, for example, future changes need to be predicted for all exogenous variables and not only those affected by a policy change. Particularly in the context of African economies, where economic performance is often subject to high degree of variability over time, this can be demanding.
5. Simulation results and discussion
Our simulation results suggest that the benefits from the full implementation of the TFTA could be highly significant, resulting in a boost to intra-regional trade of nearly a third (29.2%). Total intra-regional trade would rise by USD 8.5 billion. Increases in intra-regional trade would be particularly strong in heavy manufacturing, light manufacturing and processed foods, which would see intra-regional trade increase by 3.3, 2.6 and 1.8 billion USD respectively (Fig. 5). In percentage terms, these represent significant boosts to intra-regional trade, raising the share of intra-TFTA exports from approximately 9.3 to 11.8% of total exports.17
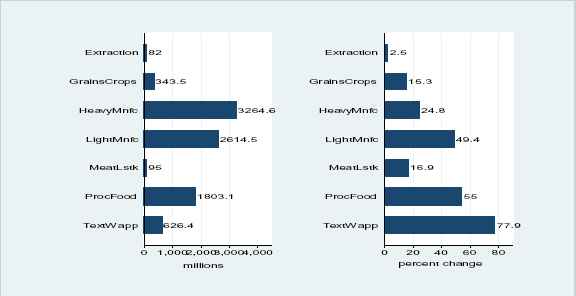
Changes in aggregate intra-regional trade (USD millions, and % increase).
Source:Authors’ Simulation.
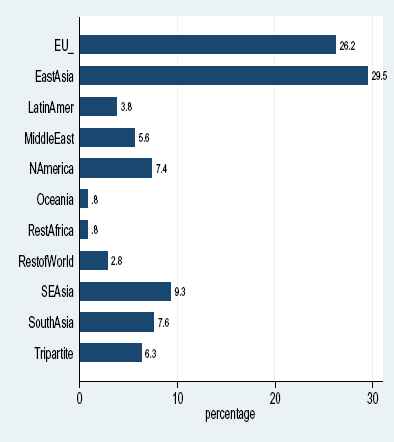
Moreover, the cost of the removal of tariffs, in terms of government revenue foregone, would be relatively modest. This reflects the fact that a lot of intra-regional trade is already facing low average tariffs, due to the gradual implementation of regional liberalisation within the EAC, COMESA and SADC (Table 1, Appendix Table 6 & Appendix Fig. 1). Tariff revenue for the whole of the TFTA in 2011 amounted to USD 21.74 billion, but intra-tripartite accounted for only 6.3% (or USD 1.45 billion) of that total (Fig. 6). Most tariff revenue is currently coming from imports from the European Union and East Asia, and this revenue of course would be unaffected by the tariff reductions.
| Tripartite | Oceania | EastAsia | SEAsia | SouthAsia | NAmerica | LatinAmer | EU_25 | MiddleEast | RestAfrica | RestofWorld | |
|---|---|---|---|---|---|---|---|---|---|---|---|
| Grains Crops | 3.1 | 7.1 | 9.9 | 6.6 | 12 | 2.1 | 4.5 | 7.4 | 4.3 | 8 | 1.3 |
| Meat Lstk | 2.5 | 7.6 | 2.5 | 27.7 | 3.3 | 7.6 | 10.5 | 8.6 | 5.4 | 2 | 1.5 |
| Extraction | 0.3 | 0 | 3.1 | 3 | 3.3 | 0.3 | 0.1 | 0.6 | 0.3 | 0 | 0.9 |
| Proc Food | 11.5 | 11.3 | 21.1 | 10.8 | 15.2 | 37 | 8.4 | 35.6 | 15.8 | 9.7 | 31 |
| Text Wapp | 8.6 | 11.1 | 24.3 | 15.1 | 17 | 15.5 | 15.3 | 10.4 | 10.4 | 16 | 14.5 |
| LightMnfc | 6.7 | 7 | 17.4 | 14.4 | 15.3 | 12.2 | 10.7 | 8.7 | 6.9 | 7.7 | 5.5 |
| HeavyMnfc | 3.5 | 1.9 | 6.3 | 18.7 | 5.9 | 3.5 | 3.9 | 5.1 | 3.5 | 5 | 4 |
| Util_Cons | 0 | 0 | 0 | 0 | 0 | 0 | 0 | 0 | 0 | 0 | 0 |
| TransComm | 0 | 0 | 0 | 0 | 0 | 0 | 0 | 0 | 0 | 0 | 0 |
| OthServices | 0 | 0 | 0 | 0 | 0 | 0 | 0 | 0 | 0 | 0 | 0 |
| Simple average | 5.2 | 6.6 | 12.1 | 13.8 | 10.3 | 11.2 | 7.6 | 10.9 | 6.7 | 6.9 | 8.4 |
Pre-simulation tariffs according to source of imports (% ad valorem).
Source: GTAP 9.0 database
Share of total tariff revenue according to origin of imports, Pre-Simulation.
Source: Authors’ Simulation.
The sectors that would benefit most from the elimination of tariffs on intra-regional trade are precisely the ones that consensus opinion believes are the ones that would help create more employment and a vibrant domestic industry, i.e. light and heavy manufacturing, processed foods, and textiles and apparel. These sectors also face the highest pre-simulation tariff rates in intra-regional trade (Appendix Fig. 1). In other words, the removal of tariffs in these sectors could give a renewed impetus towards the objective of structural transformation within the TFTA. Shifts in total output after the implementation of the TFTA would be more modest than the increases in export, for the simple reason that a relatively small share of total output is currently exported in most sectors (we will discuss this more later). But once again, those increases would be most marked in the manufacturing sectors, whereas the extractive sector would actually see its output contract, as resources are reallocated towards the sectors favoured by the implementation of the TFTA (Fig. 7). Again, this is desirable from the perspective of contributing to the structural transformation of the region. In a sense, this follows the line argumentation of Cooper and Massell (1965), who postulated that by forming a trade block, developing countries could retain protection against the ‘North’ in order to achieve a target level of industrialization, while reducing the cost of this industrialization by liberalising trade among each other.18
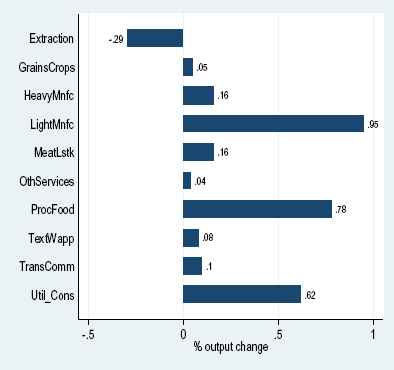
Changes in output, by sector (%), post-simulation.
Source: Authors’ Simulation.
Of course, there is a ‘cost’ to the implementation of the TFTA, in terms of reducing trade with external trading partners who do not benefit from the tariffs eliminations (Fig. 8). The principal ‘losers’ are the principal existing trading partners - the EU-25 (who loose USD 562.7 million of exports to the TFTA member countries) and East Asia (USD 505.9 million). As a consequence, although there is an increase in intra-regional trade of USD 8.5 billion, there is also a decline of USD 2.1 billion in external trade (imports from outside the block) which needs to be considered (Table 2). Thus, approximately a quarter of the increase in intra-regional trade could be defined as ‘trade diversion’ (Viner, 1950) away from current trading partners.
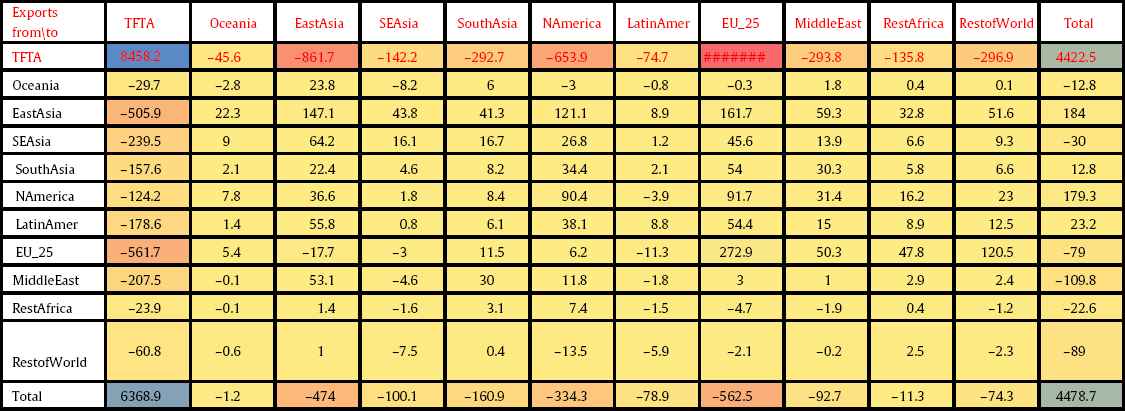
Change in exports (Mlns USD), post-simulation, by geographic area.
Sources: Authors’ Simulation.
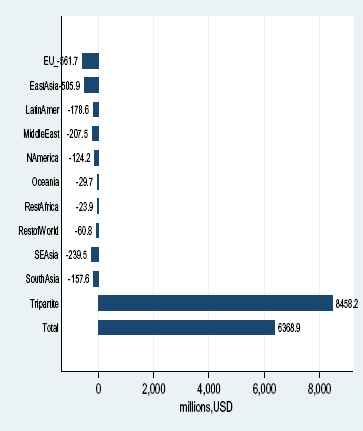
Trade creation and diversion through the formation of the TFTA (Millions USD).
Source: Authors’ simulation
Simultaneously, part of the TFTA’s existing external trade with partners outside the block would be diverted towards TFTA member states. This is where the Cooper and Massell (1965) -type arguments come into play - whereby a dollar of imports from a neighbouring country may be valued in welfare and development terms more favourably than a dollar of imports from an external, higher income or more industrialised partner.
The result of all this is a significant rise in the share of intra-regional exports in total exports within the TFTA - albeit from very low average levels. On average, intra-regional trade within the TFTA will rise from 9.2 to 11.7% of total trade - and in some of the manufacturing sectors, intra-regional trade reaches around a third of all trade (Table 3). This revindicates the role of regional integration as an important engine of industrialisation (UNECA, 2015), something that is underscored by the recent experience of countries like Tanzania, who have managed to buck the regional trend of stagnation in manufacturing precisely through exploiting regional markets (in this case, the EAC market).
| BD | PS | Change | |
|---|---|---|---|
| Grains Crops | 13.6 | 15.6 | 2 |
| Meat Lstk | 23.1 | 26.5 | 3.4 |
| Extraction | 2.7 | 2.7 | 0 |
| ProcFood | 27.1 | 36.7 | 9.6 |
| TextWapp | 9.3 | 15.7 | 6.4 |
| LightMnfc | 23.5 | 31.7 | 8.2 |
| HeavyMnfc | 14.4 | 17.6 | 3.2 |
| Util_Cons | 28.3 | 28.6 | 0.3 |
| TransComm | 0.9 | 1 | 0.1 |
| OtherServices | 1.3 | 1.3 | 0 |
| Total | 9.2 | 11.7 | 2.5 |
Percentage share of regional exports in total exports, base data (BD) and post-simulation (PS).
Source: Authors’ simulation.
Regarding the impact on the labour market, the Table 4 shows the changes in demand for labour in the manufacturing sectors as a result of the TFTA. The light manufacturing and processed food sectors experience the largest increases in employment (1.1 and 1.0% respectively).
| Sectors | Skilled | Unskilled | Average |
|---|---|---|---|
| ProcFood | 0.7 | 1.2 | 1 |
| TextWapp | 0 | 0.6 | 0.3 |
| LightMnfc | 0.8 | 1.4 | 1.1 |
| HeavyMnfc | 0 | 0.7 | 0.3 |
Change in demand for labour in the Tripartite region (%).
Source: Authors’ Simulations
Finally, what does this all mean in terms of welfare impact? Generally speaking, in this kind of CGE modelling, the concept of ‘Equivalent Variation’ is to be preferred to changes in GDP, for reasons explained in Hertel (1997). The welfare results reveal a net welfare gain of USD 2.4 billion for the TFTA through the reduction of tariffs (Table 5). Driving these results are marked improvements in both the terms of trade and endowments. The latter stems from changes in the availability of primary factors — for example, increases in the stock of agricultural land (the endowment effect). Improvements in allocative efficiency also play a significant role.19 However, the distribution of these gains would be skewed, with nearly three quarters (72.5%) of welfare gains going to consumers in South Africa (Fig. 9). Nonetheless, for the vast majority of countries in the TFTA welfare benefits are positive (with the exception of Kenya and Zimbabwe).20
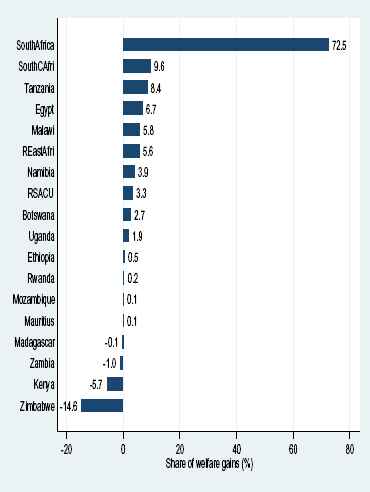
Share of welfare gains by country, %.
Source: Authors’ Simulation
| Allocative efficiency | Endowment effect | Terms of trade effect | Investment savings | Total | |
|---|---|---|---|---|---|
| Tripartite | 478.5 | 1096.3 | 727.6 | 45.9 | 2348.3 |
| Oceania | −0.4 | 0 | 21.2 | 0 | 20.8 |
| EastAsia | −68.9 | 0 | −345.3 | 23.6 | −390.6 |
| SEAsia | −5.2 | 0 | −47.4 | 3.5 | −49.1 |
| SouthAsia | −36 | 0 | −86.9 | −19.6 | −142.4 |
| NAmerica | −7 | 0 | −108.2 | −55.7 | −170.9 |
| LatinAmer | −15 | 0 | −1.3 | 1.1 | −15.2 |
| EU_ | −40.3 | 0 | −285 | −9.6 | −334.9 |
| MiddleEast | 4.3 | 0 | 67.1 | 7.1 | 78.5 |
| RestAfrica | −6.3 | −7.9 | 16.6 | −0.4 | 2.1 |
| RestofWorld | 14.9 | 0 | 40.4 | 3.9 | 59.2 |
| Total | 318.7 | 1088.4 | −1.3 | −0.1 | 1405.7 |
Breakdown of improvements in equivalent variation (Welfare).
Source: Authors’ simulation.
5.1. The regional distribution of gains
As discussed in Section 2, intrinsic to the work of authors like Krugman (1991) and Krugman and Venables (1995) is the idea that the gains from regional integration are not necessarily evenly distributed - indeed, under low trade costs, geographically peripheral regions within the regional block may undergo a process of deindustrialisation, and a concentration of the benefits in the ‘core’ parts of the integrated area. What is the evidence on the geographic concentration of production from the simulations with respect to the TFTA?
As noted in Section 2, a key concern for smaller countries in the TFTA is that manufacturing would essentially polarise at the extreme ends of the TFTA in the countries with the largest domestic markets and highest productivity levels, namely Egypt and South Africa. Nearly two thirds of manufacturing value added produced within the TFTA are already accounted for by South Africa and Egypt. And the top five manufacturers, in value-added terms, constitute more than 80% of all manufacturing in the region. Would the formation of the TFTA simply exaggerate this pattern of uneven industrial development?
In fact, the changes in the patterns of industrial output post-simulation are modest. The simulations suggest that the total volume of industrial output in the region would increase by only 0.28%. Relatively small changes are experienced in the largest countries in the region - in South Africa and Egypt output increases marginally by 0.21% and 0.06%, respectively (Figs. 10 and 11). Industrial output in Malawi and RSACU (Lesotho and Swaziland) would increase the most – by 4.1% and 1.1% respectively.
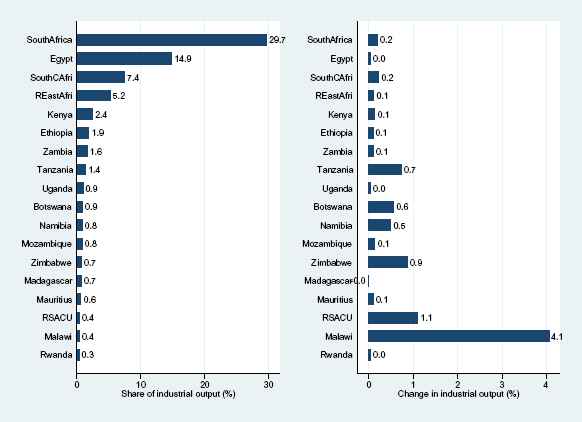
The share of regional Industry output by country, and the % change in volume of Industry output.
Source: Authors’ Simulation
Why are the changes in output on average so modest? The answer is quite straightforward. Even after the elimination of tariffs on intra-TFTA trade, the simulation results suggest that the level of intra-regional trade will still be low (barely 12% of total trade). And because, with the exception of commodity-exporting activities, traded output in many sectors is still a relatively small share of total output, it implies that the tariff changes on intra-TFTA trade alone have a relatively limited potential to change the overall pattern of output growth. This in itself should allay fears of a dramatic concentration of industrial activity through the elimination of tariffs on TFTA trade. But it also highlights the fact that more would need to be done to incentivise intra-TFTA trade beyond the removal of tariff barriers. More will be said on this in the conclusions.
What about changes at the sectoral level? Which countries are likely to be affected most by sectoral shifts in industrial activity? As noted in Fig. 7, changes in some sectors are more marked than for total industrial output. From the full set of results, we highlight changes in the textile industry, processed foods and light manufacturing because these labour intensive sectors are important in the early stages of industrial development and structural change (UNIDO, 2013). For processed foods, there are significant changes (>3%) in production in 6 of the 19 GTAP regions which comprise the TFTA. Malawi, Namibia, Botswana experience notable increases in production of processed foods while Uganda, Zimbabwe and Tanzania experience declines (Fig. 12 and Appendix Table 7). For textiles and apparel, four countries experience significant increases in production (Botswana, RSACU21, Tanzania and Namibia), while only two experience notable falls (Malawi and Zimbabwe). Finally, for light manufacturing Namibia and South-Central Africa register a significant increase in output, while Malawi experiences a decline. In all the other cases, the shifts in production predicted by the simulation are of relatively small magnitudes. In sum, the simulation seems to allay fears of industrial concentration - indeed, neither South Africa nor Egypt appear to be the principal beneficiaries in any of these sectors.
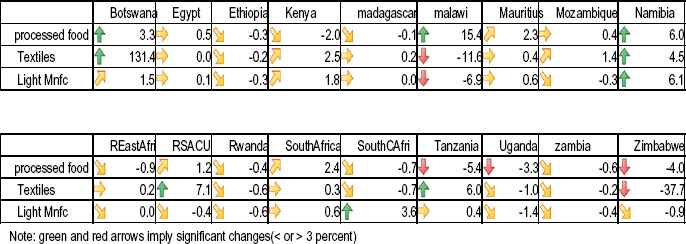
Summary of Shifts in Industrial Production within the TFTA (% Change).
Source: Authors’ Simulation
Once again, however, the changes in intra-regional exports are far more pronounced than the changes in output. As noted earlier, intra-regional exports increase by 29.2% as a result of the TFTA, driven particularly by the increase in South African exports (which accounts for 19.5% of total intra-regional exports). However, the distribution of the changes is not uniform - the RSACU region (Lesotho and Swaziland) register the highest increase in intra-regional exports, followed by Botswana and Namibia (Fig. 13). In contrast, exports from Zambia and Rwanda to the TFTA region decrease marginally as a result of the TFTA, probably reflecting a combination of the intense resource-based nature of their exports and relatively low productivity levels. None of this should detract from the fact that, at this stage at least the principle objective of the TFTA is to promote intra-regional trade, and these simulation results suggest a highly significant positive impact on intra-regional exports.
Percentage change in value of intra-regional exports.
Source: Authors’ Simulation
5.2. Sensitivity analysis
Finally, as noted earlier, CGE model results of this kind can be sensitive to assumptions relating to the elasticity of substitution between products differentiated by country of origin. The analysis of free trade areas using CGE models could result in welfare losses or gains depending on the value of the elasticities used. For example, in two studies of the USA-Australia free trade area, assumptions about the elasticities led to one study reporting positive welfare effects, while the other reported welfare losses (Stoler, 2003).
The standard GTAP model uses trade elasticities which were econometrically estimated by Hertel et al. (2007). They are based on imports from the world into seven countries (Argentina, Brazil, Chile, Paraguay, USA, Uruguay and New Zealand) and the estimates for each product category are assumed to apply to all countries in the world (notably none of these countries are African).22 To test the sensitivity of our model to different trade elasticities we changed the elasticities of substitution by 100% (plus or minus) from the baseline values (Table 6). The results indicate robust welfare gains at the 95% confidence interval for the TFTA, with upper limit gains of 3.5 billion USD, and lower limit of 1.4 billion USD.
| EV (Standard baseline elasticity) | EV (trade elasticity varied by 100%) | Upper limit (95% Cl) | Lower limit (95% CI) | |
|---|---|---|---|---|
| Tripartite | 2348.3 | 2415.1 | 3480.3 | 1349.8 |
| Oceania | 20.8 | 22.7 | 62.6 | −17.2 |
| EastAsia | −390.6 | −415.7 | −103.9 | −727.5 |
| SEAsia | −49.1 | −51.3 | 26.2 | −128.7 |
| SouthAsia | −142.4 | −149.4 | −62.6 | −236.2 |
| NAmerica | −170.9 | −180.2 | −43.5 | −317 |
| LatinAmer | −15.2 | −14.9 | 60.1 | −89.9 |
| EU_25 | −334.9 | −348.1 | −108.6 | −587.6 |
| MiddleEast | 78.5 | 84.5 | 202.2 | −33.2 |
| RestAfrica | 2.1 | 3.4 | 47.7 | −40.8 |
| RestofWorld | 59.2 | 62.6 | 148.3 | −23 |
Comparison of welfare effects; standard trade elasticities vs. adjusted trade elasticities (USD, millions).
Source: Authors’ Simulation
6. Concluding comments
This paper analysed the effect of the proposed COMESA-SADC-EAC TFTA on production and trade flows within the region using the GTAP 9 computable general equilibrium model. The paper focused specifically on the potential impacts on the industrial geography of the region. We started the analysis by reviewing the findings of the ‘new economic geography’ literature of the 1990s, and how it might relate to the process of regional integration within the TFTA area. This literature was originally directed towards discussions over the ongoing process of European integration. But because of concerns of an uneven share of the benefits from the TFTA, the literature is also particularly relevant and can hold some important insights into the prospects for the TFTA. That literature highlighted the risk that, within a process of regional integration, industrial activity could concentrate in the ‘core’ parts of the integrated area, to the detriment of poorer ‘peripheral’ countries.
Our simulation work found no evidence of that being the case (in the admittedly very different circumstances) of the TFTA block. The results indicate a significant increase in intra-regional exports as a result of tariff elimination, boosting intra-regional trade by 29% (or USD 8.5 billion). Particularly encouraging is the fact that the sectors benefiting most are manufacturing ones, such as light and heavy manufacturing, and processed food. This would all be achieved by sacrificing USD 1.45 billion of existing tariff revenue from the intra-TFTA trade. That figure may seem large, but in reality it represents just 6.5% of all tariff revenue, 0.7% of total tax revenue, or 0.1% of TFTA GDP. Policymakers may well feel that is a small price to pay in order to further their regional trade and industrialisation agendas.
The paper also addresses concerns raised that industrial production in the TFTA may concentrate in the countries with highest productivity levels - namely, Egypt and South Africa. Our simulation results suggest that these fears are exaggerated, with little evidence of concentration of industries in the larger countries. Average total volume of industrial output in the region would increase only modestly (by 0.27%). The results also show that smaller countries in the TFTA do not have to worry about larger countries causing reduced industrial production in their own economies. In other words, industries do not appear to shift significantly from the smaller countries to South Africa or Egypt as a result of the TFTA, as the New Economic Geography literature might suggest.
The welfare implications of the TFTA, on the other hand, do appear to suggest a degree of concentration of the benefits - with South African consumers being among the main beneficiaries (with an aggregate share of 72.5% of the welfare gains). Total welfare increases by an estimated USD 2.4 billion. Other principal beneficiaries include South-Central Africa (Angola and DRC), Tanzania and Egypt.
As interesting as they are, a few important caveats need to be placed on these simulation results. The elephant in the room with this kind of CGE simulation result is that, in the grand scheme of things, the simulation results are still delivering relatively small results, particularly in terms of welfare and GDP changes. This was something observed by Fosu and Mold (2008), who noted a gradual secular decline in the magnitudes of welfare estimates produced by CGE models from trade liberalisation. The reasons are complex, but are tied up with i) more comprehensive models and databases ii) the inclusion of existing preferential market access schemes within the modelling framework iii) preference erosion. For Africa, in particular, Fosu and Mold argued that the tangible benefits from further multilateral liberalisation were likely to be quite meagre.
On the other hand, it should also be pointed out that simulations like this are likely to underestimate the benefits of the TFTA, principally because they only eliminate tariffs for intra-regional trade for TFTA members, and do not simulate any of the other (perhaps more serious) impediments to regional trade, such as infrastructure deficits and non-tariff barriers (NTBs). For the TFTA to work effectively, there is a general consensus that the elimination of NTBs is crucial.23
In addition, the estimated benefits could be larger if economies of scale were modelled, but their distribution might also be more highly skewed, particularly in sectors where economies of scale are important. The lesson from the New Economic Geography literature is that industrial geography outcomes can be highly sensitive to presence of sector- or firm-level economies of scale. As noted in Section 4, however, scale economies can be difficult to model within a CGE framework and the available evidence suggests that there is still uncertainty over whether it improves the overall results. One possible extension of our study would be to carry out a dynamic CGE analysis, which would be able to capture to some extent the important potential effects of the TFTA on investment in the region.
Finally, it needs stressing that the results are also dependent on the full implementation of the free-trade area, and contingent on resolving outstanding issues such as regional-wide rules of origin.24 Issues like this need to be resolved if the TFTA is to reach its full potential. Nonetheless, our research the TFTA provides an excellent opportunity for countries in the region to increase intra-regional trade, and create a more attractive market for both foreign and domestic investment. It is an opportunity which deserves to be seized.
Acknowledgements
The authors are grateful to Farzana Sharmin (UNECA) for her research assistance and Pedro Martins and Tim Wilson (UNECA) for their comments on an earlier draft. We would also like to thank an anonymous referee and the participants of the Poverty Reduction, Equity and Growth Network (PEGNet) “Conference Regional Integration for Africa’s Economic Transformation – Challenges and Opportunities held in Kigali” on September 15–16, 2016 for their feedback. Any remaining errors remain the responsibility of the authors.
Appendix
| Country | GDP per capita | Multiple of lowest country |
|---|---|---|
| Burundi | 276 | 1 |
| Malawi | 381.4 | 1.4 |
| Madagascar | 411.8 | 1.5 |
| Congo, Dem. Rep. | 456.1 | 1.7 |
| Mozambique | 525 | 1.9 |
| Eritrea | 544.5 | 2 |
| Ethiopia | 619.1 | 2.2 |
| Uganda | 675.6 | 2.4 |
| Rwanda | 697.3 | 2.5 |
| South Sudan | 730.6 | 2.6 |
| Comoros | 810.1 | 2.9 |
| Tanzania | 864.9 | 3.1 |
| Zimbabwe | 890.4 | 3.2 |
| Lesotho | 1034.2 | 3.7 |
| Zambia | 1361 | 4.9 |
| Kenya | 1376.7 | 5 |
| Djibouti | 1813.6 | 6.6 |
| Sudan | 2089.4 | 7.6 |
| Swaziland | 3154.8 | 11.4 |
| Egypt, Arab Rep. | 3614.7 | 13.1 |
| Angola | 4102.1 | 14.9 |
| Libya | 4643.3 | 16.8 |
| South Africa | 5691.7 | 20.6 |
| Botswana | 6360.6 | 23 |
| Mauritius | 9116.8 | 33 |
| Seychelles | 15,476 | 56.1 |
Per capita GDP TFTA, 2015 current USD.
Source: Own elaboration from World Bank (2016)
| Country | GDP per capita) | Multiple of lowest country |
|---|---|---|
| Portugal | 10,600 | 1 |
| Greece | 10,700 | 1 |
| Ireland | 15,400 | 1.5 |
| Spain | 15,700 | 1.5 |
| United Kingdom | 19,200 | 1.8 |
| Netherlands | 22,100 | 2.1 |
| Italy | 22,400 | 2.1 |
| Belgium | 23,100 | 2.2 |
| France | 23,300 | 2.2 |
| Austria | 24,600 | 2.3 |
| Germany | 25,600 | 2.4 |
| Denmark | 29,000 | 2.7 |
| Luxembourg | 39,200 | 3.7 |
Per capita GDP EU-12 1992, current USD.
Source: Own elaboration from World Bank (2016)
| Member imposing | Sanitary and phytosanitary | Technical barriers to trade | Anti-dumping | Countervailing | Safeguards | Quantitative restrictions | Tariff-rate quotas | Export subsidies |
|---|---|---|---|---|---|---|---|---|
| Uganda | 3 | 595 | ||||||
| Kenya | 30 | 522 | ||||||
| South Africa | 48 | 262 | 32 | 2 | 53 | 62 | ||
| Egypt | 78 | 169 | 19 | 6 | 4 | |||
| Zambia | 4 | 89 | 1 | |||||
| Botswana | 3 | 56 | ||||||
| Rwanda | 49 | |||||||
| Tanzania | 1 | 44 | ||||||
| Mozambique | 2 | 11 | ||||||
| Mauritius | 12 | 7 | ||||||
| Seychelles | 2 | |||||||
| Burundi | 5 | 1 | ||||||
| Swaziland | 2 | 1 | ||||||
| Zimbabwe | 6 | 1 | ||||||
| Congo, Dem. Rep. | 2 | |||||||
| Madagascar | 22 | |||||||
| Malawi | 2 | |||||||
| TFTA Total | 220 | 1809 | 51 | 6 | 7 | 0 | 53 | 62 |
| Africa Total | 348 | 1920 | 64 | 6 | 12 | 35 | 82 | 62 |
Reported non-tariff measures in the TFTA countries.
Source: WTO (2017)
| GTAP regions | Tripartite countries and composite regions |
|---|---|
| Oceania | Egypt |
| East Asia | South Central Africa (Angola, Democractic Republic of Congo) |
| Southeast Asia | Ethiopia |
| South Asia | Kenya |
| North America | Madagascar |
| Latin America | Malawi |
| European Union 25 | Mauritius |
| Rest of World | Mozambique |
| Middle East | Rwanda |
| Rest of Africa | Tanzania |
| Uganda | |
| Zambia | |
| Zimbabwe | |
| Rest of Eastern Africa | |
| (Burundi, Comoros, Djibouti, Eritrea, Mayotte, Seychelles, Somalia, Sudan) | |
| Botswana | |
| Namibia | |
| South Africa | |
| Rest of South African Customs | |
| (Lesotho, Swaziland) |
Regional mapping.
Source GTAP 9.0 database
| Grains crops | Grains and crops |
|---|---|
| Meat Lstk | Livestock and Meat Products |
| Extraction | Mining and Extraction |
| ProcFood | Processed Food |
| TextWapp | Textiles and Clothing |
| LightMnfc | Light Manufacturing |
| HeavyMnfc | Heavy Manufacturing |
| Util_Cons | Utilities and Construction |
| TransComm | Transport and Communication |
| OtherServices | Other Services |
Note: The 57 sectors in the GTAP data base were aggregated into 10 sectors.
GTAP sectors.
| Egypt | CentralAfri | SouthCAfri | Ethiopia | Kenya | Madagascar | Malawi | Mauritius | Mozambique | ||
| GrainsCrops | 0.5 | 13.7 | 4.9 | 4 | 4.9 | 1.7 | 5 | 0 | 2.1 | |
| MeatLstk | 0.2 | 10.3 | 3.9 | 2.5 | 1.6 | 0 | 1.6 | 0 | 1.7 | |
| Extraction | 0.1 | 6.7 | 7.4 | 1.3 | 0.4 | 0.6 | 0.7 | 0.2 | 0.4 | |
| ProcFood | 2 | 18.5 | 13.9 | 10.4 | 12.4 | 0.8 | 6.9 | 0.1 | 4.9 | |
| TextWapp | 4.8 | 17.3 | 8.8 | 20.5 | 6.2 | 0.5 | 6.5 | 0.3 | 4.9 | |
| LightMnfc | 4.2 | 19 | 7.5 | 14.8 | 5.3 | 1.2 | 6.9 | 0.5 | 3.9 | |
| HeavyMnfc | 2.3 | 14.2 | 5.9 | 8.6 | 1.9 | 1.4 | 2.2 | 0.1 | 2.2 | |
| Rwanda | Tanzania | Uganda | Zambia | Zimbabwe | REastAfri | Botswana | Namibia | SouthAfrica | RSACU | |
| GrainsCrops | 1.8 | 6.8 | 3.6 | 1.7 | 4.2 | 9.2 | 0.6 | 0.5 | 1 | 0.4 |
| MeatLstk | 1.6 | 6.1 | 1.8 | 0.8 | 4.9 | 4.5 | 0.2 | 0.2 | 0.7 | 0 |
| Extraction | 0.3 | 2.2 | 0.6 | 0.5 | 2.5 | 2.2 | 0 | 0 | 0 | 0 |
| ProcFood | 6.5 | 21.7 | 15.6 | 2.1 | 12.3 | 18.5 | 0.5 | 1.6 | 2.6 | 2.1 |
| TextWapp | 4.6 | 16.5 | 6.8 | 2.2 | 16.4 | 8.3 | 3.5 | 5.9 | 8.9 | 4.2 |
| LightMnfc | 6.1 | 8.1 | 8.4 | 2.7 | 13 | 7.2 | 3 | 2.4 | 2 | 3.2 |
| HeavyMnfc | 3.5 | 3.7 | 3.4 | 0.9 | 5.8 | 4.8 | 0.3 | 0.4 | 0.6 | 0.3 |
Pre-simulation intra-regional tariffs in the TFTA(%).
Source GTAP 9.0 database
Mean intra-regional tariffs before simulation, by country and commodity (%).
Source GTAP 9.0 database
| GrainsCrops | MeatLstk | Extraction | ProcFood | TextWapp | LightMnfc | HeavyMnfc | |
|---|---|---|---|---|---|---|---|
| Botswana | 0.9 | −0.2 | −1.1 | 3.3 | 131.4 | 1.5 | −0.9 |
| Egypt | 0 | 0 | −0.1 | 0.5 | 0 | 0.1 | 0 |
| Ethiopia | 0.2 | 0.2 | 0.2 | −0.3 | −0.2 | −0.3 | −0.3 |
| Kenya | 0.7 | −0.2 | 0.5 | −2 | 2.5 | 1.8 | 3 |
| Madagascar | 0 | 0 | 0 | −0.1 | 0.2 | 0 | 0.1 |
| Malawi | −4 | 14.9 | −2.5 | 15.4 | −11.6 | −6.9 | −14.8 |
| Mauritius | 1 | −0.1 | 0.2 | 2.3 | 0.4 | 0.6 | −2.3 |
| Mozambique | 0.9 | −2.1 | −0.1 | 0.4 | 1.4 | −0.3 | −0.2 |
| Namibia | 1.5 | −2.8 | −1.2 | 6 | 4.5 | 6.1 | −4.2 |
| RestAfri | −0.1 | 0.2 | 0.1 | −0.9 | 0.2 | 0 | 0.5 |
| RSACU | 0.2 | 0.2 | −1.7 | 1.2 | 7.1 | −0.4 | 3.7 |
| Rwanda | 0.1 | −0.2 | 0.2 | −0.4 | −0.6 | −0.6 | −0.1 |
| SouthAfrica | 0 | 0.3 | −0.8 | 2.4 | 0.3 | 0.6 | −0.6 |
| SouthCAfri | −0.1 | 0.2 | 0 | −0.7 | −0.7 | 3.6 | −1 |
| Tanzania | 0.6 | 1.1 | 0.8 | −5.4 | 6 | 0.4 | 3.2 |
| Uganda | 1.2 | −2.1 | 0.3 | −3.3 | −1 | −1.4 | 1.3 |
| Zambia | −1.4 | 0.4 | 0.2 | −0.6 | −0.2 | −0.4 | 0.8 |
| Zimbabwe | 7 | −2.8 | 8.8 | −4 | −37.7 | −0.9 | 20.9 |
Changes in industry output post-simulation (%).
Source: Authors’ Simulations
Footnotes
Peer review under responsibility of Afreximbank.
The TFTA agreement will need to ratified by the 26 member states, and enter into force upon the ratification of the text by two-thirds of members. Following earlier discussions, the 4th Meeting of the Tripartite Council of Ministers took place in Nairobi, Kenya in October 2016. The Ministers reported that progress had been made on a number of outstanding contentious issues, including non-tariff barriers; rules of origin; trade facilitation; customs cooperation and mutual administrative assistance; transit trade and transit facilitation; technical barriers to trade and sanitary and phytosanitary measures (Tralac, 2016).
Egypt has been the latest country to formally join the TFTA, with Prime Minister Sherif Ismail approving the agreement in February 2017 (Enterprise, 2017).
The corresponding figures for 2011 (the year of the data included in the GTAP database 9.0 used for the subsequent simulation work in this paper) was USD 1.083 trillion for the GDP for the TFTA and 59.4% of the African population.
A number of quantitative studies have tried to quantify the impact from reducing or eliminating NTBs in African economies. For example, Vanzetti et al. (2016) found that by removing NTMs in the SADC region, exports would increase exports by 2.2%. Rial (2014) analysed European imports of agri-food products and found that exports from African LDCs were reduced by almost 5% for each additional Sanitary and Phytosanitary requirement in the EU. Cadot and Gourdon (2014) found that, on average, sanitary and phytosanitary measures increased the domestic prices of foodstuffs by about 13% in Sub-Saharan Africa, impacting negatively on cross-border trade.
There is a deficiency to the WTO database on NTMs that was used for this comparative analysis; it depends on voluntary notifications by member states, which results in a partial and potentially biased coverage (Cadot and Gourdon, 2014).
See Lipsey and Lancaster (1956). On an intuitive level, the second-best theorem infers that, if an economy suffers from two or more distortions, their effects could be partially or wholly to neutralise each other. Removal of one of them (in our case, high transport costs) could thus result in an even more inefficient outcome.
The reasoning is born out to a certain extent by the empirical findings of Martin and Rogers (1994) who note that, while there is a strong correlation within the regions of the EU between GDP per capita, telecommunications, educational infrastructure, and the share of intra-industry trade (which they identify with the location of increasing-returns industry), there is only a weak correlation with the provision of transport infrastructure. See also Stohr and Todtling (1977).
Authors’ calculations from MINECOFIN (2015).
Because the framework tends to focus on the long run, which often abstracts from short-run realities of structural rigidities in developing countries, such as ‘missing’ or inefficient factor markets, some scholars have argued that they may not be appropriate for analysing the problems of the typical developing country (e.g., De Maio et al., 1999; Charlton and Stiglitz, 2004).
See, inter alia, Scollay and Gilbert (2000), O’Ryan et al. (2011), Kitwiwattanachai et al. (2010).
An Armington elasticity represents the elasticity of substitution between products of different countries, and is based on the assumption made by Armington (1969) that products traded internationally are differentiated by country of origin. The Armington assumption has become a standard assumption of international computable general equilibrium models.
See the Appendix Table 4 for a list of the different GTAP regional groupings. The only country for which results have not been simulated in Libya – Libya is included in a composite region called ‘Rest of North Africa’ which includes Algeria (which is not a member of the TFTA). The sectors in the GTAP database are listed in Appendix Table 5.
Harris’s simulation suggested that the long-run gains to Canada of trade liberalisation were in the range of 8–12% of GNP: considerably larger than those suggested by conventional estimates which assume perfect competition and constant returns: these are often between 0.5 to 2% of GNP
See the discussion on this in Abayasiri-Silva and Horridge (1998).
Examples include the World Banks multicountry Linkage model (van der Mennsbrugghe, 2009; European Commission, 2017).
Burfisher (2011:210–213) provides an overview of some of the implications of using a dynamic framework instead of a static one.
These figures are somewhat at variance with the figures presented by Andriamananjara (2015). The magnitudes in his analysis of merchandise exports, derived from the World Bank WITS database, broadly concurs with our own. He notes among the members of the TFTA have steadily increased from $2.3 billion to $36 billion between 1994 and 2014—more than a 12-fold increase over 20 years. But his share of intra-regional trade in total exports, at 25% for 2014, is way out of line with the data provided in the GTAP database, and also the earlier data cited in Fig. 1 from UNCTADStat, which suggests an intra-regional TFTA trade of 10.7% for 2011 - closer in line with our initial figure of 9.3% from the GTAP base data. UNCTADStat numbers do in fact reveal a sharp increase in intra-TFTA trade in 2013, up to 14.4%. But even still, a jump to 25% in one year is not really plausible. The problem resides in the way direction of trade statistics vary sharply according to the source. Often intermediate destinations are confused with final destinations. So, for instance, Rwandan tea sent for auction to Mombasa (Kenya) for sale, may be classified as an export to Kenya - yet in fact the ultimate purchaser may well be in Europe. Problems like this continue to plague direction of trade statistics.
The Cooper-Massell argument presumed the exploitation of scale economies by developing countries within the Customs Union specialising in different industries. In essence they were arguing that the dynamic gains from intra-regional trade, in terms of building up industrial capacity, more than compensated for any static losses from preferential liberalisation. The theoretical basis of this hypothesis is questioned by Krishna and Bhagwati (1997). In practice, however, there is a set of quite compelling empirical evidence that suggests that the ‘regional route’ to industrialisation is a valid one, and that the trade costs may be assumable if the industrialisation objective is to be realisable. See, inter alia, UNCTAD (2009).
These results are comparable to the CGE study by Willenbockel (2013), who also found a positive welfare effect the tripartite. However, there are significant differences in his study, which estimates a welfare increase of only USD 578 million. The difference in magnitudes are mainly due the differences in model closures.
While both Kenya and Zimbabwe see modest gains in allocative efficiency due to the trade liberalisation, they are also negatively impacted by terms of trade and investment/savings effects, which outweigh allocative efficiency or endowment effects.
RSACU refers to the rest of South African customs union in the GTAP database - an aggregate of Lesotho and Swaziland.
According to Valenzuela et al. (2008), poor countries may have higher trade elasticities than wealthier countries because they import greater amounts of less-differentiated products.
Willenbockel (2013) models NTBs by representing them as a reduction in iceberg transport costs within the CGE model. Based on sample estimates of the cost wedges attributable to avoidable shipment delays, he introduces one scenario in his simulations which assumes that the ad valorem tariff equivalent rate of these transport costs drops by five percentage points on all intra-TFTA trade flows. This results in a multiplication of the welfare gains by a margin of more than five times.
For the rules of origin, members are yet to agree on a general value addition rule with a threshold of 35%.
References
Cite this article
TY  - JOUR
AU  - Andrew Mold
AU  - Rodgers Mukwaya
PY  - 2017
DA  - 2017/07/08
TI  - Modelling the economic impact of the tripartite free trade area: Its implications for the economic geography of Southern, Eastern and Northern Africa☆
JO  - Journal of African Trade
SP  - 57
EP  - 84
VL  - 3
IS  - 1-2
SN  - 2214-8523
UR  - https://doi.org/10.1016/j.joat.2017.05.003
DO  - 10.1016/j.joat.2017.05.003
ID  - Mold2017
ER  -