
ECOWAS and AfCFTA: Potential Short-Run Impact of a Draft ECOWAS Tariff Offer
- DOI
- 10.2991/jat.k.211011.001How to use a DOI?
- Keywords
- ECOWAS; TRIST; AfCFTA; tariff liberalisation; common external tariff
- Abstract
This study provides an ex ante short-run impact analysis of tariff liberalisation in the context of the African Continental Free Trade Area (AfCFTA) on the Economic Community of West African States (ECOWAS) customs union regarding tariff revenue and import values. As with other customs union on the continent, ECOWAS negotiates within the AfCFTA as a bloc (including Mauritania). Tariff revenue losses for a scenario with 97% tariff liberalisation (Categories A and B) amount to around USD $262.7 million at the end of the implementation period, representing 12.5% of total tariff revenue, and USD $201.9 million for a scenario with 90% tariff liberalisation (Category A), representing 9.7% of total tariff revenue. This is more than the USD $54 million inferred from estimates by the World Bank (2020), which assumed 90% tariff liberalisation. Tariff losses for ECOWAS are likely to be larger than previously estimated, mainly because ECOWAS negotiates as a bloc and because its selection of sensitive sectors exempted from liberalisation (Category C) is not optimised at the country level to minimise revenue loss. Import increases on account of ECOWAS tariff concessions under the AfCFTA are estimated to be relatively small (1.3–1.8% total increase). As such, the main worry of ECOWAS policymakers, on aggregate, should not be a deluge of African imports competing with regional or domestic production. Further research is needed to understand the distributional impact among ECOWAS countries and on the benefits of other African countries opening market access to ECOWAS exports.
- Copyright
- © 2021 African Export-Import Bank. Publishing services by Atlantis Press International B.V.
- Open Access
- This is an open access article distributed under the CC BY-NC 4.0 license (http://creativecommons.org/licenses/by-nc/4.0/).
1. INTRODUCTION
1.1. African Continental Integration and Intra-African Trade
Promoting African regional integration has been long on the agenda of African policymakers, and was embedded at the creation of the Organisation of African Unity (OAU) in 1963. Integration has often been seen as essential to overcoming the limitations of small fragmented economies established under colonialism.
Policies geared toward the promotion of intra-African trade were further concretised in the 1980 Lagos Plan of Action and the 1991 Treaty Establishing the African Economic Community, also referred to as the Abuja Treaty, which entered into force in 1994.1 The Abuja Treaty proposed a progressive, linear model toward continental integration, starting with the strengthening or creation of Regional Economic Communities (RECs) that would serve as the foundation for eventual continental integration. At present, there are eight RECs recognised by the African Union (AU).2
Subsequent stages involved establishing a free trade area among these RECs that would, by 2017, become a customs union—i.e. to maintain a common external tariff for imports from third countries as well as to implement common customs and trade policies. Eventually, by 2019, a continental customs union would be established, followed by an African Common Market with the adoption of common policies in areas such as energy, transportation, communication, and agriculture, with harmonised monetary, financial, and fiscal policies—and the free movement of persons, goods, capital, and services.
At present, two RECs operate as customs unions, namely the East African Community (EAC) and the Economic Community of West African States (ECOWAS). In addition, the continent counts two customs unions that are not recognised as RECs:3 the Economic and Monetary Community of Central Africa (CEMAC) and the Southern African Customs Union (SACU).4
1.2. African Continental Free Trade Area
The Continental Free Trade Area, which later became known as the ‘African’ CFTA (AfCFTA), is one of the flagship projects in the African Union 2063 Agenda, which was adopted at the 50-year anniversary of the OAU (now AU). The AfCFTA aims to create a free trade zone between African countries and the RECs, facilitating free trade between RECs rather than solely within them. The AfCFTA complements the Abuja Treaty. It can be regarded as a step toward the implementation of the fourth stage in the creation of the African Economic Community (viz. the creation of a continental customs union) as well as the fifth and sixth stages, as it concerns the free movement of goods and services, and the adoption of common policies.
The AfCFTA negotiations have been split into two phases: Phase 1 covers the areas of trade in goods and trade in services, and Phase 2 covers the areas of investment, intellectual property rights, and competition policy. Negotiations on Phase 1 were launched in 2015. The agreement establishing the AfCFTA together with three protocols (viz. trade in goods, trade in services, and dispute settlement) were adopted by the AU Assembly on 21 March 2018 in Kigali, Rwanda. Annexes to the Protocol on Trade and Goods and the Protocol on Rules of Procedures for the Settlement of Disputes were adopted by the AU Assembly on 1 July 2018 in Nouakchott, Mauritania.
The AfCFTA agreement entered into force on 30 May 2019 and currently counts over 40 State Parties, i.e. AU Member States that deposited their instrument of ratification with the African Union. A new AfCFTA Secretariat has been established and charged with monitoring and facilitating the implementation of the AfCFTA. In the area of goods, this includes provisions on transparency, general elimination of quantitative restrictions, trade facilitation (Annex 4 of the Protocol on Trade in Goods), transit (Annex 8), and the adoption of procedures regarding rules of origin by State Parties.
1.3. Tariff Negotiations
The Niamey Summit in July 2019 launched the operational phase of the AfCFTA and developed a roadmap for finalizing any outstanding issues with the Phase I negotiations. In the area of goods, the AfCFTA is not fully operational, as there is still no agreement on substantive rules of origin for several products nor on schedules of tariff concessions on trade in goods.
For tariff liberalisation to happen, offers need to be drawn up and presented to the rest of Africa. In some cases, one or more bilateral negotiations might have taken place on these offers. Lunenborg (2019) noted that bilateral negotiations could make this a rather complicated and time-consuming process. Finally, a summit decision is required to incorporate any offer as a schedule of tariff concessions into the AfCFTA Agreement.
The first tariff cut (‘T1’ or also referred to as ‘the start of trading’) should formally have started on 30 May 2020, a year after the entry into force of the AfCFTA. It was slightly delayed to 1 July 2021 to take into account the financial years of some countries, and subsequently postponed to 1 January 2021 due to the COVID-19 pandemic. This date does not depend on when an AU Member State becomes a State Party or when the tariff offer is submitted or concluded.
With respect to tariff offers, AU Member States are expected to designate at a minimum 90% of tariff lines in Category A, which comprises products on which tariffs will be progressively eliminated in a period of 5 years [for non-Least Developed Countries (LDCs)] or 10 years (for LDCs). A remaining 7% are to be allocated to Category B, for which tariff elimination can be phased in from the 6th year for a period of 4 years (for non-LDCs) or 7 years (for LDCs). This leaves at maximum 3% of tariff lines to be excluded from liberalisation, which together should represent not more than 10% of African imports. Or to put it differently, the AfCFTA’s level of ambition is (progressive) tariff elimination for 97% of tariff lines representing at least 90% of African imports.
1.4. Standstill Clause: Paragraph 6 of the Niamey Decision
Until the adoption of tariff schedules, a standstill clause applies with respect to tariffs on African imports. Paragraph 6 of the Niamey Decision on the launch of the operational phase of the AfCFTA emphasises that ‘AU Member States shall not apply customs duties in excess of the base rates to import from other Members’. These base rates are the Most Favoured Nation (MFN) applied rates as of the date of entry into force, i.e. 30 May 2019. This commitment implies that if an African country increases its MFN tariff compared to the base rate, it should maintain the pre-existing tariff for imports from an African country, thereby creating a preferential margin for Africa. This decision is potentially important during a time when tariffs are increasingly being wielded to provide protection for domestic industries or to generate income for government budgets. Monitoring this commitment lies predominantly with the newly established AfCFTA Secretariat.
1.5. ECOWAS as a Negotiation Partner
Negotiation partners in the AfCFTA tariff negotiations are the customs unions, that is CEMAC, ECOWAS, EAC, and SACU, and the other African countries not party to a customs union. As a customs union, ECOWAS negotiates as a group and provides a common ECOWAS offer to the rest of Africa. This means that any tariff concession would be implemented equally by each ECOWAS Member State. Additionally, Mauritania, which is currently not part of the ECOWAS customs union, has indicated that they will participate in an ECOWAS offer.
All customs unions on the African continent have a mix of LDCs and non-LDCs, and the question has arisen regarding which phase-out period should apply to customs unions: the LDC transition period, the non-LDC transition period, or a sweet spot in between. This question is ultimately left for negotiations, but essentially the agreement is that the principle of reciprocity also applies to transition periods. Thus, if ECOWAS offers a transition period of 10 years, the other partner may also implement tariff concessions in 10 years for all ECOWAS Member States.
For ECOWAS, the basis for negotiations is the ECOWAS common external tariff (CET), adopted in 2013, which all its Member States are bound to implement. At present, most Member States have implemented the CET, and further alignment is on-going. For instance, Liberia is implementing the ECOWAS CET in a 3-year migration plan that started in 2018. By 1 January 2021, it is expected that Liberia’s MFN tariff will be fully aligned with the ECOWAS CET. Some Member States continue to maintain some diverging (often higher) tariffs on account of the ECOWAS Regulation on Supplementary Protection Measures. This regulation allowed Member States to maintain some variance with the ECOWAS CET for a 5-year period until 2018. After this period, it only allows national variance for a particular product on the basis of the existence of an import surge (a trade remedy-like instrument).
Considering the historical significance and priority accorded to regional integration on the continent, African imports have actually become gradually less important for ECOWAS, rather than more important: the percentage of imports from Africa (as a share of total imports) reduced from 18% in 2001 to 12% in 2018. A sudden temporary increase was registered in 2004 and 2005 at levels of around 25%, attributable to the food crises in West Africa. During that period, ECOWAS countries turned more to neighbouring countries to meet their food import deficits. (World Bank, 2015). However, this event shows the potential for increased intra-African trade, particularly in agriculture.
1.6. Purpose of this Study
The general purpose of this study was to provide an ex ante short-run impact analysis of tariff liberalisation on the ECOWAS region of Africa, on tariff revenue and trade import values, in the context of the AfCFTA.
Most empirical studies, such as those by Abrego et al. (2019), Saygili et al. (2018), Chauvin et al. (2016) and Mevel and Karingi (2012), assess the potential long-term effects of the AfCFTA on the states in the agreement. This type of models (usually CGE) is useful because it captures the interactions between all sectors of the economy, as well as those between countries through trade flows. However, the method of assessment does not capture the short-term implications of tariff liberalisation, and this is significantly important for policymakers as well.
2. TARIFF LIBERALISATION AND ADJUSTMENT COSTS
2.1. Adjustment Costs
Tariff liberalisation could involve adjustment costs in the short run and the long run. According to Saygili et al. (2018), long-run effects involve the equilibrium state where resources have fully adjusted to a new equilibrium, whereas short-run impacts concern the transitional effects during the adjustment period.
Moreover, Waglé (2011) indicated that liberalisation generally pays for itself over time, because distorted economies can allocate resources effectively and efficiently in the long run, which contributes to economic growth by widening the tax base. Nevertheless, it is still important for African countries to note that the AfCFTA is not a magic formula that will instantaneously solve the socioeconomic challenges of the continent.
Short-run transitional effects can arise from shifts in the revenue base of governments and the costs of transferring resources from one sector to another. For the public sector, revenue loss is the most important effect of changes in tariff policy (de Córdoba et al., 2006 and Tarr and Matusz, 2005).
2.2. Importance of Tariffs
Tariff policy serves two broad roles. Firstly, it can be used as a tool to generate public revenue, which is crucial for providing public services and investments, sustaining government functions, and reducing dependence on development aid. Secondly, tariff policy can be used as a regulatory tool to affect the volume, price, and quality of imported merchandise.
Generally, low-income countries rely heavily on customs revenue from external trade. For instance, World Bank data suggest that for most ECOWAS countries, customs and import duties account for at least 15% of total tax revenue (Figure 1). For some (often smaller) countries, the share is higher. For instance, in the case of The Gambia or Liberia where customs generate around one-third of total tax revenue for these countries. If this revenue source is affected, it will certainly have short-term effects on development planning in the country. There could also be greater challenges, given that developing effective domestic resource mobilisation initiatives proves to be continually challenging for developing countries, due to complexities of a lack of innovation and administrative capacity.
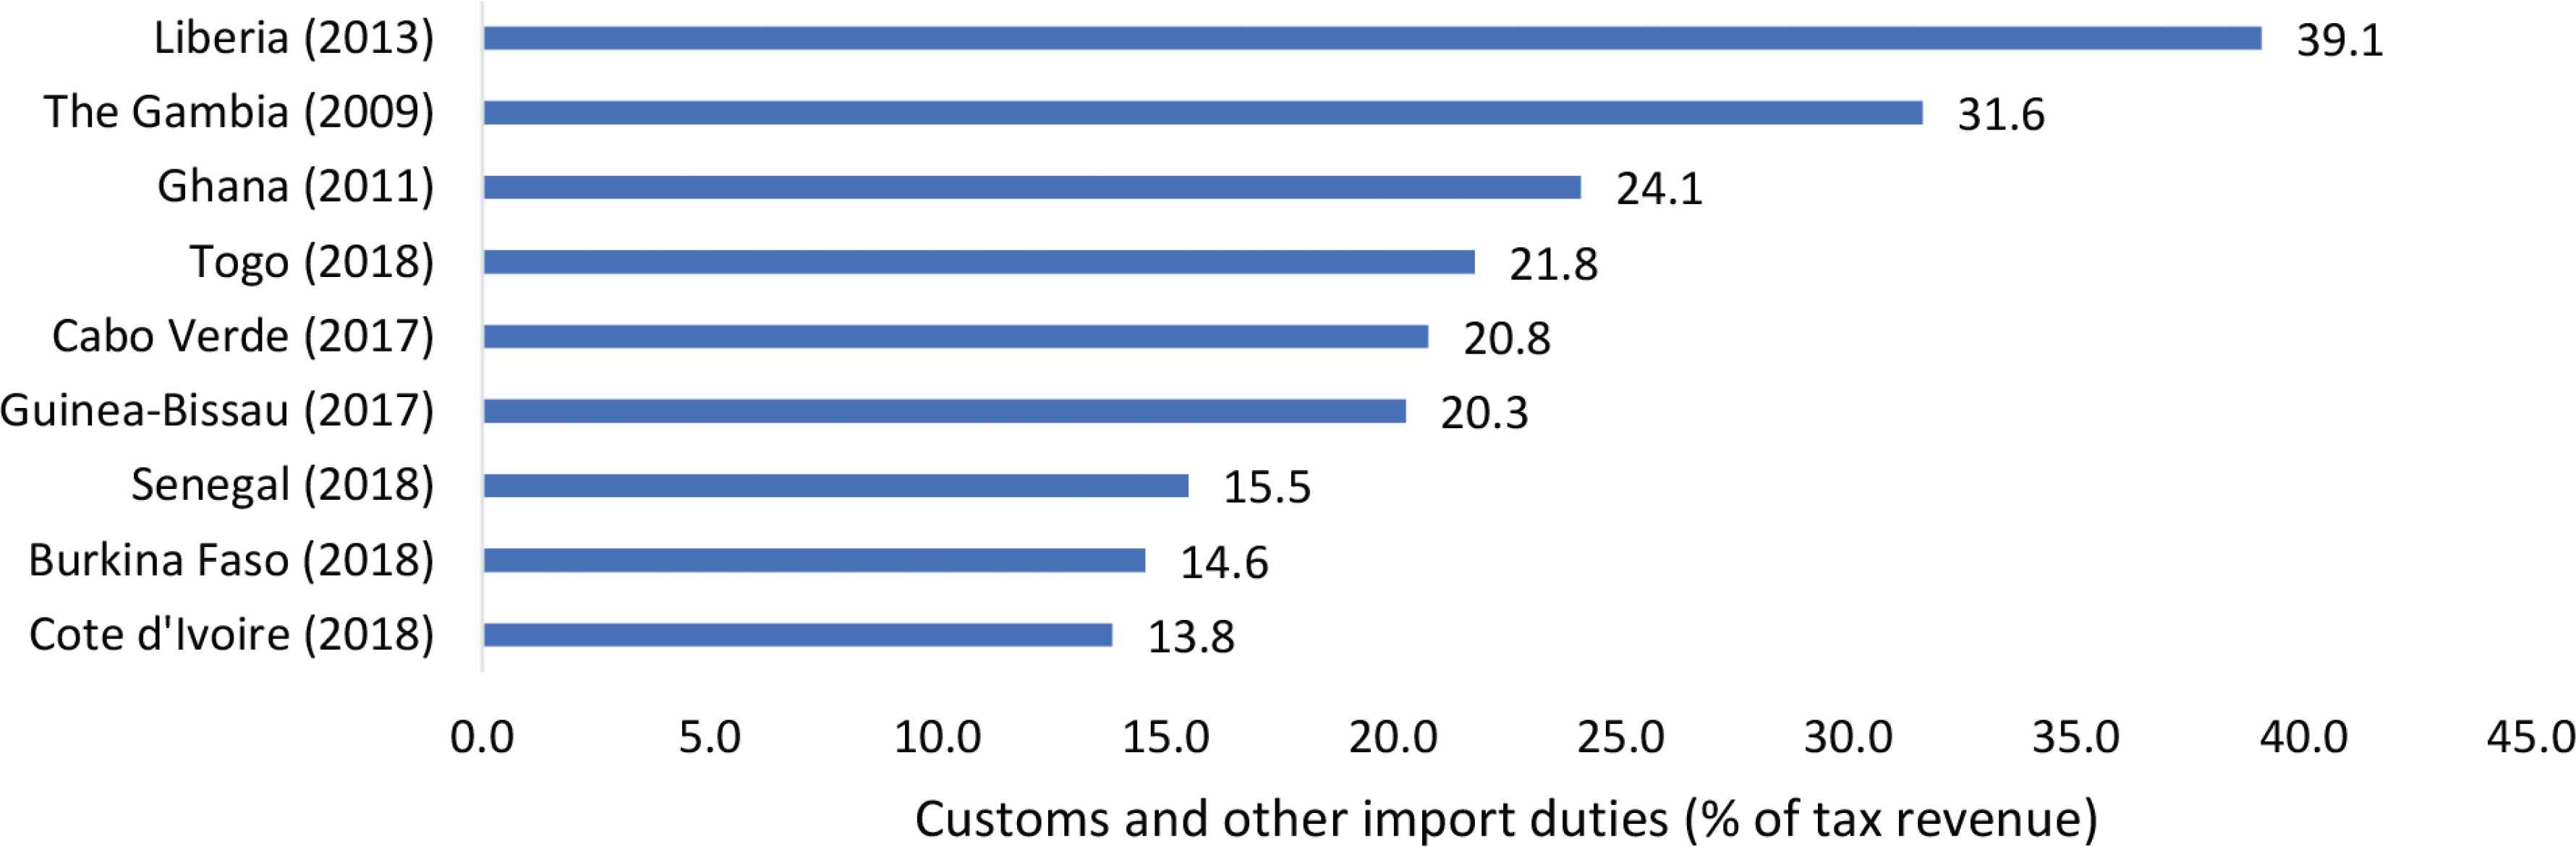
Source: World Bank’s World Development Indicators. Note: The data reflect the most recent available year. Data are not available for other ECOWAS Member States.
Many low-income countries and some middle-income countries have experienced difficulties replacing lost trade tax revenue as a result of trade reforms (IMF, 2005). If the government fails to increase other taxes or sufficiently reduce public expenditure, the loss in tariff revenue may lead to fiscal and current account deficits. According to the studies of UNU-WIDER (2016) and Buffie (2001), revenue shortfalls have provoked partial or full trade policy reversals in African countries in the past, for instance in Kenya (1983), Morocco (1987), Guinea (1990 and 1992), Malawi (multiple times in 1980s), and Senegal (1989). For this reason, it is worth assessing the potential tariff revenue impact of tariff liberalisation under the AfCFTA.
2.3. Literature on Short-term Revenue Implications of AfCFTA Tariff Liberalisation for ECOWAS
Most empirical studies on the AfCFTA derive their estimates from a computable general equilibrium model such as the Global Trade Analysis Project (GTAP); [see IMF (2019), UNCTAD (2018), Chauvin et al. (2016), and Mevel and Karingi (2012)]. These estimates are usually for the long run. Moreover, as mentioned earlier, it is also important for policy makers to understand the short-run implications of tariff liberalisation.
Tariff revenue loss can be expressed as an absolute monetary amount, or as a relative amount expressed as a percentage of tariff revenue, tax revenue, government revenue, or gross domestic product (GDP). The attractiveness of an absolute amount is that its size is more readily assessed vis-à-vis other government expenditures. The disadvantage is that an absolute number usually changes—and more often than not increases—with new studies as import data are updated. A relative number is thought to be less susceptible to change over time.
The World Bank (2020) estimated tariff revenue loss based on statutory data for 12 ECOWAS countries. Losses (measured as % of tariff revenue) ranged from 0.21% for Liberia to 5.4% for The Gambia. Further, revenue loss based on tariffs that are actually collected were estimated to be a bit lower for Nigeria, significantly lower for Senegal and Sierra Leone, and significantly higher for Mali.5
However, the World Bank study did not provide an estimate for ECOWAS as a region. Based on available data from the Organisation for Economic Co-operation and Development (OECD) Revenue Statistics in Africa, tariff revenue loss for eight countries within the ECOWAS region, including the larger economies of Cote d’Ivoire, Ghana, and Nigeria, would be at least USD $54.4 million, based on a 2017 data (Table 1).
| ECOWAS member | Tariff revenue loss (as % of total tariff revenue) | Customs and import duties, 2017 (million USD) | Tariff revenue loss, 2017 (million USD) |
|---|---|---|---|
| The Gambia | 5.4 | n/a | n/a |
| Niger | 2.74 | 88.0 | 2.4 |
| Burkina Faso | 2.2 | 277.3 | 6.1 |
| Sierra Leone | 1.86 | n/a | n/a |
| Togo | 1.76 | 218.7 | 3.8 |
| Guinea | 1.48 | n/a | n/a |
| Senegal | 1.36 | 453.6 | 6.2 |
| Benin | 1.23 | n/a | n/a |
| Mali | 1.22 | 278.7 | 3.4 |
| Côte d’Ivoire | 1.09 | 910.5 | 9.9 |
| Ghana | 0.85 | 1,260.3 | 10.7 |
| Nigeria | 0.46 | 2,574.2 | 11.8 |
| Guinea-Bissau | 0.3 | n/a | n/a |
| Liberia | 0.21 | n/a | n/a |
| Cabo Verde | n/a | 70.7 | n/a |
| Total for countries with data | 54.4 |
Sources: World Bank (2020) Table J.4 for the second column; and OECD Revenue Statistics in Africa, Table ‘African Countries: Comparative tables’ for the third column.
Tariff revenue loss as % of total tariff revenue and in USD
According to most studies, tariff revenue loss from tariff liberalisation under the AfCFTA are modest. Two factors help explain this. First, imports from African countries account for a small share of tariff revenue for most countries. Second, most tariff revenue can be shielded from liberalisation with exclusion lists, because these revenue are highly concentrated in a few tariff lines. In the medium term, the overall impact on import tariff revenue is expected to be positive, because an increase in the volume of imports leads to higher tariff revenue collection.
3. MATERIALS AND METHODS
3.1. Tariff Revenue Analysis using the Tariff Reform Impact Simulation Tool
The methodology used in this paper is the World Bank’s Tariff Reform Impact Simulation Tool (TRIST), a partial equilibrium model that predicts the impact of tariff reform scenarios. The main purpose of TRIST is to provide general support to policymakers by identifying the potential impact on short-term adjustment costs in terms of fiscal revenue and domestic output related to trade reform. The significance of using TRIST as a tool for analysing trade reforms has also been indicated in the studies conducted by Brenton et al. (2009), Dillen (2015), Hosein et al. (2018), and Karami and Mahmoudi (2018).
The TRIST model may not be adequate for assessing the economy-wide impact of trade policies. TRIST is most often for tariff revenue analysis. A positive attribute of TRIST is its ability to categorise countries into groups to reflect regional trading blocs and agreements. This is relevant to our assessment of the impact of tariff liberalisation on ECOWAS in the context of the AfCFTA.
Brenton et al. (2009) and Bacchetta et al. (2012) provide a detailed simulation procedure for the model. As described by the authors, the trade model in TRIST is based on five core assumptions. First, the model is derived from standard consumer demand theory and utilises elasticities to determine the magnitude of the demand response to price changes that result from tariff reform. Second, the calculations are based on the standard assumption by Armington (1969) of an imperfect substitution between imports from different trading partners, since consumers distinguish products by the place of production. Third, the model does not allow for direct substitutions between different products. In other words, each product is modelled as a separate market and in isolation from other markets. Fourth, it is assumed that all changes in tariffs are fully passed on and that the world price remains unchanged. This is to say that the model assumes an infinite supply elasticity of imports, so that changes in demand in the importing country have no effect on the world price of products. This assumption is realistic for low-income economies, including ECOWAS countries.
As noted above, the trade model in TRIST is a partial equilibrium model that treats demand for each product in isolation from the rest of the economy. Thus, it does not take into consideration inter- and intra-sectoral effects on tariff changes. Brenton et al. (2009) noted that TRIST was designed with the specific task of providing policymakers with important insights into the short-term effects of trade reform. Also, given its comparatively static nature, TRIST allows for the comparison of two scenarios—one in which the base values of policy instruments (such as tariffs) are unchanged, and another in which these base values are exogenously changed.
Generally, the model does not provide for direct substitutions between products. The trade response to a change in tariffs for a given product from a given exporter is calculated based on the resulting percentage change in the duty-inclusive price. The model’s general calculation of a price change depends on how a country applies its tariffs, excises, and value-added tax (VAT).6 For a change in the tariff, the percentage change in the price of good i from exporter j is calculated as follows:7
Δpj is the change in the price of imports from country j,
Pwld is the world market price,
extj is the excise tax rate applied to imports from j, and
vatj is the VAT rate applied to imports from j.
Here, we model the substitution between different exporters following changes in the relative prices of different suppliers due to the AfCFTA preferential tariff or duty changes. Other simulation steps are assumed to be fixed.8 This is the same calculation method used by Karami and Mahmoudi (2018):
The model requires an assumption regarding elasticities that determines the magnitude of the impact of a change in relative prices. TRIST includes default parameters9 that are common across products and import suppliers—namely, the exporter substitution elasticity (1.5) and the ‘KON WB’ demand elasticity (ibid.). For export substitutions, the extent to which a given change in relative prices translates into a change in relative imports depends on a user-defined exporter substitution elasticity. Elasticity ensures a change in imports from country B relative to imports from country A, if the relative price for imports from country B decreases by 1% relative to the domestic price for imports from country A—total imports remain the same, but imports from country B increase at the expense of imports from country A.
On the other hand, given that the demand for products (both imported and domestically produced) increases after a reduction in the average domestic price of the product, demand elasticity ensures a percentage change in total demand (regardless of origin) for the product following a 1% change in the average domestic price, and leading to an increase in total domestic consumption. The ‘KON WD’ demand elasticity was used in this study because of its product-specific nature. The product-specific feature of demand elasticity was deduced from Kee et al. (2004) and involves systematically estimating import demand elasticities for a broad range of countries at a fairly disaggregated level of product detail [at the six-digit level in the Harmonised System (HS)].
3.2. Data
3.2.1. Import data
Import data were derived from the World Bank’s World Integrated Trade Solution (WITS) database. The data was aggregated into the following three mutually exclusive country groups:
- •
ECOWAS: This country group includes all 15 countries belonging to the ECOWAS customs union, as well as Mauritania.10 It excludes all other non-ECOWAS countries in the world.
- •
Non-ECOWAS Africa: This country group includes all African countries except for countries belonging to the ECOWAS country group.
- •
The rest of the world (ROW): This country group excludes all African countries.
In 2017, ECOWAS (including Mauritania) imports from non-ECOWAS African countries totalled approximately USD $3.09 billion. The three most important African import partners in terms of value of imports are South Africa (USD $1.32 billion), Morocco (USD $828 million), and Egypt (USD $258 million). ECOWAS has imports from all 38 non-ECOWAS African countries, and the imports from the ROW account for approximately 85.2% of ECOWAS imports.
3.2.2. Tariffs
The base rate for negotiations is the ECOWAS CET that was applicable on 30 May 2019, the date that the AfCFTA entered into force. The base rate is therefore fixed and does not change (Table 2 for a summary). The ECOWAS CET and the offer are expressed in the 2017 version of the Harmonised System (HS2017). However, WITS has limited data availability for imports in HS2017. Therefore, a transposition from 2017 nomenclature to 2012 nomenclature was undertaken with an aggregation at the six-digit level, in order to fit the trade data from WITS.11
| ECOWAS CET | Number of tariff lines | Share (%) |
|---|---|---|
| 0% | 85 | 1.4 |
| 5% | 2149 | 36.4 |
| 10% | 1372 | 23.3 |
| 20% | 2161 | 36.6 |
| 35% | 131 | 2.2 |
| Total | 5898 | 100 |
ECOWAS common external tariff (CET)
The ECOWAS CET has a low number of duty-free tariff lines with a relatively high share of tariff lines at 5% and 20%, respectively (Table 2). In 2017, the simple average tariff was 13.7% and the weighted average was 9.9%. The value of statutory tariffs amounted to USD $2.063 billion.
3.2.3. Tariff offers
Each tariff offer12 made under the AfCFTA contains a number of common elements:
- •
a list of tariff lines,
- •
the base rate,
- •
a categorisation of tariff lines into either Category A (non-sensitive products), B (sensitive products) and C (products excluded from liberalisation), and
- •
the applicable tariff during the transition period.
Transition periods differ between LDCs and non-LDCs. In this study we assume that the timelines applicable to LDCs apply to the ECOWAS region. Group A is composed of products that will be liberalised over a period of 13 years, using the linear cut method. The same method was also applied to sensitive products (Group B), beginning in year 6, over a period of 8 years.
We were provided with a draft of the ECOWAS offer, which was at an advanced stage of discussion within ECOWAS. It contained all categories (A–C), accounting for 90%, 7%, and 3% of tariff lines, respectively. On that basis, simulations were conducted for Group A only, as well as for Groups A and B together. The level of liberalisation in terms of tariff lines is 90% for Group A and 97% for Groups A and B together. The final offer might differ from this draft offer, but it is likely to be more aligned with it than a hypothetical offer. The World Bank (2020) utilises hypothetical offers of liberalising 90% of tariff lines for individual ECOWAS Member States, minimizing tariff revenue loss for individual ECOWAS Member States through the selection of products. However, under the AfCFTA, ECOWAS acts as a bloc rather than as individual Member States (Section 1.5, above). As such, tariff revenue minimisation does not occur at the individual state level. Also, selection criteria other than tariff revenue loss minimisation influences the choice of tariff lines.
Table 3 shows the simulated tariff cuts from the base rate throughout the implementation period.
| Group | Year | ||||||||||||
|---|---|---|---|---|---|---|---|---|---|---|---|---|---|
| T1 | T2 | T3 | T4 | T5 | T6 | T7 | T8 | T9 | T10 | T11 | T12 | T13 | |
| Non-sensitive products (Group A) | 10% | 20% | 30% | 40% | 50% | 60% | 70% | 80% | 90% | 100% | 100% | 100% | 100% |
| Sensitive products (Group B) | 0% | 0% | 0% | 0% | 0% | 12.5% | 25% | 37.5% | 50% | 62.5% | 75% | 87.5% | 100% |
| Exempted products (Group C) | 0% | ||||||||||||
Note: T1 is currently set at 1 January 2021.
Simulation - percentage (%) of linear tariffs cut from the base rate
4. RESULTS
4.1. Imports and Intra-African Trade
Economic Community of West African States imports will increase by USD $268.2 million if Category A products are liberalised and by USD $374.4 million if products from Categories A and B are liberalised (Table 4). This signifies an increase in total imports of 1.3% and 1.8%, respectively. Imports from non-ECOWAS Africa will increase by 8.2% and 11.1%, respectively. In 2017, African imports accounted for 14.8% of total imports and this will increase by 1% to 15.8%, if Category A products are liberalised, and by 16.2% if products from Categories A and B are liberalised.
| Liberalisation scenario | ECOWAS | |
|---|---|---|
| Category A | Category A + B | |
| Impact on imports: | ||
| Total imports pre-period | 20,906,011 | 20,906,011 |
| Total imports post-period | 21,174,201 | 21,280,452 |
| Change in total imports | 268,190 | 374,441 |
| Change in total imports (%) | 1.3% | 1.8% |
| Total imports from Africa pre-period | 3,092,199 | 3,092,199 |
| Total imports from Africa post-period | 3,346,478 | 3,436,903 |
| Change in imports from Africa | 254,279 | 344,704 |
| Change in imports from Africa (%) | 8.2% | 11.1% |
| Intra-African imports pre-period (%) | 14.8% | 14.8% |
| Intra-African imports post-period (%) | 15.8% | 16.2% |
Source: Simulation results.
Impact on imports at the end of implementation period, in thousands of USD
4.2. Tariff Revenue
The ECOWAS region will experience a progressive increase in tariff revenue loss. At the end of the implementation period, tariff revenue loss from African imports on account of Group A will amount to USD $201.9 and USD $262.7 million for Groups A and B, combined. Due to a slight increase of imports from the ROW, which will continue to fetch tariffs, total revenue loss will be USD $200.3 million (Category A) and USD $256 million (Categories A and B). This represents 12.5% of total tariff revenue and 86.1% of tariff revenue derived from African imports. Non-ECOWAS Africa tariff revenue loss of USD $127.6 million (Category A) and USD $140.1 million (Categories A and B) is lower than that of ECOWAS (Table 5).
| Impact on revenue | Liberalisation scenario | |
|---|---|---|
| Category A | Category A + B | |
| Total tariff revenue pre-period | 2,062,782 | 2,062,782 |
| Total tariff revenue post-period | 1,862,439 | 1,804,783 |
| Change in total tariff revenue | −200,343 | −257,999 |
| Change in total tariff revenue (% of total tariff revenue) | −9.7% | −12.5% |
| Total tariff revenue from Africa pre-period | 305,293 | 305,293 |
| Total tariff revenue from Africa post-period | 103,413 | 42,576 |
| Change in tariff revenue from Africa | −201,880 | −262,717 |
| Change in tariff revenue from Africa (%) | −66.1% | −86.1% |
Source: Simulation results.
Impact on tariff revenue at the end of the implementation period, in thousands of USD
Table 6 shows that during the period of implementation, the region will experience a progressive loss in tariff revenue from year 1 to 13. For products in Category A, there will be an increase in annual tariff revenue loss of approximately USD $18.2 million by year 2, and of USD $22.3 million by year 10. With regard to products in Categories A and B, the liberalisation of products in Category B will start in year 6, leading to a larger increase in revenue loss of approximately USD $25.7 million, and of USD $29.8 in year 10 (when there will be a full liberalisation of products in Category A). Moreover, the difference in revenue loss on a year-or-year basis will be lower in the non-ECOWAS Africa region.
| Year | Liberalisation scenario | |
|---|---|---|
| Category A | Category A + B | |
| T1 | −17,738.3 | −17,738.3 |
| T2 | −18,246.2 | −18,246.2 |
| T3 | −18,755.0 | −18,755.0 |
| T4 | −19,264.6 | −19,264.6 |
| T5 | −19,775.1 | −19,775.1 |
| T6 | −20,286.5 | −25,671.8 |
| T7 | −20,798.7 | −26,685.5 |
| T8 | −21,311.9 | −27,710.0 |
| T9 | −21,825.9 | −28,745.0 |
| T10 | −22,340.9 | −29,790.2 |
| T11 | – | −7988.5 |
| T12 | – | −8536.4 |
| T13 | – | −9092.6 |
| Tariff revenue loss at T13 | −200,343 | −257,999 |
Year-on-year difference in tariff revenue loss during the implementation period, in thousands of USD
4.3. Sensitivity Analysis and Robustness Test
Given that both exporter substitution and demand elasticity values are subject to high levels of uncertainty, it is good practice to conduct a sensitivity analysis when analysing the potential short-run impacts of tariff liberalisation regimes.
Unfortunately, TRIST does not have a built-in sensitivity analysis tool, and robust estimates of the three elasticities of the model (exporter substitution, domestic substitution, and the demand effect) are difficult to assess and not readily available in the literature (Cheelo et al., 2012).
As previously indicated, the sensible default elasticities used in this study are as follows: elasticity for the exporter substitution effect (1.5), elasticity for domestic substitution (1), and elasticity for the demand effect (KON WB). To assess the robustness of the results, sensitivity analysis was manually conducted by running a baseline simulation scenario using the default elasticities as the baseline. Then, the scenario of high value elasticity was simulated, following Brenton et al. (2009).13
Table 7 presents the robustness and sensitivity analysis of ECOWAS tariff liberalisation on tariff revenue and imports at the end of the implementation period (i.e. year 13). By increasing the elasticity for exporter substitution from 1.5 to 5, there was a projected tariff revenue reduction of USD $257 million with the default elasticities, and a reduction of USD $281 million with high elasticity—and respectively corresponding to losses of 12.5% and 13.6%. The change in elasticities also generally resulted in an increase in tariff revenue loss of about 9%. Additionally, as shown in the sensitivity results, ECOWAS total imports did not change significantly after simulating a high export substitution elasticity of 5.
| Default elasticity | High elasticity | ||
|---|---|---|---|
| Impact on tariff revenue | Tariff revenue pre-period | 2,062,782 | 2,062,782 |
| Tariff revenue post-period | 1,804,783 | 1,781,392 | |
| Change in tariff revenue | −257,999 | −281,391 | |
| % change in tariff revenue | −12.5% | −13.6% | |
| Impact on imports | Imports pre-period | 20,906,011 | 20,906,011 |
| Imports post-period | 21,280,452 | 21,300,301 | |
| Change in imports | 374,441 | 394,291 | |
| % change in imports | 1.8% | 1.9% | |
Robustness and sensitivity analysis of tariff revenue imports, in thousands of USD
5. CONCLUSION
This study has shown that tariff liberalisation under the AfCFTA will likely result in a gradual increase in tariff revenue loss over the 13-year liberalisation period currently proposed by ECOWAS. This is larger than previously reported. Liberalisation is not costless and, if it is not well designed, it can contribute to deindustrialisation in the domestic economy and further trade imbalances (Davies et al., 1998).
For ECOWAS, tariff revenue loss in a scenario where 97% of tariff lines (Categories A and B) are liberalised vis-à-vis non-ECOWAS Africa amount to around USD $262.7 million at the end of the 13-year implementation period. In a scenario where 90% of tariff lines (Category A) are liberalised, this figure is around USD $201.9 million. Sensitivity analysis suggests that these figures are robust.
The following caveats apply: we did not consider the existence of duty exemptions that might currently apply and we assumed full preference utilisation. The results might therefore overestimate the actual outcomes. On the other hand, tariff-equivalent border taxes, which are to be eliminated on imports from AfCFTA members, such as the statistical import levy (1%) and community levies (ranging from 0.5% to 1.5%), were not considered. Furthermore, losses in internal taxes, such as value added taxes, which are calculated on the price of imports inclusive of tariffs, were not calculated. More generally, caution that should be exercised when looking at tariff revenue loss obtained through a model designed for short-term analysis, especially toward the end of the 13-year implementation period.
An analysis of short-term revenue implications of tariff liberalisation under the AfCFTA included in Appendix J of World Bank (2020) arrived at a tariff revenue loss of approximately USD $54 million, based on TRIST. Differences in results between that analysis and this study can be explained by the parameters and the data used, such as data relating to a different year (2017 in this study), the number of ECOWAS countries included in the World Bank study (the World Bank did not include data from seven smaller ECOWAS countries), the level of liberalisation simulated (the World Bank study assumed 90% liberalisation, whereas we considered 90% and 97% liberalisation). Tariff losses for ECOWAS are likely to be larger than previously estimated because ECOWAS negotiates as a bloc and its selection of sensitive sectors exempted from liberalisation (Category C) is not optimised at the country level to minimise revenue loss.
In relation to total government revenue or the GDP of the ECOWAS region, these losses are relatively small. For example, Nigeria’s GDP in 2017 was USD $375.7 billion. If Nigeria were to bear all the annual tariff revenue loss in the ECOWAS region (at the end of the implementation period) for an offer liberalizing 97% tariff lines, it would represent 0.07% of Nigeria’s GDP.
There might be potential conflicts of interests in the identification of ECOWAS sensitive sectors (Category C) because ECOWAS negotiates AfCFTA offers as a bloc, whereas individual governments must foot the bill for the corresponding tariff revenue loss. Further research is needed to assess the distributional impacts across ECOWAS Member States.
The import response seems muted. That is, imports increase by 11.1% if products from Categories A and B are liberalised, increasing ECOWAS intra-African trade from 14.8% to 16.2%. Based on this study, the main worry of ECOWAS policymakers should not be a deluge of African imports competing with regional or domestic production. The results highlight that other policy measures beyond tariff liberalisation are needed to significantly boost intra-African trade.
While there are risks to the AfCFTA in terms of tariff revenue loss and an increase in imports, tariff concessions made by other African countries to ECOWAS may offer export opportunities for existing or emerging sectors, especially with respect to neighbours in Central Africa such as the CEMAC customs union, Democratic Republic of Congo, and Angola. These benefits also depend on the tariff offers proposed by these countries to ECOWAS. Further research is needed on the benefits of other African countries opening market access to ECOWAS exports.
6. POLICY RECOMMENDATIONS
Based on the results and conclusions of this study, the following policy measures are proposed to mitigate tariff revenue loss and their distributional impact, as well as to increase the benefits of the AfCFTA. These policy measures are important to consider with a view to maximizing the benefits from tariff concessions under the AfCFTA for ECOWAS governments and their constituencies.
Measures to mitigate tariff revenue loss:
- •
Carefully review the draft offer, with a view to reducing potential negative effects.
- •
Consider reducing reliance on import taxes by improving tax revenue administration inter alia through the expansion of the tax base and the simplification of procedures.
- •
Consider increasing the ECOWAS CET for selected products while eliminating tariffs under the AfCFTA.
- •
Safeguard the continued implementation of community levies and tariff-equivalent border taxes, which in principle should be eliminated under the AfCFTA.
Measures to mitigate the distributional impact of tariff revenue loss:
- •
Countries incurring disproportionately large revenue loss might have an interest in a compensation mechanism, such as a revenue sharing arrangement or increased funding for (regional) development projects. One method would be to harmonise the levels and implementation of the ECOWAS (0.5%) and West African Economic and Monetary Union community levies (1%) in such a way that it would increase the total revenue derived from these levies and prioritise spending for projects in countries likely to be affected most negatively by tariff liberalisation under the AfCFTA.
Measures to increase the benefits of the AfCFTA:
- •
Pending the conclusion of tariff negotiations, implement the standstill clause, as agreed by African Heads of State and government (see Section 1.4, above). This would maintain a margin of preference for ECOWAS exporters when other African countries increase their MFN tariffs.
- •
Advocate and agree on strict rules of origin within the AfCFTA for sectors where ECOWAS currently has productive capacity.
- •
Fully analyse the categorisation of products in offers prepared by non-ECOWAS countries or customs unions to ensure that products of export interest are covered.
CONFLICTS OF INTEREST
The authors declare they have no conflicts of interest.
AUTHORS’ CONTRIBUTION
Both authors contributed equally to this study.
ACKNOWLEDGMENTS
The authors thank Fernando Cantu (Senior Statistician, UNCTAD) and Guillermo Arenas (Economist, World Bank) for their contributions to this study and acknowledge the useful comments made by reviewers.
Footnotes
Fifty of the 55 AU Member States have ratified the Abuja Treaty; see https://au.int/en/treaties/treaty-establishing-african-economic-community.
These eight RECs are the Community of Sahel–Saharan States (CEN–SAD), the Common Market for Eastern and Southern Africa (COMESA), EAC, ECCAS, ECOWAS, the Intergovernmental Authority on Development, SADC, Arab Maghreb Union.
The West African Economic and Monetary Union (WAEMU, or UEMOA in French), a subset of mostly French-speaking countries in ECOWAS, is also a customs union.
CEMAC is a subset of Economic Community of Central African States (ECCAS) Member States and SACU is a subset of Southern African Development Community (SADC) Member States. ECCAS and SADC are AU-recognised RECs.
The figures for the countries in Table J.5 in World Bank (2020) do not seem to match the figures in Table J.4.
In most countries, tariffs are collected as a percentage of the cost, insurance, and freight import value. Our study utilises the ECOWAS CET. In our calculations, VAT and excise data were not included, due to data limitations.
In Brenton et al. (2009), the subscript ‘i’ is omitted on all arguments in the formula.
As mentioned above, descriptions of various simulation procedures can be found in Brenton et al. (2009) and Bacchetta et al. (2012).
Elasticities for domestic substitution can also be included if domestic production data are used in the simulation.
Mauritania indicated its wish to align with the ECOWAS offer, similar to the situation in the Economic Partnership Agreement negotiations with the European Union. Mauritania is not part of the ECOWAS customs union, but a separate trade agreement between ECOWAS and Mauritania agreement has been signed. The results for ‘ECOWAS’ in this paper should be read to include the results for ECOWAS and Mauritania.
Thanks to Fernando Cantu (Senior Statistician, UNCTAD) for his contribution.
We were provided with a draft of the ECOWAS offer, which is still under discussion within ECOWAS.
In Brenton et al. (2009), the default elasticities utilised were 0.5 for import demand elasticity and 1.5 for exporter substitution elasticity. However, in this study, the elasticity for the demand effect was the default KON WB elasticity set by Kee et al. (2004). As a result, the sensitivity analysis in this study only focused on export substitution elasticity, with a high elasticity of 5.
REFERENCES
Cite this article
TY  - JOUR
AU  - Peter Lunenborg
AU  - Thomas Roberts
PY  - 2021
DA  - 2021/10/17
TI  - ECOWAS and AfCFTA: Potential Short-Run Impact of a Draft ECOWAS Tariff Offer
JO  - Journal of African Trade
SP  - 103
EP  - 114
VL  - 8
IS  - 2 (Special Issue)
SN  - 2214-8523
UR  - https://doi.org/10.2991/jat.k.211011.001
DO  - 10.2991/jat.k.211011.001
ID  - Lunenborg2021
ER  -