
Playground-related Extremity Fractures in an Asian Setting over the Last Decade – Are We Safe?
- DOI
- 10.2991/jegh.k.190225.001How to use a DOI?
- Keywords
- Pediatric; orthopedic surgery; injury
- Abstract
The cost of playground-related injuries remains significant. Measures adopted to prevent such fractures or reduce their severity would translate into appreciable financial savings. Our study looks at the changes in playground-related extremity fracture epidemiology over the past decade after the implementation of latest playground standards. This is a retrospective case series approved by the local ethics board comparing the results of two descriptive studies; one conducted prior to the implementation of the Singapore Productivity and Standards Board Singapore Standards SS 457: 2007 and the other thereafter. The demographics have remained the same. The proportion of public playground injuries has fallen significantly from 89.6% to 76.3% (p < 0.05), whereas school playground injuries have risen from 5.9% to 18.0% (p < 0.05). Fractures related to monkey bars and the flying fox have shown a significant improvement, decreasing to 38.1% from 47.6% (p < 0.05) and 1% from 6.9% (p < 0.05), respectively. There has been a decrease of 33% in playground-related injuries. The total financial cost of sustaining one playground-related extremity fracture has generally increased by 50%. However, considering the 37.4% drop in surgeries, the actual overall costs to the healthcare system have essentially fallen. Safety standards have had a positive effect on playground safety in Singapore. There are now fewer and less severe playground-related extremity fractures.
- Copyright
- © 2019 Atlantis Press International B.V.
- Open Access
- This is an open access article distributed under the CC BY-NC 4.0 license (http://creativecommons.org/licenses/by-nc/4.0/).
1. INTRODUCTION
The cost of playground-related injuries remains significant. Measures taken to prevent such fractures or reduce their severity would translate into appreciable financial savings, both for the individual and the state [1]. Other aspects worth considering include psychosocial effects [2], time off the school [1], and complications of the fracture itself. Numerous studies have suggested certain safe playground equipment designs [3]. These were later implemented through standards such as the American Society of Testing Materials; F1487 – Standard Consumer Safety Performance Specification for Playground Equipment for Public Use. This standard was first published in 1993 and is revised every 3–4 years [4].
Locally, SPRING Singapore is the governing body for the safety of playground equipment. In 2007, it published the “Singapore Productivity and Standards Board Singapore Standards SS 457: 2007 (ICS 97.200.40); Specification for Playground Equipment for Public Use” based on international standards [5]. Significant changes to the playground equipment and surfacing have been introduced over the past decade. As a result of this, designs and material thought to be less safe have almost completely been phased out. The majority of playgrounds in Singapore today have been replaced with modular systems that are presumably safer and easier to maintain [6].
Our study looks at the changes in playground-related extremity fracture epidemiology over the past decade after the implementation of the latest playground standards and its associated costs, to examine if the new safety standards are truly safe from a musculoskeletal standpoint.
2. METHODS
This is a retrospective case series approved by the local ethics board comparing the results of two descriptive studies; one prior to the implementation of the Singapore Productivity and Standards Board Singapore Standards SS 457: 2007 and another thereafter.
The medical records of 1504 pediatric trauma cases registered during the period from January 2013 to December 2013 were reviewed. Their demographics, mechanism, and type of injury were obtained. The fractures were diagnosed radiologically by an independent orthopedician. Type(s) and cost(s) of treatment received were noted. Other factors explored included the equipment causing injury and the location of the playground.
The data obtained from this retrospective series was compared with previous prospective data from the same center from June 2005 to June 2006. All data were summarized either in tables or charts. Statistical analyses were performed using the SAS statistical software (version 9.4. SAS Institute Inc., NC, USA). A p value of <0.05 was considered statistically significant.
3. RESULTS
From January 2013 to December 2013, of the 1504 trauma cases, 194 were those of playground-related extremity fractures. This is compared with 290 cases during the one-year period from June 2005 to June 2006. The male to female ratio for both time frames have remained the same at 2:1. The mean age for playground injuries was 7.6 years in 2005–2006 compared with 7.4 years in 2013 (p = 0.3152). The other patient demographics are detailed in Table 1.
| June 2005–June 2006 (N = 290) | Jan 2013–Dec 2013 (N = 194) | p-Value | |||
|---|---|---|---|---|---|
| No. | Percentage (%) | No. | Percentage (%) | ||
| Gender | |||||
| Male | 194 | 66.9 | 137 | 70.6 | 0.2230 |
| Female | 96 | 33.1 | 57 | 29.4 | 0.2230 |
| Age (year) | |||||
| Mean | 7.6 | NA | 7.4 | NA | 0.2657 |
| Median | 7.4 | NA | 6.8 | NA | |
| Race | |||||
| Chinese | 174 | 60.0 | 96 | 49.5 | 0.0143 |
| Malay | 53 | 18.3 | 42 | 21.6 | 0.2117 |
| Indian | 48 | 16.5 | 45 | 23.2 | 0.0452 |
| Other | 15 | 5.2 | 11 | 5.7 | 0.4822 |
NA: not applicable.
Patient characteristics
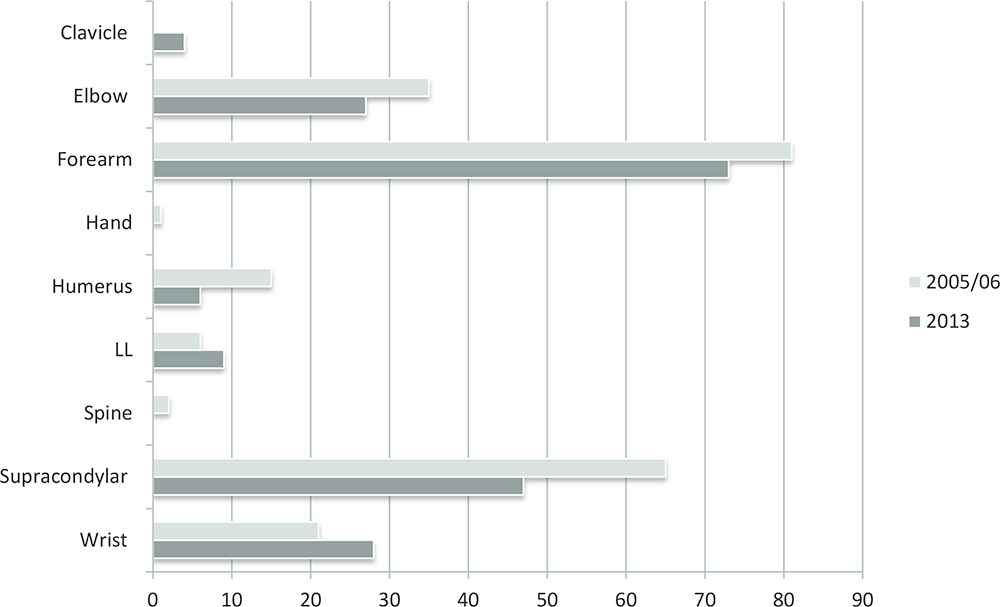
Forearm and supracondylar fractures of the humerus were the two most common fracture patterns in 2013 accounting for 38% and 28%, respectively (Figure 1). These values are similar to those of the 2005–2006 period with forearm fractures (38%) and supracondylar fractures of the humerus (24%) showing the highest numbers (Figure 1). Fractures of the humeral shaft, supracondylar fractures of the humerus, elbow, and forearm have all decreased from 13 to six cases, 82–47, 45–27, and 111–73, respectively (Table 2 and Figure 1). Computed as percentages of the total number of fractures, humerus, supracondylar, elbow, and forearm fractures were all found to decline from 2005–2006 to 2013, whereas the proportions of wrist and LL fractures, rose in 2013. Nonetheless, the p-values produced by Fisher’s exact test of equal proportions indicate that from 2005/6 to 2013, apart from wrist fractures that increased from 9% to 14% (p < 0.05), any change in the proportions of the various types of fractures was not statistically significant.
Column chart comparing the location of injury; 2005/06 with 2013
| June 2005–June 2006 (N = 290) | Jan 2013–Dec 2013 (N = 194) | p-Value | |||
|---|---|---|---|---|---|
| No. | Percentage (%) | No. | Percentage (%) | ||
| Location of injury | |||||
| Public | 260 | 89.6 | 148 | 76.3 | <0.0001 |
| Private | 13 | 4.5 | 11 | 5.7 | 0.3497 |
| School | 17 | 5.9 | 35 | 18.0 | <0.0001 |
| Nature of fractures | |||||
| Humerus | 13 | 4.5 | 6 | 3.1 | 0.3014 |
| Supracondylar | 82 | 28.3 | 47 | 24.2 | 0.1890 |
| Elbow | 45 | 15.5 | 27 | 13.9 | 0.3636 |
| Forearm | 111 | 38.3 | 73 | 37.6 | 0.4814 |
| Wrist | 26 | 9.0 | 28 | 14.4 | 0.0432 |
| Lower limb | 6 | 2.1 | 9 | 4.7 | 0.0927 |
| Others | 7 | 2.4 | 4 | 2.1 | 0.5305 |
| Playground equipment | |||||
| Swings | 7 | 2.4 | 4 | 2.1 | 0.5305 |
| Monkey bars | 138 | 47.6 | 74 | 38.1 | 0.0249 |
| Slides | 41 | 14.1 | 26 | 13.4 | 0.4646 |
| Flying fox | 20 | 6.9 | 2 | 1.0 | 0.0012 |
| Bridge | 3 | 1.0 | 1 | 0.5 | 0.4734 |
| Climbers | 10 | 3.4 | 5 | 2.6 | 0.3987 |
| Staircase | 13 | 4.5 | 8 | 4.1 | 0.5205 |
| Others | 58 | 20.0 | 74 | 38.1 | <0.0001 |
Location of injury, nature of fractures, mode of playground equipment causing fracture
In contrast, the percentage decreases in monkey bars and flying fox as causes of fractures were indeed significant. Fractures related to monkey bars and the flying fox have shown significant improvement both in absolute terms and as percentages of total fractures, decreasing to 38% (74 cases) from 48% (138 cases) (p < 0.05) and 1% (two cases) from 7% (20 cases) (p < 0.05), respectively (Table 2). The most common cause of fractures in 2013 was the monkey bar totalling to 74 (38%); followed by falls from a standing height causing 50 (26%), and slides causing 26 (13%) fractures (Figure 2). As for 2005–2006, monkey bars were the culprits for almost half the fractures (48%), followed by slides 14% (Figure 2).
Bar chart comparing the nature of fractures; 2005/06 with 2013
The operative rate was 6.6% for the previous period compared with 7.2% almost a decade later (p = 0.4559) (Table 3). Closed reduction percutaneous pinning (CRPP) was seen to fall slightly from 5.17% to 5.15% (p = 0.5814). Open reduction internal fixation (ORIF) was observed to rise from 0.7% to 1.5% (p = 0.3182). Open reduction percutaneous pinning (ORPP) was found to drop from 0.7% to 0% (p = 0.3585). Titanium elastic nailing system (TENS) increased from 0% to 0.5% (p = 0.4008). Admission days and the number of consultations remained the same at 2 days (p = 1.000) and four times (p = 0.0972), respectively. Cast duration was found to improve from 33 to 32 days (p = 0.4419) (Table 3).
| June 2005–June 2006 (N = 290) | Jan 2013–Dec 2013 (N = 194) | p-Value | |||
|---|---|---|---|---|---|
| No. | Percentage (%) | No. | Percentage (%) | ||
| Treatment type | |||||
| Non-operative | 271 | 93.4 | 180 | 92.8 | 0.4559 |
| Operative | 19 | 6.6 | 14 | 7.2 | 0.4559 |
| CRPP | 15 | 5.2 | 10 | 5.2 | 0.5841 |
| ORIF | 2 | 0.7 | 3 | 1.5 | 0.3182 |
| ORPP | 2 | 0.7 | 0 | 0 | 0.3585 |
| TENS | 0 | 0 | 1 | 0.5 | 0.4008 |
| Admission (days) | |||||
| Mean | 2 | NA | 2 | NA | 1.0000 |
| Cast duration (days) | |||||
| Mean | 32.6 | NA | 31.6 | NA | 0.4419 |
| Number of consults (times) | |||||
| Mean | 4.1 | NA | 4.0 | NA | 0.0972 |
| Length of follow-up (days) | |||||
| Mean | 70.2 | NA | 48.6 | NA | <0.0001 |
NA: not applicable, CRPP: closed reduction percutaneous pinning, ORIF: open reduction internal fixation, ORPP: open reduction percutaneous pinning, TENS: intramedullary titanium elastic nailing.
Treatment type, duration, and follow-up
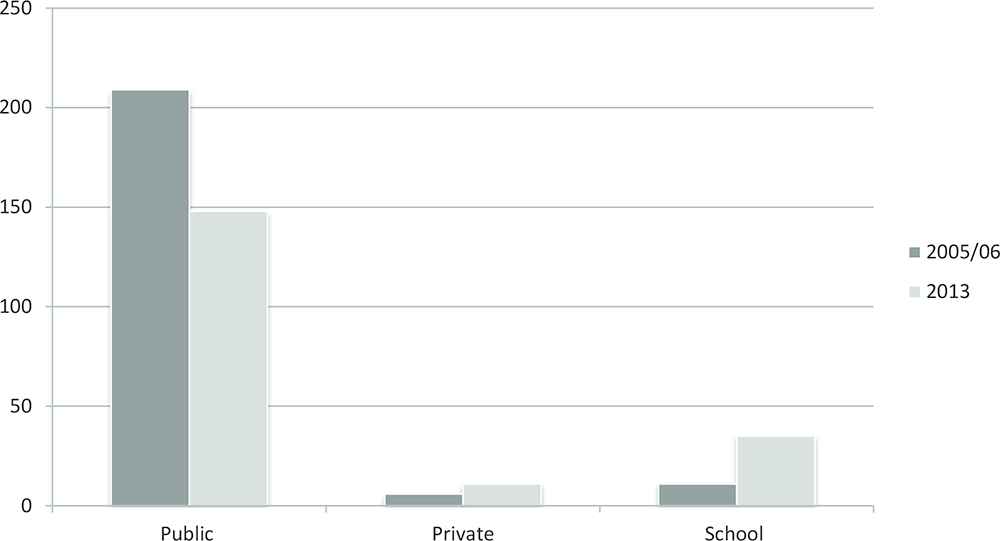
While the changes in the operative rate and cast duration were not statistically significant, it is important to note that there has been a statistically significant drop in the mean follow-up days from 70 to 49 days (p < 0.05). The percentage of public playground injuries have also fallen significantly from 90% (260 cases) to 76% (148 cases) (p < 0.05), whereas school playground injuries have risen from 6% (17 children) to 18% (35 children) (p < 0.05). In 2013, 148 (76%) cases occurred in public playgrounds, 35 (18%) in schools, and 11 (6%) in private locations (Figure 3). Of the 290 cases in 2005–2006, 90% happened at public playgrounds, 5% on private locations, and 6% in schools (Figure 3).
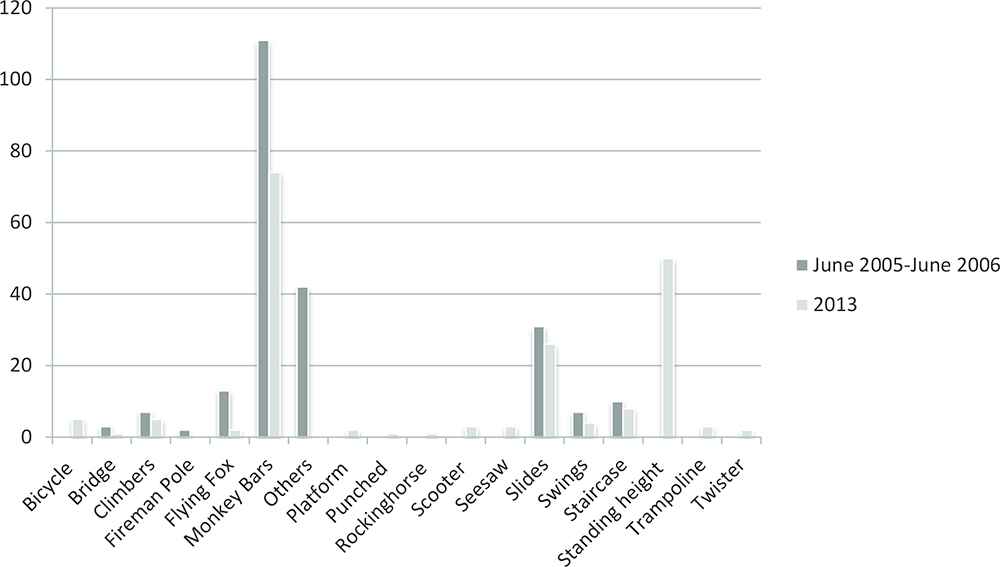
Column chart comparing the mode of playground equipment causing fracture; 2005/06 with 2013
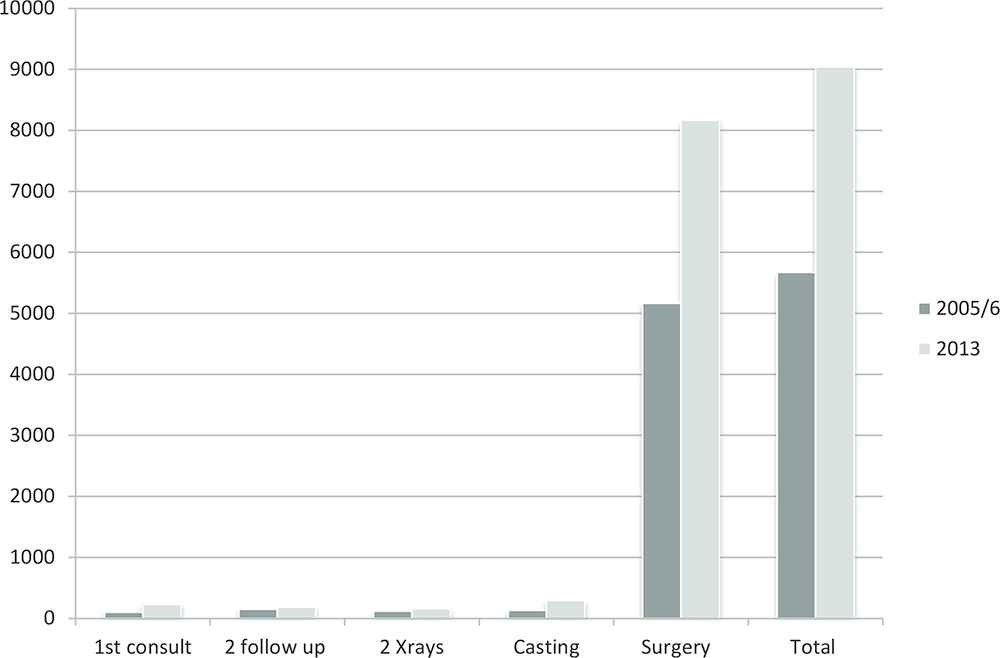
The total financial cost of sustaining a playground-related extremity fracture has generally increased by about 50%. In 2005–2006, the cost of sustaining a playground-related extremity fracture ranged from US$146.45 to US$2244.08 (Figures 4 and 5). In 2013, this varied widely from US$205.56 to US$3882.60 (Figures 4 and 5).
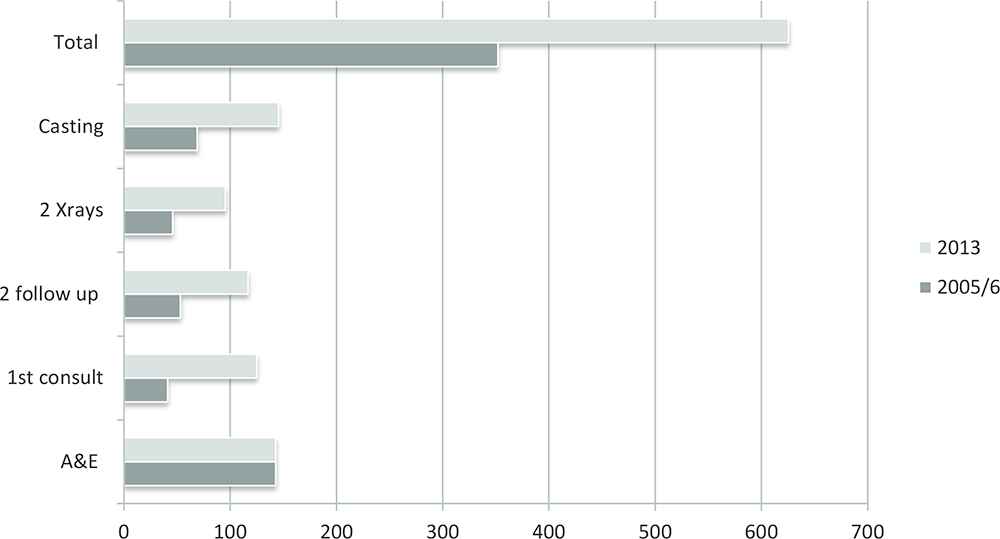
Column chart comparing the breakdown in outpatient costs (US$); 2005/06 with 2013
Column chart comparing the breakdown of inpatient costs (US$); 2005/06 with 2013
4. DISCUSSION
Numerous studies have been conducted on ideal playground equipment specifications and surfacing [3,7]. This study aims to assess the effectiveness of the 2007 SPRING guidelines [5].
The populations in this study are well-matched (Table 1). The ratio of males to females, 2:1 has remained constant over the past decade (Table 1) [8]. Breakdown according to race show that the percentage of injured Chinese children fell significantly from 60% (174 cases) to 50% (96 cases) (p < 0.05), whereas that of Indian children rose from 17% (48 cases) to 23% (45 cases) (p < 0.05). The mean and median ages of around 7 years closely relate to those found in other studies (Table 1) [3,9–11].
Singapore’s population has increased by 22.6% from 4,401,400 in 2006 to 5,399,200 in 2013 [12]. In addition, there has been a progressive increase in the population median age from 34.0 in the year 2000 to 38.9 in 2013. Conversely, the size of the population <15 years of age has fallen from 6,86,200 in 2006 to 6,15,200 in 2013 [12]. This represents a drop of 10.3% in the population. From this study, there has been a decrease of 33% in playground-related injuries at our center (Table 3).
Controlling for the main effects of age, race, gender, and location, it is not just the mode of playground equipment, but also the equipment’s location that most significantly affects the severity of the injury as measured by the length of the follow-up. Considering all these factors, our public playgrounds are indeed safer. In addition, as there are only two major pediatric orthopedic centers in Singapore one of which is our center, we can reasonably conclude that our sample size is statistically significant; hence, the sample dataset is representative of the entire population.
In the 1980s, the U.S. Consumer Product Safety Commission (CPSC) had a voluntary recall on monkey bars, advising that they were hazardous for public playground use [13,14]. A study conducted in the United States two decades later found that only 14% of the nation’s playgrounds still had monkey bars [14,15]. In Singapore, there has been a marked decline in both the number (64) and percentage of fractures due to monkey bar (9%; p < 0.05) (Table 2 and Figure 2). Reduction has also been seen across all other equipment categorized under “Others” (Table 2 and Figure 2). Furthermore, if we were to consider the length of the follow-up period as an indirect measure of fracture severity, we can see a 31% improvement from a mean of 70.2 to 48.6 days (p < 0.05) (Table 3). For this, we assume that the severer the fracture, the longer the follow-up period.
Injuries occurring on all playgrounds have become less severe on average, although only the 31% and 46% decrease in length of the follow-up for public and school playground injuries were statistically significant (Table 4). The proportion of fractures related to public area playgrounds has also decreased significantly to 76% (148 cases) from 90% (260 cases) (Table 2 and Figure 3). However, that related to school playgrounds increased by 12% (p < 0.05) from 6% (17 cases) to 18% (35 cases) (Table 2 and Figure 3). When we examined the length of the follow-up by location and equipment, we find that apart from the see-saw on public playgrounds, the declines in the follow-up days for monkey bars in public and school playgrounds were also statistically significant (Tables 5 and 6). This may reflect a greater effect of the new SPRING guidelines in public and school playgrounds, and the guidelines’ focus on the upper body equipment such as monkey bars [5].
| June 2005–June 2006 (N = 290) | Jan 2013–Dec 2013 (N = 194) | p-Value | |
|---|---|---|---|
| Race | |||
| Chinese | 79.9 | 49.1 | <0.0001 |
| Malay | 64.3 | 50.1 | 0.0467 |
| Indian | 48.4 | 45.8 | 0.6903 |
| Others | 47.9 | 50.7 | 0.8329 |
| Location of injury | |||
| Public | 67.1 | 46.2 | <0.0001 |
| Private | 87.1 | 56.5 | 0.0909 |
| School | 104.8 | 56.5 | 0.0188 |
Mean length of follow-up days by location of injury and race
| June 2005–June 2006 | Jan 2013–Dec 2013 | |
|---|---|---|
| p-Value | p-Value | |
| Location | 0.4103 | 0.2153 |
| Equipment | 0.2508 | <0.0001 |
| Age | 0.1594 | 0.2217 |
| Gender | 0.0643 | 0.9809 |
| Race | 0.0224 | 0.9239 |
| Location × Equipment | 0.0902 | 0.0065 |
| Location × Age | 0.3611 | 0.8270 |
| Location × Gender | 0.1357 | 0.8158 |
| Location × Race | 0.2685 | 0.6814 |
Statistical significance of main effects of location, equipment, age, gender and race, along with interactions effects between the location and equipment, location and age, location and gender, plus location and race in affecting the severity of injury
| June 2005–June 2006 (N = 290) | Jan 2013–Dec 2013 (N = 194) | p-Value* | |
|---|---|---|---|
| Public | |||
| Bicycle | – | 50.2 | NA |
| Bridge | 105.0 | 53.0 | 0.6272 |
| Climbers | 53.1 | 42.6 | 0.6107 |
| Fireman pole | 204.3 | – | NA |
| Flying fox | 77.1 | 57.0 | 0.6898 |
| Monkey bars | 60.5 | 40.5 | 0.0004 |
| Others | 71.6 | – | NA |
| Platform | – | 69.5 | NA |
| Punched | – | 53.0 | NA |
| Rocking horse | – | 42.0 | NA |
| Scooter | – | 33.0 | NA |
| See-saw | 72.0 | 23.7 | 0.0081 |
| Skateboard | – | 31.0 | NA |
| Slide | 66.1 | 53.1 | 0.2665 |
| Staircase | 74.7 | 58.1 | 0.5691 |
| Standing height | – | 48.0 | NA |
| Swings | 60.7 | 43.0 | 0.5741 |
| Twister | – | 120.0 | NA |
| Private | |||
| Fireman pole | 112.0 | – | NA |
| Flying fox | 55.0 | – | NA |
| Monkey bars | 78.4 | 65.7 | 0.8002 |
| Others | 103.5 | – | NA |
| Slide | 178.0 | 63.0 | NA |
| Staircase | 78.0 | – | NA |
| Standing height | – | 54.0 | NA |
| Trampoline | – | 48.3 | NA |
| School | |||
| Flying fox | – | 20.0 | NA |
| Monkey bars | 108.2 | 54.9 | 0.0262 |
| Others | 89.0 | – | NA |
| Skateboard | – | 91.0 | NA |
| Slide | – | 34.0 | NA |
| Standing height | – | 49.4 | NA |
| Swings | – | 27.5 | NA |
| Twister | – | 260.0 | NA |
p-Values calculated only where there were sufficient number of cases in 2005–2006 and 2013 to perform meaningful statistical analyses.
NA: not applicable.
Mean length of follow-up days by location of injury and mode of playground
In contrast, for the 2005–2006 dataset, equipment and the location of the equipment made no significant difference in the expected mean length of the follow-up. Race was identified as a significant variable instead (p < 0.05) (Table 5). As can be seen from Table 4, the mean lengths of the follow-up for Chinese and Malay children were much higher than those for the other races. However, after significant reductions in the mean follow-up period for these two groups of patients, race was no longer a significant factor in 2013 (p = 0.9239) (Table 5). As mentioned earlier, the percentage decline in the number of Chinese patients (p < 0.05) and the percentage increase in the number of Indian children (p < 0.05) was also significant (Table 1).
While the changing number of injuries occurring for each race or at each location type could be due to other factors not measured by our study such as the level of adult supervision or the oft-mentioned trend of worsening discipline in schools [16], it is clear that the big drop in follow-up days resulting from monkey bar injuries occurring in public and school playgrounds is statistically significant. We may, for example, argue that the significant difference in the number of injuries occurring at public versus school playgrounds is in part due to the fact that a child playing in public is normally supervised by at least one adult for the fear of other dangers such as kidnappers, whereas students are less closely monitored while within the confines of the school compound – the pupil to teacher ratio in Singaporean primary schools was reported to be 16.5:1 in the year 2013 [17]. Nonetheless, it is indisputable that there is statistical evidence to support our point that playground equipment in particular monkey bars located in public and school playgrounds have gotten safer, whereas there was no discernible difference in 2005 before the implementation of the new SPRING guidelines.
Apart from the length of the follow-up, we also saw a large reduction in the operation rate. These figures are at par with the decreased hospitalization rate as all our patients treated surgically are admitted for an average of 2 days for monitoring and pain control (Table 3).
Every effort made and the expenditure toward prevention is justifiable. The cost of sustaining playground-related extremity fractures in Singapore is significant [1]. Surgical costs alone can take up anything from one-sixth to half the average household income (Figure 5) [1]. Generally, over the past decade medical costs have risen. The increase is seen mainly in the initial clinical consultations and where material and instrumentation are needed; that is, cast application and surgery. The rise in first clinical reviews for non-subsidized patients was 79.5% as compared with 41.7% for subsidized cases (Figures 4 and 5). This is greater than the total inflation rise that averaged 2.8% over the same (2005–2013) period [12]. Interestingly, there has been a 28.6% rise in non-subsidized surgical costs, but a decline of 26.3% for the subsidized cases (Figure 5). If we were to consider the 37.4% drop in surgery, the actual overall costs to the healthcare system have been observed to have actually reduced. Apart from financial costs alone, school and parent’s work are affected as well; which further contributes to its “costs.” [1]
The main limitation of this study is that it is retrospective, and hence is based solely on the available medical records. Data accuracy is thus based on previous documentation. Another limitation is that it is single-centered. Nevertheless, it is important to note that this center is one of the only two major pediatric centers in the country. Not all cases of playground-related fractures would have presented to our center; however, our sample dataset should be statistically significant and hence representative of the entire population.
5. CONCLUSION
Our public and school playgrounds have been indeed found to be safer. This in turn means both financial and nonfinancial cost savings for the individual and state. Further research on the variations in playground specifications on childhood development or childhood injuries would be interesting. A large-scale study would be needed to look at the overall pattern and location of all pediatric injuries. A multicenter study would allow more comprehensive data collection. It would also be fascinating to assess whether the focus on playground specifications has improved the overall safety in children play or has there merely been a change in recreational locations or activities.
CONFLICTS OF INTEREST
We have no conflicts of interest to declare.
REFERENCES
Cite this article
TY  - JOUR
AU  - Kenneth Pak Leung Wong
AU  - Jeannie Leh Ying Wong
AU  - Arjandas Mahadev
PY  - 2019
DA  - 2019/03/27
TI  - Playground-related Extremity Fractures in an Asian Setting over the Last Decade – Are We Safe?
JO  - Journal of Epidemiology and Global Health
SP  - 50
EP  - 55
VL  - 9
IS  - 1
SN  - 2210-6014
UR  - https://doi.org/10.2991/jegh.k.190225.001
DO  - 10.2991/jegh.k.190225.001
ID  - Wong2019
ER  -