
Mean temperature and humidity variations, along with patient age, predict the number of visits for renal colic in a large urban Emergency Department: Results of a 9-year survey
- DOI
- 10.1016/j.jegh.2012.01.001How to use a DOI?
- Keywords
- Renal colic; Epidemiology; Climate; Temperature; Humidity; Age
- Abstract
Background: A marked geographic variability has been reported in stone disease, partially attributed to the Mean Annual Temperature (MAT), as well as to the seasonal fluctuations of climatic conditions. Accordingly, peaks in Emergency Department (ED) visits for renal colic are commonplace during the summer.
Materials and methods: The aim of this study was to assess the influence of day-by-day climate changes on the number of visits as a result of renal colic in the ED (City of Parma, northern Italy, temperate continental climate). A total of 10,802 colic episodes were retrieved from the database during a period of 3286 days (January 2002 to December 2010).
Results: The analysis of the data confirms a peak of renal colic cases during the summer, especially in July (maximum number of 4.1 cases of renal colic per day), and a winter nadir (minimum number of 2.7 cases of renal colic per day, in February). The linear regression analysis shows a high and significant correlation between the mean number of cases of renal colic per day and both the mean daily temperature (positive association, R = 0.93; p < 0.0001) and the mean daily humidity (negative association, R = −0.82; p < 0.0001). The influence of temperature and humidity on the incidence of renal colic cases varied widely among age groups, the highest incidence seen in patients aged between 30 and 40 years, and the lowest seen for those aged <20 and >70 years of age.
Conclusion: The combined data suggest that the hot and dry climate would favor an acceleration of the process of stone formation, which seems more pronounced in the older population.
- Copyright
- © 2012 Ministry of Health, Saudi Arabia. Published by Elsevier Ltd.
- Open Access
- This is an open access article under the CC BY-NC-ND license (http://creativecommons.org/licenses/by-nc-nd/4.0/)
1. Introduction
Urolithiasis, or kidney stone disease, is a common disorder, with a lifetime prevalence comprised between 7% and 12% in Western countries, accounting for approximately 600,000 Emergency Department (ED) visits per year in the United States [1,2]. The male-to-female ratio is approximately 3–4:1 [3], with the peak of incidence in the ages between 20 and 50 years [4]. A racial influence exists with regard to kidney stone disease, being nearly three times more likely in Caucasians than in Black Americans, with Hispanics and Asians at an intermediate risk [5]. The recurrence rate is 30–40% at 5 years, although certain dietary and/or pharmacological treatments can substantially reduce the recurrence rate up to 50% [5,6]. The pathogenesis of renal calculi is intricate and multifaceted, and varies according to the composition of the stone/s. The exact pathways that lead to kidney stone formation are as yet mostly unknown. Kidney stones develop in response to a kaleidoscope of environmental and/or metabolic risk factors, when the salts dissolved in the urine reach a supersaturation point, leading to the generation of the crystal. Low urine volume, an important factor mostly of an environmental nature, directly increases the risk of stone formation by increasing the urinary saturation of stone-forming salts. Stone disease shows marked geographic variability worldwide. In the southeast region of the United States, a 50% higher prevalence of stone disease has been reported as compared with the northwest [7]. Mean Annual Temperature (MAT) has been estimated to account for 70% or more of this variability, being 8 °C higher in the southeast [7]. The stone problem in the tropics is compounded by low urine volumes originating both from the poor quality of drinking water and diarrhea, and from the hot climate and fluid losses through the skin [8]. Overall, renal colic is relatively infrequent in Nigeria and among South-African Bantus, but is much more frequent in Kuwait and Saudi Arabia [9–12]. Several studies in Japan, Saudi Arabia, Iran, Iraq, Norway, England and Wales described a strong prevalence of renal colic in the hottest months [13–19]. A study carried out in Kuwait failed to observe any seasonal correlation [20]. Beside regional variations, evidence is mounting that the overall prevalence of stone disease is increasing in Western societies [7,21,22]. Transient variations in stone prevalence, such as those observed in desert military deployments [23], as well as seasonal cyclicity [24], might also be caused by temperature variations. Borghi et al. found a fourfold increase in the prevalence of nephrolithiasis in workers of a glass factory, exposed for at least 5 years to a hot working environment [25]. Atan et al. reported a ninefold higher risk of lithiasis in male employees from a steel industry [26]. The physiologic time of response to these climate changes, which is generally rapid, is also noteworthy. In one study, the peak time for stone development occurred 90 days after military deployment into a hot, arid climate [27]. Stressful life events, too, have been found to be associated with an increased risk [28]. Nevertheless, less is known about the influence of the climate on the incidence of symptomatic stones (i.e., renal colic) causing ED visits according to the research undertaken for this study. Not surprisingly, Chauhan et al. reported that renal colic visits were 16% more likely in warmer than in colder months in a retrospective study, and that this effect was greater in older and in male patients [29]. Chen et al. showed a seasonal trend, peaking in July, in the monthly urinary calculi attack rates in a retrospective study on a Taiwanese population [30]. Boscolo-Berto et al. studied 1163 consecutive patients with acute renal colic, and found an association between the onset of symptoms and exposure to hot and dry weather, particularly for temperatures above 27 °C and humidity below 45% [31]. In a survey of cases of renal colic in an urban ED, Cupisti et al. found a seasonal distribution, peaking in July [32]. Similar findings were reported by Pincus et al. wherein a significant positive correlation was found between the mean monthly maximum temperature and both the absolute number and rate of presentations [33]. Al-Hadramy evaluated the incidence of renal colic in relation to temperature, humidity, atmospheric pressure, and fasting status during Ramadan in a Saudi Arabian population. A strong correlation was observed between colic episodes and both temperature and atmospheric pressure, whereas no significant correlation was observed with regard to humidity and Ramadan fasting [13]. A strong association between air temperature and number of ED visits for renal colic, as well as a strong association with air temperature in the period (i.e., 5–7 days) preceding the renal colic was previously demonstrated with continental and temperate climate in the region of Italy [34]. Data on the influence of humidity and the relationship of temperature/humidity (i.e. the so-called humidity index), as well as data regarding the different influence exerted by the aforementioned factors on different age groups, are however lacking within the scope of this study. Therefore, the aim of this investigation was to assess the influence of day-by-day climate changes, including temperature and humidity, on the number of visits due to renal colic in the local ED.
2. Materials and methods
All the records of the patients who visited the ED of the University Hospital of Parma for renal colic from 1 January 2002 to 31 December 2010 (3286 days) were extracted from the local database. The data were retrieved using both the ICD-9 code 7880 and the term “renal colic” and were successively reviewed for deleting wrong registrations. The colic episode has been defined in this study as a typical flank pain/tenderness associated with the identification of a stone and/or hydroureter of more than 6 mm in diameter, and/or perirenal urinoma by ultrasonography. In the local hospital, especially in the earlier years of the study, Computed Tomography (CT scan) was rarely used for this diagnostic purpose. There is no information regarding stone composition. None of the patients had hypercalcemia during the ED evaluation. Data regarding the precise onset of symptoms is also lacking, but in the local area, it is considered a good and healthy practice to present to the ED as soon as possible in case of any chest or abdominal pain. It is very rare for the same patient to return to the local ED for the same colic episode, because every patient discharged from the ED is typically referred to a urologic outpatient follow-up. Seventy-two cases of multiple visits for the same colic episode were deleted, and only the first visit was considered. The demographics of the patients are shown in Table 1. For all the 3286 observed days, the meteorological data about the Parma Province were obtained from ARPA (Agenzia Regionale Prevenzione e Ambiente; Environment and Climate Regional Agency) [35]. The site of the measurements was at 10.330313 longitude; 44.808064 north latitude; height 54 m above sea level. The climate at that site is considered typical of the central-southern Pianura Padana area (the Po river valley), i.e., continental with 777 mm precipitation per year, peaking in fall and spring. The peak of raining season is in October (110.2 mm per day), whereas the driest month is July (37.6 mm per day). The summer is hot, with temperatures of 30–35 °C (maximum 40.2 °C recorded on July 29, 1983), whereas the winter is cold (minimum −23.4 °C recorded on January 10, 1985). The relative mean humidity in the area was 71% throughout the years of the study (minimum 28.2% on March 3, 2009 and maximum 99.8% on January 12, 2005). In the Province of Parma there is an extended mountain area, and the maximum concentration of population is in the valley (43% of the whole population, with a density of 588.8 inhabitants per square kilometer). The population of the Province was 437,349 in 2010 (with an incremental trend, since in 2002 it was 402,330), 186,546 of which was within the city of Parma. The foreigners living in the Province of Parma represented 4.3% of the population in 2002, increasing to 12.8% in 2009. Tourism in the Province of Parma is not well developed, and the vast majority of the population is represented by residents. All the air temperature and humidity measurements used for this study were performed on a 1-hour basis, and the mean temperature and humidity of each single day was then calculated.
| Age | Total | Male | Female |
|---|---|---|---|
| <20 | 315 | 223 | 92 |
| 21–30 | 1919 | 1358 | 561 |
| 31–40 | 2681 | 1853 | 828 |
| 41–50 | 2219 | 1571 | 648 |
| 51–60 | 1698 | 1212 | 486 |
| 61–70 | 1153 | 786 | 367 |
| 71–80 | 595 | 433 | 162 |
| 81–90 | 206 | 135 | 71 |
| >90 | 16 | 9 | 7 |
| Total | 10,802 | 7580 | 3222 |
Demographics of the examined population.
2.1. Statistical analysis
The chronological data of all the visits for renal colic were interfaced with the climate data in univariate and multiple linear regressions analysis using the program Mathematica7®. A linear model was constructed with assumed independent normally distributed errors, giving a formatted analysis of variance table for the model (ANOVA), see Figs. 3 and 4. The t statistics are the estimates divided by the standard errors. Each p-value is the two-sided p-value for the t statistic and can be used to assess whether the parameter estimate is statistically significantly different from 0. In particular, the following have been computed:
- •
The univariate linear regression analysis between the number of visits for renal colic and the mean daily temperature (°C);
- •
The univariate linear regression analysis between the number of visits for renal colic and the mean daily humidity (%);
- •
The multiple linear regression analysis between the number of visits for renal colic and the mean daily temperature and mean daily humidity; and
- •
The multiple linear regression analysis between the number of visits for renal colic and the mean daily temperature and mean daily humidity, divided for age groups.
3. Results
The local ED registered 725,812 patient visits over the observational period, with an average of 221 patients per day. A total of 10,802 renal colic cases were observed during the same period (1.49% of total ED visits), with a mean number of 3.2 (range 0–12) per day. The triage codes for the patients subsequently diagnosed as having renal colic were as follows: 0.8% white (non-urgent), 37% green (low acuity), 62% yellow (acute), and 0.2% red (critical). The mean age (±standard deviation) of the patients was 44 ± 16 years. The total number of ED visits increased from 80,538 in year 2002 to 83,919 in year 2010, thus showing a positive incremental trend. The number of patients who visited for renal colic cases showed a similar but larger incremental trend, from 986 in the year 2002 to 1322 in the year 2010 (with a maximum of 1407 in the year 2008), showing a strong seasonal fluctuation (Fig. 1). On an annual basis, the peak of visits for renal colic occurred in July with an averaged number (i.e., 4.1 colic cases per day), and the nadir in February (i.e., 2.7 colic cases per day) (Fig. 2). On a weekly basis, the peak was recorded on Monday, with a nadir on Sunday. According to the time of the day, the peak was observed between 8 and 10 a.m., with a second minor peak between 7 and 10 p.m., and the nadir between 1 and 3 a.m. A strong positive linear correlation was observed between the number of colic cases and daily temperature (T) (R = 0.93; P < 0.0001), which was described by the following formula:

Number of renal colic episodes per month, years 2002–2010. The absolute numbers per year are: 986, 1065, 1094, 1149, 1258, 1294, 1407, 1226, and 1322.
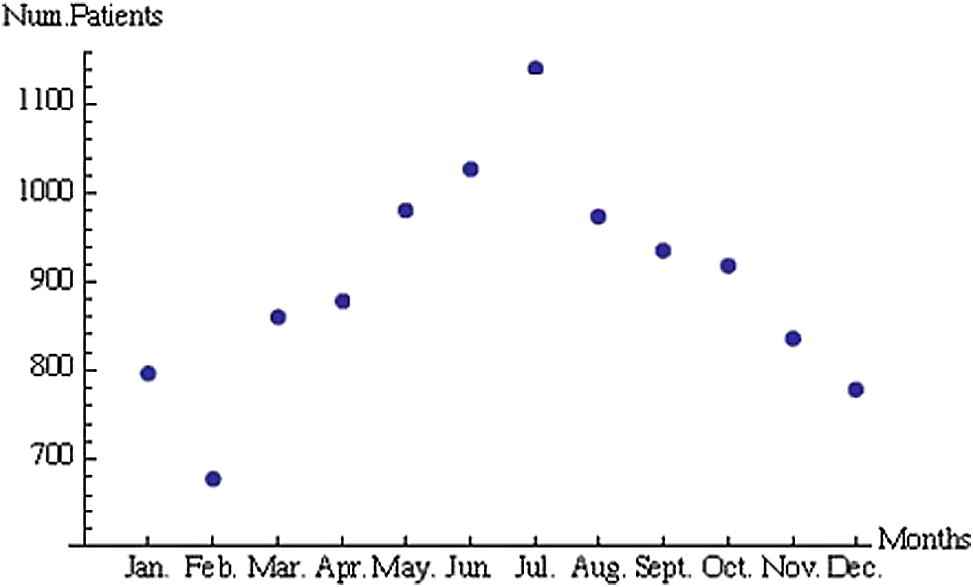
Monthly distribution of renal colic episodes, years 2002–2010. The absolute numbers are: 796, 678, 859, 877, 981, 1027, 1142, 974, 936, 919, 835, and 778.
Mean temperature (T) strongly influenced the number of visits for renal colic, i.e., for winter days with a T near 0°C the averaged number of colic cases a day was 2.7, while on a hot summer day with T near 30°C the averaged number of colic cases a day was 4.0, with an increase of 52%. A strong negative linear correlation was also found between the number of colic cases and the daily humidity (H) (R = −0.82; P < 0.0001) (Fig. 3), which was described by the following formula:
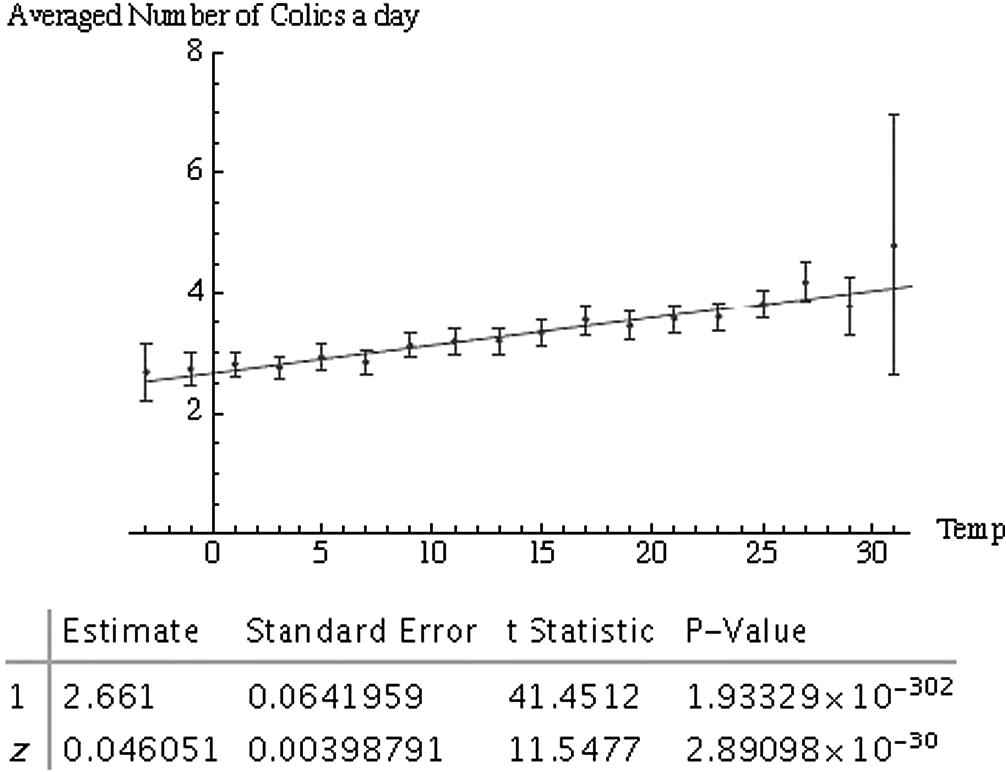
Linear correlation between average number of colic cases per day and mean temperature.
Mean humidity (H) exerted a strong, albeit opposite, influence on the number of visits for renal colic. On winter days with H close to 99%, the averaged number of colic cases per day was 2.7, whereas on a dry summer day with H close to 32%, the averaged number of colic cases per day was 4.1, with an increase of 53%. Finally, a strong linear correlation was found between the number of colic cases and the daily humidity (H) and temperature (T) (p < 0.0001) (Fig. 4) by multivariate analysis, which was described by the following formula:
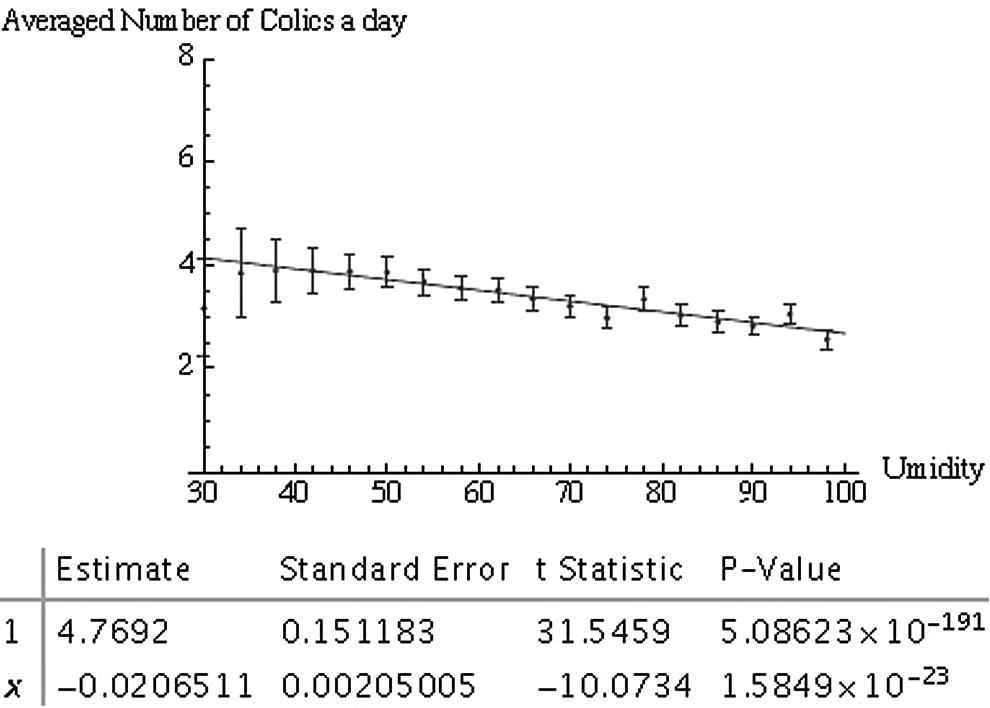
Linear correlation between average number of colic cases per day and mean humidity.
This means that for winter days with T = 0 °C and H near 99%, the averaged number of colic cases per day was 2.6, whereas on a dry summer day with T = 30 °C and H near 30% the number of colic cases was found to be 4.6, with an increase of 66% (Fig. 5). The influence of T and H on the number of visits for renal colic, stratified according to the age of the patients, is shown in Figs. 6 and 7, where it was evident that renal colic cases in younger people (aged <40 years) are less influenced by T and H than in older patients. It is noteworthy that although a 10 °C increase of T (from 0 to 10 °C) led to a 10.1 ± 2.6% increase of colic episodes in the 30–40 age group, in the 50–60 age group the observed increase was 28.8 ± 3.9%. In the youngest group (age <20 years), the same 10°C increase of T led to a decrease in the number of colic cases (i.e., −4.3 ± 7.5%), despite the limited number of patients in this age group. Humidity also exerted a strong influence, dependent on the age group. Although a 20% increase of H (i.e., from 50% to 70%) led to a −5.1 ± 1.1% decrease in the 30–40 age group, in the 50–60 age group the observed increase for the same H variation was 15.1 ± 1.2%.
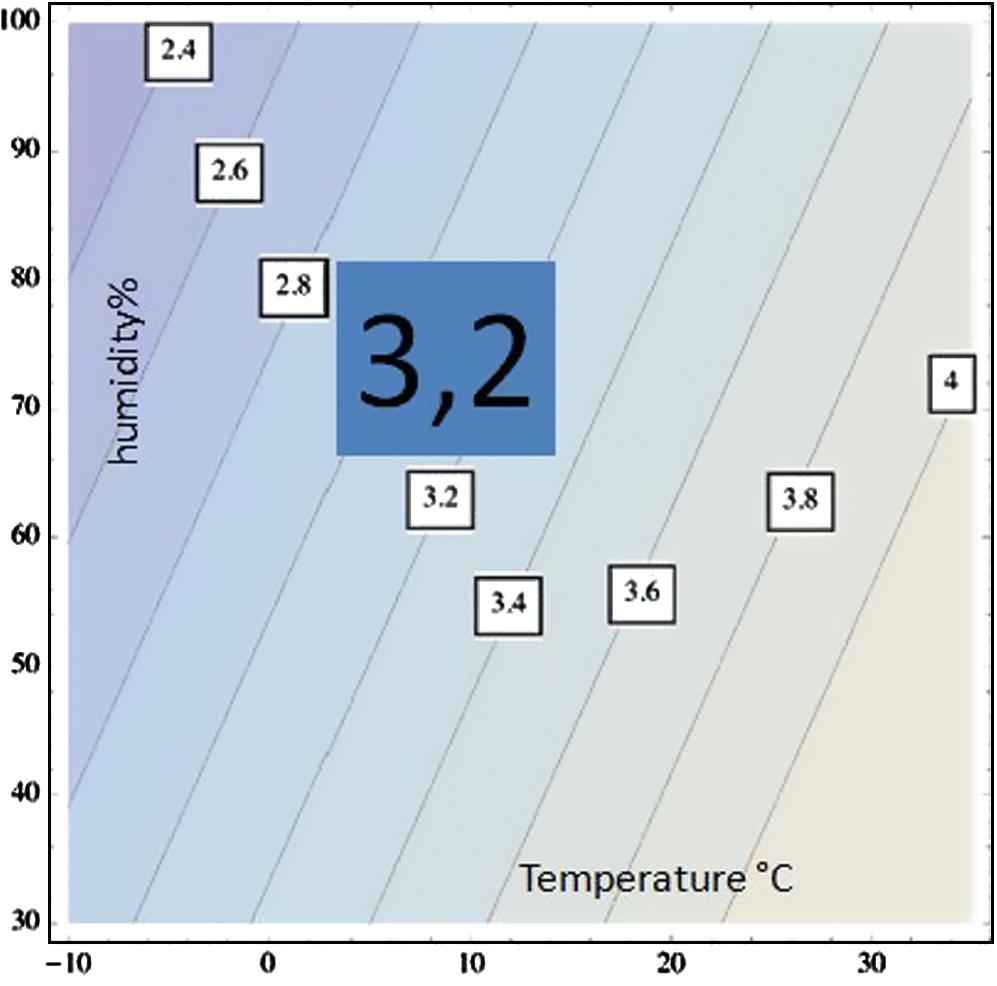
In this figure, contour levels of the constant number of colic cases per day are shown in the ED of Parma, describing the relationship: number of colic cases = 0.034 T − 0.0098 H + 3.52 (where T is mean temperature in °C while H is the mean humidity in %). Such a relationship is coming from a multivariate analysis characterized by the following statistical properties.
| Estimate | Standard error | t-Statistic | p-Value | |
|---|---|---|---|---|
| 1 | 3.52311 | 0.238713 | 14.7587 | 8.99491 × 10−48 |
| H | 0.341679 | 0.00508793 | 6.71548 | 2.200224 × 10⁻¹¹ |
| T | 0.00975994 | 0.00260331 | −3.74904 | 0.00018057 |
To the left, the region with less colic cases than the average is noted and to the right, the region with higher rescue is noted.

In this figure the differential distribution is shown for the % increase of colic cases (for a given interval of temperature) where the whole number of colic cases has been divided with the age of the patients. Blue points are the % increase (with relative one sigma error bars) for renal colic cases when the temperature is going from 0 to 10 °C. Red points are the % increase (with relative one sigma error bars) for renal colic cases when the temperature is going from 10 to 20 °C. Black points are the % increase (with relative one sigma error bars) for renal colic cases when the temperature is going from 20 to 30 °C.

In this figure the differential distribution is shown for the % increase of colic cases (for a given interval humidity) where the whole number of colic cases has been divided with the age of the patients. Blue points are the % increase (with relative one sigma error bars) for renal colic cases when the humidity is going from 30% to 50%. Red points are the % increase (with relative one sigma error bars) for renal colic cases when the humidity is going from 50% to 70%. Black points are the % increase (with relative one sigma error bars) for renal colic cases when the humidity is going from 70% to 100%.
4. Discussion
This study is the largest ever conducted correlating short-term variation of climate and number of episodes of renal colic. There are two main findings in this epidemiological investigation. First, the existence of a strong association was confirmed between air temperature, relative humidity, and number of episodes of renal colic in a region with continental, temperate climate. Secondly, a heterogeneous influence of temperature and humidity was demonstrated according to the age of the patients, in that variations of temperature and/or humidity were apparently less effective with regard to influencing the onset of renal colic cases in younger people (i.e., age <40 years) than in the older age group. There are different explanations for this novel finding. Dehydration is a common occurrence among older adults, especially among the frail elderly, and is also commonplace in older persons treated in EDs, being one of the 10 most frequent diagnoses reported for hospitalizations of patients aged >65 years [36,37]. The older adult is prone to problems in maintaining water homeostasis and is more susceptible to dehydration for a variety of reasons (i.e., relative reduction of total body water in the elderly as a result of a gradual decrease in lean body mass, and structural as well as functional changes in the ageing kidney) [38,39]. Moreover, the perception of thirst is also decreased with ageing [40,41]. All these factors result in summer dehydration and would explain a stronger lithogenic tendency, as reflected in this study. Renal colic is due to a partial, or complete, acute urethral obstruction mainly caused by a stone, with overstretching of the upper ureter and/or renal capsule [3]. It is widely acknowledged that the formation of the stones is a process that requires weeks or months to develop [27]. As such, the main issue to be addressed is the reason for the strong correlation that has been observed in this investigation and a sort of “acceleration” seems to be the most reasonable explanation. Probably, the dehydration caused by the hot climate might trigger a sudden growth of the stone and the following clinical episode. When the urine output is <1 L/day, the risk of stone formation is markedly enhanced. Observational studies as well as a randomized controlled trial have demonstrated the importance of fluid intake for reducing the likelihood of stone formation [42,43]. The absolute amount of ingested water is crucial in preventing recurrence rate, and a reasonable target urine volume would be in the range between 2 and 2.5 L [3]. A reduction in dietary supply of animal proteins and salt, along with a normal calcium intake, might be more protective than the reduction of calcium intake against the recurrence of renal stones in patients with hypercalciuric, calcium-oxalate stones [6]. It is also noteworthy that the population of the local area tends to eat more fruits during the summer, and the vitamin C (ascorbic acid) contained in the fruits may contribute to this rapid process [44]. Since vitamin C is metabolized to oxalate, a higher intake could thus increase the risk of calcium oxalate stone formation (a previous metabolic trial has demonstrated that the consumption of 1000 mg of supplemental vitamin C twice daily increases urinary oxalate excretion by 22%) [44]. An observational study found that males who consumed 1000 mg or more per day of vitamin C had a 40% higher risk of stone formation as compared with those who consumed less than 90 mg/day (i.e., the recommended dietary allowance) [45]. Although a restriction of dietary vitamin C intake seems inappropriate because foods with a high content of vitamin C also contain large amounts of inhibitory factors for stone formation (e.g., potassium), a patient who has previously suffered from calcium oxalate stones should hence be encouraged to avoid vitamin C supplements. The results of this study suggest that specific periods of temperature and humidity exposure might be associated with different risks of renal colic. The difference is much stronger in older people. Additional research is needed to demonstrate whether an intervention such as encouraging an increase of fluid intake during these periods of increased climate-associated risk can reduce the frequency of renal colic episodes. At present, the conventional suggestions and practices for prevention of specific types of stones, well established in the literature, should not be abandoned, but, rather they should be encouraged.
References
Cite this article
TY  - JOUR
AU  - G. Cervellin
AU  - I. Comelli
AU  - D. Comelli
AU  - T. Meschi
AU  - G. Lippi
AU  - L. Borghi
PY  - 2012
DA  - 2012/03/27
TI  - Mean temperature and humidity variations, along with patient age, predict the number of visits for renal colic in a large urban Emergency Department: Results of a 9-year survey
JO  - Journal of Epidemiology and Global Health
SP  - 31
EP  - 38
VL  - 2
IS  - 1
SN  - 2210-6014
UR  - https://doi.org/10.1016/j.jegh.2012.01.001
DO  - 10.1016/j.jegh.2012.01.001
ID  - Cervellin2012
ER  -