
Population structure and the burden of disease in the United Arab Emirates☆
- DOI
- 10.1016/j.jegh.2012.04.002How to use a DOI?
- Keywords
- Burden of disease; Population structure; United Arab Emirates
- Abstract
To carry out their duties more effectively, health care professionals in the UAE often ask about the population structure and the main causes of mortality and morbidity in the country. This paper summarizes what is known about these topics drawing on secondary data sources that are available in the public domain, including census data, population estimates, births and deaths, proportionate mortality, age-standardized mortality rates and disability adjusted life-years. There are inconsistencies and flaws in some of this data which this paper will highlight and attempt to explain. Since 2005, the UAE population has grown substantially owing to high natural growth and high net inward migration and is currently estimated to be about 8.2 million. In 2008, injuries, heart disease, neoplasms and cerebrovascular disease accounted for 57% of deaths, and this is well known. Less is reported about the risk of death, disease, injury and disability. The population of the UAE is diverse, and there are variations in mortality and morbidity risk by age-group, sex and nationality. The authors recommend improvements in the timeliness, completeness and consistency of data. They conclude that better data will encourage more analysis which will generate health intelligence leading to health improvement for the UAE population.
- Copyright
- © 2012 Ministry of Health, Saudi Arabia. Published by Elsevier Ltd.
- Open Access
- This is an open access article under the CC BY-NC-ND license (http://creativecommons.org/licenses/by-nc-nd/4.0/)
1. Introduction
Newcomers to the United Arab Emirates (UAE) health care system usually ask about two things: the size and make-up of the population and the main causes of death and disease. It is natural that practitioners will want to know about these matters so that they can better meet the health needs of their patients. Answers are even more essential for those who will be involved in health planning and decision-making and those who will be teaching a new generation of health professionals and conducting research.
The UAE has made remarkable progress in the past 40 years and has made substantial investments to ensure that its administrative functions are of international quality. It is therefore perhaps surprising that information on the UAE population, on mortality and on health is sometimes fragmentary and inconsistent. In this brief essay, data on the UAE population and the burden of disease that affects it will be collated and summarized. The purpose of this summary is to help practitioners, students, researchers and policy makers to focus their work more effectively, to improve curative and preventative services and thereby bring about improvements in population health. In addition, recommendations will be made for improving data access and quality in the future.
2. Methods
In writing this paper the authors have used a range of secondary data sources that are available in the public domain. This data included census data, population estimates, births and deaths, proportionate mortality, age-standardized mortality rates and disability adjusted life-years. The sources were identified by a search of the websites and publications of UAE government departments and agencies, including the UAE Federal Bureau of Statistics and the UAE Ministry of Health. In addition, websites and publications from the institutions of individual Emirates were examined. These include the health authorities and statistical departments of the Emirates of Abu Dhabi and Dubai. Finally, data published by the World Health Organization and its regional office was reviewed. The source of each dataset is acknowledged in the text.
3. Population
The UAE has an annual population growth of 3.3% which places it sixth in the world rankings [1]. Population growth is made up of natural growth (births minus deaths) and growth from net migration. Of the other countries at the top of the population growth league, most are low-income African countries with high natural growth, whereas the UAE has both high natural growth and high net migration. In fact, it is ranked third in the World on net migration (19/1000 per year) [1]. High population growth means that population counts enumerated in formal censuses quickly become inaccurate. The last census in the UAE was carried out in 2005 when the population was 4.1 million (Table 1) [2]. At that time, of the seven Emirates that make up the UAE federation, Abu Dhabi, Dubai and Sharjah were the most populous. Overall, 20% of the population were Emirati nationals, but that overall proportion concealed important geographical variations. The highest absolute number of nationals was in Abu Dhabi while the highest proportions of nationals were in Ras Al Khaima, Fujeirah and Umm Al Quwain. The populations of Dubai, Sharjah and Ajman had the smallest proportion of nationals. Most people appreciate the economic importance of Abu Dhabi within the UAE, but this data shows that it also has considerable demographic significance.
| National | Non-national | Total | Proportion (%) of nationals | |||||||
|---|---|---|---|---|---|---|---|---|---|---|
| Emirate | M | F | T | M | F | T | M | F | T | |
| Abu Dhabi | 176,926 | 173,351 | 350,277 | 749,893 | 299,314 | 1,049,207 | 926,819 | 472,665 | 1,399,484 | 25.0 |
| Dubai | 68,995 | 68,578 | 137,573 | 920,310 | 263,570 | 1,183,880 | 989,305 | 332,148 | 1,321,453 | 10.4 |
| Al Sharjah | 71,307 | 66,965 | 138,272 | 448,927 | 206,374 | 655,301 | 520,234 | 273,339 | 793,573 | 17.4 |
| Ajman | 20,155 | 19,076 | 39,231 | 111,529 | 56,237 | 167,766 | 131,684 | 75,313 | 206,997 | 18.9 |
| Umm Al-Quwain | 7914 | 7959 | 15,873 | 22,170 | 11,116 | 33,286 | 30,084 | 19,075 | 49,159 | 32.2 |
| Ras Al Khaima | 44,299 | 43,549 | 87,848 | 85,143 | 37,072 | 122,215 | 129,442 | 80,621 | 210,063 | 41.8 |
| Al Fujairah | 28,321 | 28,100 | 56,421 | 50,263 | 19,014 | 69,277 | 78,584 | 47,114 | 125,698 | 44.9 |
| Total | 417,917 | 407,578 | 825,495 | 2,388,235 | 892,697 | 3,280,932 | 2,806,152 | 1,300,275 | 4,106,427 | 20.1 |
Source: 2005 Census/Ministry of Economy.
UAE Population by Emirate, Nationality and Sex, 2005.
Since the 2005 census, the UAE population has grown naturally by between 56,000 and 68,000 per year, which is the difference between births and deaths. In addition, there has been significant net migration which in 2008 was 58,000. Net inward migration depends on the economy and was reported to have been much higher between 2005 and 2007 when the prevailing economic situation was more favorable [3]. The UAE census that had been planned for 2010 did not take place and so currently there is reliance on population estimates based on actual 2005 census figures amended using administrative data for births and deaths, data on residence (work) visas issued and cancelled and entry/departure data for citizens of Gulf Co-operation Council (GCC) countries. For non-nationals, the Ministry of Interior currently records the place of visa issue rather than the place of residence, so data on the Emirate of residence, although available for nationals, is not known for non-nationals. Using this methodology, at the end of 2009 the UAE population was 8.2 million, of which 933,381 (11.4%) were nationals (Table 2.). The latest estimate for mid-2010 is 8.26 million, although this is an extrapolation because administrative data on which to base a more robust estimate is incomplete. This figure of 8.26 million is the one that is usually quoted in the local media.
| National | Non-national | Total | Proportion (%) of nationals | |||||||
|---|---|---|---|---|---|---|---|---|---|---|
| Emirate | M | F | T | M | F | T | M | F | T | |
| Abu Dhabi | 200,857 | 197,291 | 398,148 | n/a | n/a | n/a | n/a | n/a | n/a | n/a |
| Dubai | 82,408 | 82,040 | 164,448 | n/a | n/a | n/a | n/a | n/a | n/a | n/a |
| Al Sharjah | 77,874 | 73,632 | 151,506 | n/a | n/a | n/a | n/a | n/a | n/a | n/a |
| Ajman | 21,442 | 20,410 | 41,852 | n/a | n/a | n/a | n/a | n/a | n/a | n/a |
| Umm Al-Quwain | 8588 | 8708 | 17,296 | n/a | n/a | n/a | n/a | n/a | n/a | n/a |
| Ras Al Khaima | 48,580 | 47,749 | 96,329 | n/a | n/a | n/a | n/a | n/a | n/a | n/a |
| Al Fujairah | 31,953 | 31,849 | 63,802 | n/a | n/a | n/a | n/a | n/a | n/a | n/a |
| Total | 471,702 | 461,679 | 933,381 | 5,649,183 | 1,617,432 | 7,266,615 | 6,120,885 | 2,079,111 | 8,199,996 | 11.4 |
Source: UAE National Bureau of Statistics.
n/a: Not available.
UAE Population by Emirate (nationals only) Nationality and Sex, 2009 end of year estimates.
Overall in the UAE, males outnumber females 3:1. Amongst nationals as might be expected there are approximately equal numbers of males and females, but amongst non-nationals the ratio is 3.7:1. This is because there are many more male expatriate workers in jobs such as construction and laboring compared with female workers employed in hospitality, health care and domestic service. Most male expatriates have jobs that do not attract married or accompanied status.
The Emirates of Abu Dhabi [4] and Dubai [5] have their own statistical offices which are separate from the UAE National Bureau of Statistics, and using administrative data, these offices produce their own emirate-specific estimates (Table 3). Abu Dhabi would appear to have the most complete estimates because Abu Dhabi residents are required to be covered by health insurance, and the health insurance database is now available to assist with enumeration of the population. These population estimates from Abu Dhabi and Dubai have led commentators to question the total UAE population estimate of 8.26 million mentioned above. Based on the most recent estimates, the combined population (nationals and non-nationals) of Abu Dhabi and Dubai is approximately 4.2 million, and the population of nationals in the remaining five Emirates is about 370,000 (2009 estimates, Table 2). If the total UAE population is indeed 8.26 million, then these five Emirates would have a population of non-nationals of about 3.7 million. This seems improbable since the 2005 census population of non-nationals in these Emirates was only 1 million.
| National | Non-national | Total | |||||||
|---|---|---|---|---|---|---|---|---|---|
| Emirate | M | F | T | M | F | T | M | F | T |
| Abu Dhabi | 217,824 | 215,945 | 433,769 | 1,447,480 | 439,754 | 1,887,234 | 1,665,304 | 655,699 | 2,321,003 |
| Dubai | 87,264 | 86,371 | 173,635 | 1,397,782 | 334,059 | 1,731,841 | 1,485,046 | 420,430 | 1,905,476 |
Source: Health Authority Abu Dhabi, Dubai Statistics Centre.
Population estimates by Nationality and Sex, Emirates of Abu Dhabi and Dubai (2010).
A further illustration of the UAE’s unique population structure is given in Fig. 1, which depicts the population pyramid for the Emirate of Abu Dhabi. The total population is estimated to be 2.3 million, of which over half are expatriate males aged 20–59.
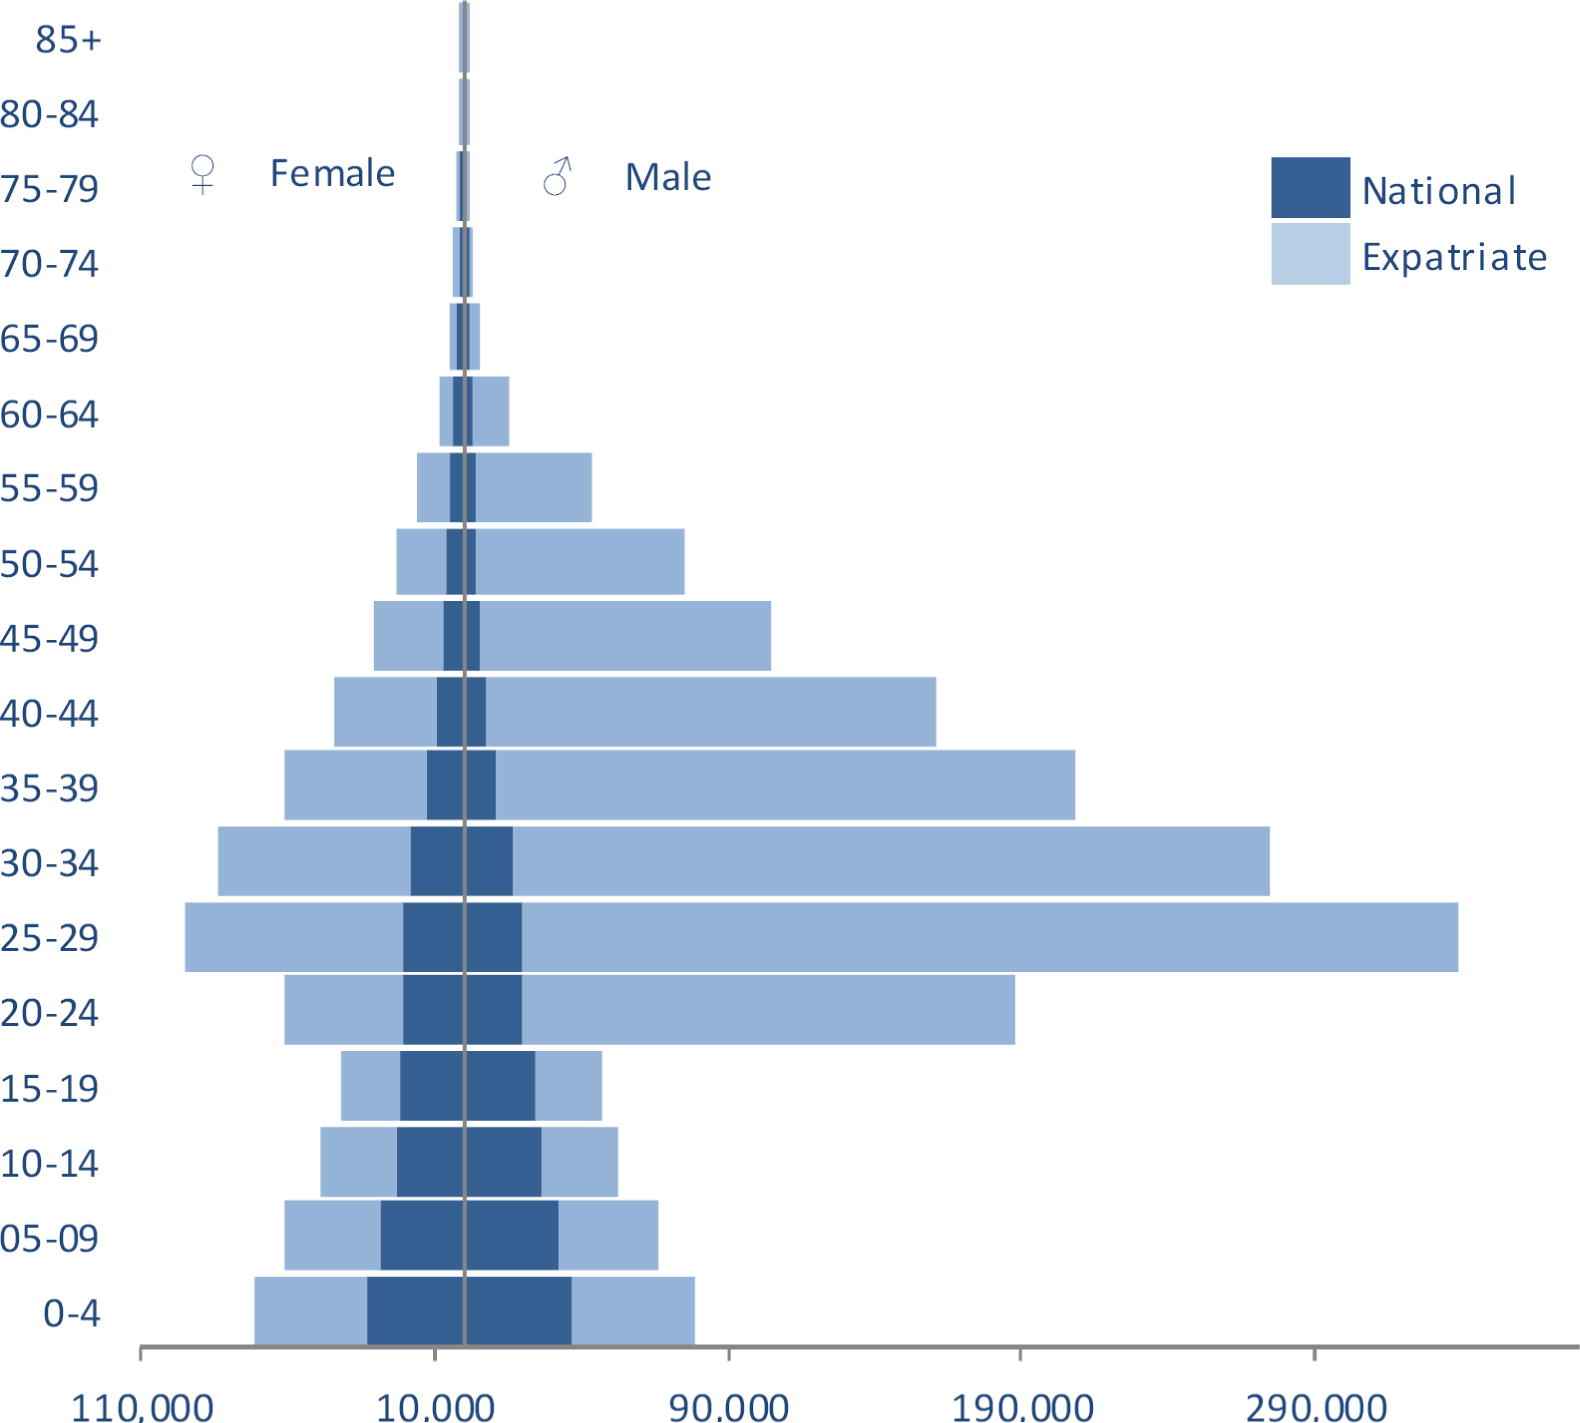
Population by age, gender and nationality, Emirate of Abu Dhabi, 2010. Source: Health Authority Abu Dhabi, Health Statistics 2010.
4. Births and deaths
The UAE has good registration of births and deaths and so there are accurate counts for these vital events (Tables 4 and 5) [6]. Initial scrutiny of these numerators indicates a high number of births and a low number of deaths reflecting the youthful age distribution of the population and the gender disparities between nationals and non-nationals discussed earlier.
| Citizens | Non-Citizens | Total | |||||||
|---|---|---|---|---|---|---|---|---|---|
| Emirate | Male | Female | Total | Male | Female | Total | Male | Female | Total |
| Abu Dhabi | 6974 | 6526 | 13,503b | 7968 | 7590 | 15,565a | 14,942 | 14,116 | 29,068 |
| Dubai | 3891 | 3576 | 7467 | 7728 | 7519 | 15,247 | 11,619 | 11,095 | 22,714 |
| Sharjah | 2080 | 1939 | 4019 | 3956 | 3733 | 7689 | 6036 | 5672 | 11,708 |
| Ajman | 361 | 376 | 737 | 2097 | 1972 | 4069 | 2458 | 2348 | 4806 |
| Umm Al-Quwain | 197 | 215 | 412 | 198 | 226 | 424 | 395 | 441 | 836 |
| Ras A-Khaima | 1328 | 1269 | 2597 | 758 | 677 | 1435 | 2086 | 1946 | 4032 |
| Fujeirah | 1127 | 1089 | 2216 | 486 | 500 | 986 | 1613 | 1589 | 3202 |
| Total | 15,958 | 14,990 | 30,951 | 23,191 | 22,217 | 45,415 | 39,149 | 37,207 | 76,366 |
Source: Ministry of Health.
Includes seven births where sex was not stated.
Includes three births where sex was not stated.
Births by Emirate and Nationality, UAE (2009).
| Citizens | Non-Citizens | Total | |||||||
|---|---|---|---|---|---|---|---|---|---|
| Emirate | Male | Female | Total | Male | Female | Total | Male | Female | Total |
| Abu Dhabi | 617 | 366 | 983 | 1616 | 388 | 2005a | 2233 | 754 | 2988 |
| Dubai | 336 | 197 | 533 | 1254 | 289 | 1543 | 1590 | 486 | 2076 |
| Sharjah | 226 | 143 | 369 | 833 | 211 | 1044 | 1059 | 354 | 1413 |
| Ajman | 48 | 29 | 77 | 292 | 75 | 367 | 340 | 104 | 444 |
| Umm Al-Quwain | 33 | 13 | 46 | 72 | 15 | 87 | 105 | 28 | 133 |
| Ras Al-Khaima | 147 | 94 | 241 | 187 | 36 | 223 | 334 | 130 | 464 |
| Fujeirah | 88 | 64 | 152 | 99 | 20 | 119 | 187 | 84 | 271 |
| Total | 1495 | 906 | 2401 | 4353 | 1034 | 5388 | 5848 | 1940 | 7789 |
Source: Ministry of Health.
Includes one death where sex was not stated.
Deaths by Emirate, Sex and Nationality, UAE (2009).
Problems are encountered when attempts are made to calculate rates to allow benchmarking and comparisons. The published rates vary widely because the denominators that are used are different and even those that are used are much lower (4–5 m) than the official UAE estimates (8 m).
4.1. Births
The data available for Abu Dhabi makes it possible to refine fertility measures. The population structure for 2010 has been published by nationality, sex and five-age bands along with total births by nationality, but not mothers’ age at birth [4]. Using this data, the overall crude birth rate (CBR) in Abu Dhabi in 2010 was 12.6 births per 1000 population (nationals 31/1000 and non-nationals 8.4/1000). Worldwide in 2008, the CBR was 19/1000. Using total births as the numerator and females aged 15–44 as the denominator, the overall rate is 76/1000 while the rates for nationals and for non-nationals are 129/1000 and 56/1000 respectively. Estimates of total fertility rate (TFR) have been published. TFR is the average number of children that would be born per woman if they continued to have children according to the prevailing age-specific birth rates. The overall TFR for UAE is 2.4, which is close to the world average. From this it can be concluded that compared with international norms, fertility amongst national women is high while that amongst expatriate women is average. Overall crude birth rates are unhelpful because the denominators are inflated by the exceptional numbers of expatriate males. Overall TFR for the UAE will conceal important differences in fertility between national and non-national women.
4.2. Deaths
The crude death rate (CDR) (average annual number of deaths per year per 1000 population) is a poor indicator of mortality in the UAE because although it accurately indicates the effect of mortality on population growth, it is greatly affected by the population age structure which in the UAE is distorted by young age and by expatriate men of working age who make up as much as half of the population. Worldwide CDR is 8/1000 whereas in the UAE the CDR is between 1 and 2/1000 depending on which denominator is used.
A question that is often asked is: What do people die of in the UAE? In other words, what are the main causes of death. Extensive data on mortality in the UAE in 2008 has been published in hard-copy book format [7]. The UAE vital registration system ensures that all deaths are counted and that a medical certificate of cause of death using the International Classification of Diseases is issued. However, accuracy in assigning underlying cause of death is variable, even in countries where this is done by medically qualified staff. This is the case in the UAE where data on cause of death must be interpreted with caution. UAE mortality data is reported to the World Health Organization (WHO), which then uses a variety of techniques to produce the best estimates of mortality. These are available in down-loadable spreadsheet files from the WHO website [8]. The WHO country-specific estimates may be different from each country’s own estimates and may be disputed by that country.
Tables depicting the top ten causes of death are popular amongst health administrators and are often debated in the press. A metric that is associated with death frequencies is “proportionate mortality”, which is the proportion of all deaths that are due to particular causes (Table 6). In the UAE in 2008, injuries, heart disease, neoplasms and cerebrovascular disease accounted for 57% of all deaths, a fact that is well known.
| Cause of death | Number | Proportionate mortality% deaths |
|---|---|---|
| All causes | 6946 | 100.0 |
| Injuries | 1449 | 20.9 |
| Ischemic heart disease | 1161 | 16.7 |
| Malignant and other neoplasms | 841 | 12.1 |
| Other heart disease | 500 | 7.2 |
| Cerebrovascular disease | 370 | 5.3 |
| Respiratory infections | 331 | 4.8 |
| Infectious and parasitic diseases | 305 | 4.4 |
| Genitourinary diseases | 266 | 3.8 |
| Diabetes mellitus | 236 | 3.4 |
| Digestive diseases | 211 | 3.0 |
| Perinatal conditions | 175 | 2.5 |
| Congenital anomalies | 155 | 2.2 |
| Respiratory diseases | 149 | 2.1 |
| Endocrine disorders | 80 | 1.2 |
| Neuropsychiatric conditions | 72 | 1.0 |
| Nutritional deficiencies | 52 | 0.8 |
| Maternal conditions | 7 | 0.1 |
| Other causes | 586 | 8.4 |
Source: World Health Organization.
Deaths from selected causes and proportionate mortality, UAE (2008).
5. Mortality rates
However, proportionate mortality tells nothing about the risk of dying from a particular disease, and this information is crucial if practitioners are to understand which diseases are more likely to affect UAE citizens as a result of lifestyle, genetics and environmental factors. Proportionate mortality will indicate what health services should be doing, but in order to advise on measures to prevent disease and death, mortality rates are required. In order to calculate mortality rates, accurate denominator data is required which, as has been noted, is not always available. In addition, rates must be adjusted to take into account the very unusual age and sex distribution of the UAE population.
The WHO has also prepared estimates of age-standardized cause-specific death rates for each member state [8]. These can be used to make comparisons of mortality risks in the UAE with other countries and help to answer questions about the health and health risk of the population. However, to make valid comparisons of mortality between countries, uncertainty ranges must be used [9]. These range from ±1% for high-income countries to ±15–20% for countries in sub-Saharan Africa and are generally larger for cause-specific mortality than all-cause mortality. The most recent data is for 2008, but it does not distinguish between nationals and non-nationals (Table 7). When considering the mortality risk in the UAE, it may be helpful to look at the overall all-causes risk and the cause-specific risk and to make comparisons with both high-income and low-income countries. For this purpose, data from the United Kingdom (UK), the United States of America (USA) and Tanzania is shown alongside UAE data. Data from Tanzania is included because it is a country that has yet to pass through the epidemiological transition in which communicable diseases are still an important cause of mortality and morbidity. However, in making these comparisons, it is essential to recall the wide uncertainty ranges discussed previously.
| United Arab Emiratesa | United Kingdom | United Republic of Tanzania | United States of America | |
|---|---|---|---|---|
| All Causes | 517.4 | 462.1 | 1647.2 | 504.9 |
| Ischemic heart disease | 94.5 | 68.8 | 117.6 | 80.5 |
| Malignant and other neoplasms | 60.6 | 140.0 | 79.2 | 126.7 |
| Other heart disease | 57.6 | 7.5 | 38.9 | 18.9 |
| Cerebrovascular disease | 42.3 | 36.9 | 137.7 | 25.4 |
| Injuries | 38.1 | 25.5 | 120.1 | 52.8 |
| Respiratory infections | 35.5 | 23.8 | 158.3 | 9.7 |
| Diabetes mellitus | 27.6 | 5.0 | 50.3 | 15.2 |
| Genitourinary diseases | 26.9 | 9.1 | 27.7 | 12.3 |
| Infectious and parasitic diseases | 25.0 | 6.7 | 511.0 | 15.4 |
| Respiratory diseases | 17.7 | 34.4 | 88.8 | 34.3 |
| Digestive diseases | 15.2 | 26.7 | 53.0 | 19.8 |
| Nutritional deficiencies | 7.2 | 0.3 | 15.1 | 1.0 |
| Endocrine disorders | 6.4 | 3.1 | 16.3 | 7.1 |
| Perinatal conditions | 5.0 | 5.2 | 59.3 | 7.1 |
| Congenital anomalies | 4.3 | 3.7 | 7.4 | 4.3 |
| Neuropsychiatric conditions | 3.5 | 31.7 | 28.6 | 39.2 |
| Maternal conditions | 0.1 | 0.1 | 38.8 | 0.4 |
| Other causes | 50.2 | 33.6 | 99.1 | 34.8 |
Source: World Health Organization.
Causes ranked by UAE rate, highest to lowest.
Age-standardized death rates per 100,000, selected causes, all persons, United Arab Emirates, United Kingdom, United States of America and United Republic of Tanzania (2008).
Compared with the three comparison countries, the mortality risk in the UAE (517 per 100,000 population) is closest to that of the USA (505), being much better than Tanzania (1647), but not as good as the UK (462). Rates of ischemic heart disease and cerebrovascular disease are higher than in the UK and the USA. Of note is the higher rate of “other heart disease,” which includes hypertensive and rheumatic heart disease. Death rates from neoplasms are lower in the UAE, while those from respiratory infections, diabetes, genitourinary diseases and infectious diseases are all higher than in the UK and the USA, but lower than in Tanzania. Injury death rates are higher than in the UK, but are surpassed by rates in the USA and Tanzania. UAE has the lowest rates of respiratory and digestive system disease.
Currently the age-standardized mortality rates that are readily available have been calculated for the whole of the UAE population and may conceal important differences in mortality risk between, for example, different nationality groups or different geographical regions. In future, it will be important to calculate nationality and emirate-specific rates, but to achieve this, better death and population data will be necessary. All of the estimates shown here are subject to sampling error and, in the future, comparisons or benchmarking should include confidence intervals.
One of the questions often asked is about the health of the many thousands of expatriate workers in the UAE. For example, how does their health compare with the health of UAE nationals and the health of their compatriots in their home countries? Using Abu Dhabi data, it is possible to calculate age-specific all-cause mortality rates for national and non-national males (Table 8). When this is done, it is clear that the mortality of expatriate men in Abu Dhabi is not excessive and is comparable with average mortality rates seen in England and Wales between 2001 and 2007.
| National | Expatriate | England &Wales 2001–2007 rate | |||||
|---|---|---|---|---|---|---|---|
| Age group | Population | Deaths | Rate | Population | Deaths | Rate | |
| 20–24 | 19,243 | 37 | 1.9 | 150,766 | 106 | 0.7 | 0.6 |
| 25–29 | 17,866 | 22 | 1.2 | 230,903 | 178 | 0.8 | 0.7 |
| 30–34 | 14,639 | 15 | 1.0 | 182,861 | 138 | 0.8 | 0.9 |
| 35–39 | 8978 | 10 | 1.1 | 151,552 | 164 | 1.1 | 1.1 |
| 40–44 | 7133 | 23 | 3.2 | 112,954 | 188 | 1.7 | 1.6 |
| 45–49 | 4839 | 26 | 5.4 | 77,738 | 133 | 1.7 | 2.5 |
| 50–54 | 4030 | 21 | 5.2 | 58,738 | 177 | 3.0 | 4.0 |
| 55–59 | 3849 | 35 | 9.1 | 29,866 | 138 | 4.6 | 6.2 |
Source: Health Authority Abu Dhabi, Health Statistics 2010.
Population, deaths and age-specific mortality rates (per 1000 population), national and expatriate males by quinary age-bands, Abu Dhabi (2009).
It is noteworthy that national males aged 20–59 experience a higher mortality than expatriate males at all age-bands except 35–39. One may speculate on the reason for this. Higher rates of injury deaths from road traffic accidents will affect younger age groups, while the healthy worker effect will account for the differences in older age groups when expatriates with potentially life-restricting illnesses are obliged to return to their country of origin. The healthy worker effect will also account for the lower mortality rates in Abu Dhabi expatriates aged 45–59 compared with men of a similar age in England and Wales.
What are the leading causes of death amongst expatriates, and in particular is there evidence of higher mortality rates from injury or occupational disease? In 2009 in Abu Dhabi, 29% (463/1606) of deaths amongst expatriate males were classified as a result of external causes. This is a category that includes deaths owing to transport accidents, suicide, accidents at work and violence. Amongst national males, the proportion was 18.5%. Interpretation of this data is difficult. In many countries deaths from external causes make a substantial contribution to overall deaths. In Europe the proportion ranges from 12.2% in Finland to 4.1% in the United Kingdom.
In most European countries the young and the elderly are at greatest risk of death from external causes. Death rates from external causes in men aged under 60 years are around 50 per 100,000. In Abu Dhabi it is difficult to calculate age-specific death rates because data on age at death is not available in a high proportion of deaths. Crude death rates are 106 for national males and 45 for expatriate males per 100,000 population. Again, caution is required because amongst expatriate males 17% of deaths are unclassified. More accurate data on the cause of death and age at death amongst expatriate males is required.
6. Disability adjusted life years
So far, the discussion has revolved around mortality; what can be said about morbidity? There are many diseases that cause significant ill-health and disability in the UAE without necessarily leading to death. The WHO Global Burden of Disease (GBD) Study [10] has quantified the health effects of diseases and injuries by introducing a new metric – the disability-adjusted life year (DALY). The DALY is based on years of life lost from premature death and years of life lived in less than full health. Total DALYs and age standardized DALY rates based on 2004 mortality and morbidity data are available for all countries and have been published on-line [11]. Although the validity of these estimates of DALYs has been questioned based on methodological issues [12], they have the potential to allow for the burden of disease in a given country to be described in a consistent and comparative way and provide a tool for health decision-making and - planning. Age-standardized DALYs for the UAE, again compared with data from the UK, USA and Tanzania, are shown in Table 9.
| United Arab Emiratesa | United Kingdom | United Republic of Tanzania | United States of America | |
|---|---|---|---|---|
| All causes | 11,858 | 11,012 | 47,182 | 12,844 |
| Neuropsychiatric conditions | 2358 | 3461 | 2483 | 3963 |
| Sense organ diseases | 1691 | 743 | 2151 | 780 |
| Injury | 1121 | 735 | 3780 | 1463 |
| Diabetes mellitus | 1024 | 168 | 505 | 374 |
| Ischemic heart disease | 827 | 674 | 992 | 715 |
| Infectious and parasitic diseases | 555 | 187 | 20,028 | 330 |
| Neoplasms | 490 | 1427 | 1502 | 1409 |
| Musculoskeletal diseases | 412 | 408 | 488 | 447 |
| Other heart disease | 370 | 82 | 472 | 188 |
| Respiratory diseases | 325 | 921 | 1275 | 844 |
| Genitourinary diseases | 295 | 80 | 420 | 122 |
| Cerebrovascular disease | 292 | 348 | 1282 | 327 |
| Nutritional deficiencies | 288 | 48 | 1215 | 45 |
| Perinatal conditions | 274 | 265 | 2481 | 321 |
| Respiratory infections | 237 | 137 | 3030 | 95 |
| Oral conditions | 225 | 83 | 99 | 83 |
| Congenital anomalies | 217 | 224 | 385 | 259 |
| Digestive diseases | 161 | 538 | 1026 | 409 |
| Maternal conditions | 136 | 64 | 2053 | 104 |
| Endocrine disorders | 125 | 172 | 556 | 247 |
| Skin diseases | 45 | 16 | 165 | 19 |
| Other causes | 389 | 230 | 793 | 299 |
Source: World Health Organization.
Causes ranked by UAE rate, highest to lowest.
Age-standardized DALYs (per 100,000 population) selected causes, all persons, UAE, UK, USA and Tanzania (2004).
The all causes burden of disease in the UAE (11,858 DALYs lost per 100,000 population per year) is similar to that in the UK (11,012) and the USA (12,844), but is much less than in Tanzania (47,182). One of the most striking features of this analysis is that the diseases that cause most mortality are not those that contribute most to the burden of disease. In the three high-income countries, neuropsychiatric conditions have the highest DALY rates. In the UAE, neuropsychiatric conditions account for 20% of the burden of disease with sense organ diseases (hearing loss, visual impairment), injury, diabetes, ischemic heart disease and neoplasms adding a further 48%. In the UK, neoplasms and respiratory disease are more significant, while in the the USA injury makes a larger contribution. In Tanzania, as might be expected in a country that has not yet passed through the epidemiological transition, infectious and parasitic diseases, injury, nutritional deficiencies, perinatal conditions, respiratory infections and maternal conditions are the main contributors to the burden of disease.
7. Conclusions and recommendations
Since the last formal census in 2005, the population of the UAE has grown substantially owing to high natural growth and high net inward migration. Population estimates that were published in the years after the 2005 census and which were used to calculate birth and death rates are now thought to have underestimated the true size of the population, which is currently estimated to be about 8.2 million. The main causes of death in the UAE are well-known, but there is less appreciation of the risk of death, disease, injury and disability. The population of the UAE is very diverse, and mortality and morbidity risk will vary by age-group, sex, nationality and possibly even place of residence. From the currently available data presented in this paper, it would seem that mortality and morbidity amongst Emirati-national males requires further investigation. If rates are confirmed to be higher than expected in particular population sub-groups, then it is within these sub-groups that our public-health action should be concentrated.
Within the UAE, there are official statistics offices at both the National and Emirate level, and whilst good progress has been made, there is room to improve the timeliness, completeness and consistency of the data that is available on-line. This would be of great benefit to practitioners, planners and researchers in health and related fields. Better data will encourage more analysis, and this analysis will generate health intelligence that will drive health improvement. The improvements that would be most beneficial are the availability of birth counts by sex of infant, age and nationality of mother and place of residence. Death data should include age at death, cause, nationality and place of residence. Similarly, annual population estimates should be made available by five-year age-band, sex, nationality and, ideally, Emirate of residence. Efforts should be made to reduce data that is missing or unclassified. Finally, the data should be freely available in downloadable form from the main national statistics website with an invitation to all interested parties to use and analyze the data to inform planning and decision making.
Declaration of interest
The authors report no declarations of interest. Neither author has received any specific support from any organization for the submitted work. Both authors have completed the Unified Competing Interest form at www.icmje.org/coi_disclosure.pdf (available on request from the corresponding author).
Authors’ contributions
Both authors contributed to ideas contained in this essay. IB produced the first draft. Both authors refined the paper and edited the final version.
Permission for reproduction
If this article is accepted for publication, written permission from the copyright holders for published/reproduced material will be forwarded to the Editorial Office.
Ethical approval of studies and informed consent
Not necessary as only secondary, aggregated data that is in the public domain is presented.
Footnotes
Scope of the Article. This is a review article which summarizes data from the United Arab Emirates on population structure, births, deaths, proportionate mortality, age-standardized mortality rates and disability adjusted life-years.
References
Cite this article
TY  - JOUR
AU  - Iain Blair
AU  - Amer Ahmad Sharif
PY  - 2012
DA  - 2012/05/22
TI  - Population structure and the burden of disease in the United Arab Emirates☆
JO  - Journal of Epidemiology and Global Health
SP  - 61
EP  - 71
VL  - 2
IS  - 2
SN  - 2210-6014
UR  - https://doi.org/10.1016/j.jegh.2012.04.002
DO  - 10.1016/j.jegh.2012.04.002
ID  - Blair2012
ER  -