
Socioeconomic status and obesity in Cairo, Egypt: A heavy burden for all
- DOI
- 10.1016/j.jegh.2013.09.001How to use a DOI?
- Keywords
- Social epidemiology; Health inequities; Socioeconomic status; Obesity; Egypt
- Abstract
Studies have generally shown a positive association between socioeconomic status (SES) and obesity in low-income countries, but few have tested this relationship in the Middle East where obesity prevalence is extraordinarily high and the nutrition profile more closely resembles developed world contexts. The objective of this study is to examine the SES-obesity association in Cairo, Egypt.
Multinomial regression analyses were conducted and predicted probabilities were found for overweight and obesity status among adult men and women in a stratified analysis. Data were taken from the 2007 Cairo Urban Inequity Study which collected information on 3993 individuals from 50 neighborhoods in the Cairo Governorate. Five different measures of SES were utilized – education, household expenditures, household assets, subjective wealth, and father’s education. No significant associations were found between most measures of SES and overweight/obesity in this population. Overweight and obesity are prevalent across the SES spectrum.
These findings suggest that obesity programs and policies should be targeted at all SES groups in Cairo, although specific mechanisms may vary by SES and should be explored further in future studies.
- Copyright
- © 2013 Ministry of Health, Saudi Arabia. Published by Elsevier Ltd.
- Open Access
- This is an open access article under the CC BY-NC-ND license (http://creativecommons.org/licenses/by-nc-nd/4.0/).
1. Introduction
The global obesity epidemic reflects rapidly changing environments as societies develop, cultures integrate, food habits globalize, and urbanization and its corollary urban lifestyle replaces more active rural living [1–3]. These shifts are often captured by the term nutrition transition, which refers to the interplay of economic, demographic, environmental and cultural changes in a society that are associated with shifting patterns of nutritional intake [4–7]. Macro-level country studies have shown that the nutrition transition is often closely related to a country’s level of economic development, and the progression of a country in terms of it economic and nutrition transitions is related to the association between socioeconomic status (SES) and obesity among individuals [8–10]. Generally, countries with lower levels of economic development are earlier in the nutrition transition and exhibit a positive SES-obesity association among individuals. Those countries that are more developed tend to be further along in the nutrition transition and usually exhibit an inverse SES-obesity association among individuals [11]. The ‘crossover effect’ from a positive to a negative SES-obesity association tends to happen earlier for women as compared with men according to the evidence [8].
While these trends hold true for countries in which obesity prevalence is closely aligned with levels of economic development, it is not clear that they do so for countries in which obesity prevalence far exceeds that which may be expected given their level of economic development. The Middle East provides an interesting context in which to study the hypothesis that the nutrition transition may operate independent of economic development in some circumstances, since obesity rates are generally high despite the marked variation in economic development throughout the region [12–16].
Egypt, in particular, may epitomize this paradox since obesity prevalence is very high compared with the country’s level of economic development. Urban Egyptian women are disproportionately affected and have a higher prevalence of overweight/obesity compared with most other developing nations [9,17]. In a study exploring SES-obesity associations in developing countries, Monteiro et al. observed a positive association in Egypt using the 1995–1996 Demographic and Health Survey (DHS) data, in line with its relatively low level of economic development at the time [8]. A closer look, however, reveals that Egypt was an outlier in comparison with other countries in this study. Particularly concerning, Egypt’s observed overweight/obesity prevalence (69.9%) far exceeded that which was expected (∼35.0%) given the country’s level of economic development (GNI: $990 per capita) and urbanization (43.1%). Further, the ratio of overweight to underweight in urban Egypt was 99.9 (overweight: 69.9%; underweight: 0.7%), far exceeding that which was seen in Western industrialized nations before the current obesity epidemic (overweight: 27–47%; underweight: 3–4%) [9].
Given this unique nutrition profile, this study sought to explore the Egyptian SES-obesity association in more detail. While obesity prevalence is increasing in Egypt [16,18], few studies have analyzed the distribution of this outcome across SES groups. This study aims to clarify SES-obesity associations among adult men and women in Cairo, the largest city in Egypt. This study hypothesized that an inverse association would be observed, similar to that seen in developed nations. It was further expected that this association would be more pronounced in women compared with men given that the crossover from a positive to inverse association tends to happen earlier among women in the developing world [8].
2. Methods and procedures
2.1. Data source
The Cairo Urban Inequity Study (UIS) surveyed 5710 households in 50 neighborhoods of the Cairo Governorate (∼8 million people). The study implemented a multi-stage complex survey design in which 50 of 634 neighborhoods were selected using a stratified random sample of low, medium, and high deprivation neighborhoods [19]. To select households, a block was randomly chosen from each of the 50 neighborhoods, and a full listing was created from which households were randomly selected proportional to neighborhood size. Half were randomly assigned to men and the other half to women for individual questionnaire administration (⩾22 yrs inclusion criteria). When a household had more than one adult of the assigned gender, one individual was randomly selected to participate in the questionnaire. The overall survey response rate was 69.9%, yielding a total of 3993 households from which 1990 men and 2003 women participated in individual questionnaires in addition to the household survey. Survey weights were used to account for non-response such that study results may be generalized to the Cairo Governorate.
For the current analysis, underweight cases (<18.5 kg/m2; n = 43), pregnant women (n = 98), and those missing information on BMI (n = 297) were excluded. Eight additional cases were excluded because participants were under age (<22 yrs) and one extreme outlier was also excluded (BMI = 345.1 kg/m2). The final analysis included 1823 men and 1723 women. Fig. 1 depicts neighborhood boundaries for the original sampling frame with the 50 selected neighborhoods highlighted.
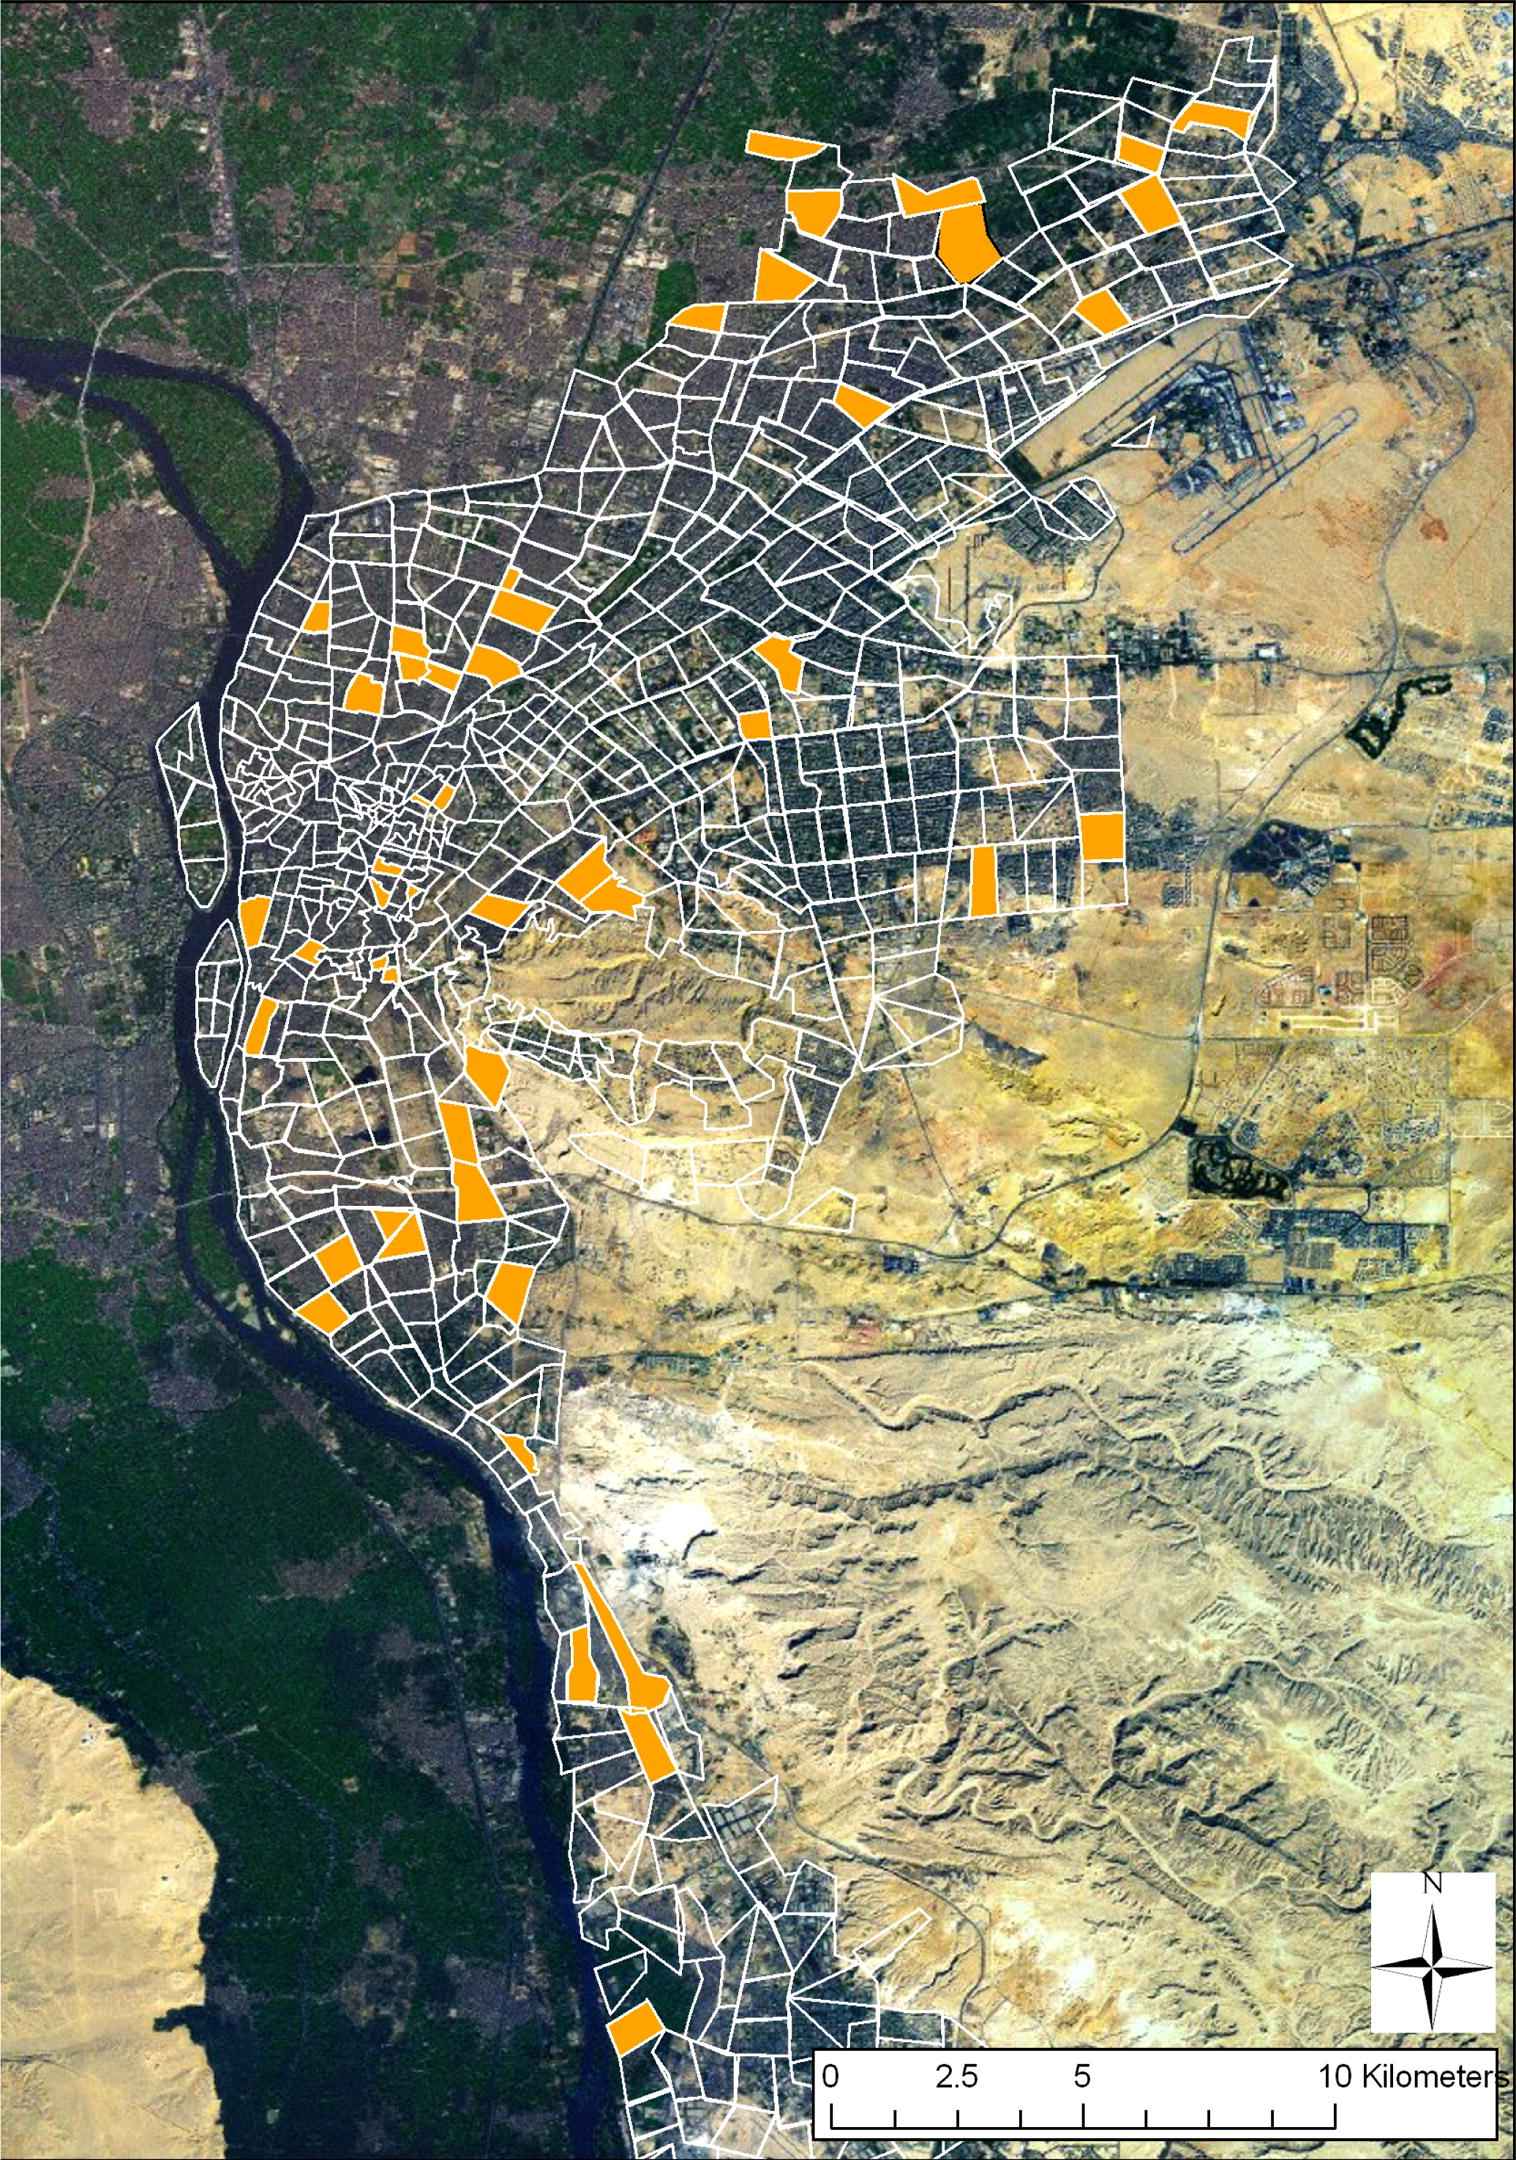
Neighborhood boundaries in Cairo Governorate, Cairo Urban Inequity Study (UIS), 2007.
2.2. Measures
2.2.1. Dependent variable
Standard protocols similar to those used by the Demographic and Health Surveys were used to obtain height and weight measurements at participants’ households by trained UIS field workers [18]. A Beurer scale (Ulm, Germany) was used to measure weights with individuals wearing clothing but no shoes. Standing heights were obtained using a Shorr measuring board (Shorr Productions, Olney, MD, USA). Body mass index (BMI) thresholds were calculated from measured height and weight data (normal weight 18.5–24.9 kg/m2, overweight 25.0–29.9 kg/m2, obese ⩾30.0 kg/m2).
2.2.2. Independent variables
Five indicators of SES were included in this analysis: education, household expenditures, household assets, subjective wealth, and father’s education.
- (a)
Education was categorized by stage of formal education completed: greater than high school, high school, less than high school, no formal education or illiterate.
- (b)
Household expenditures were collected as a self-report of monthly household expenditures by the respondent. Household size was adjusted, and divided by 30 days to arrive at a figure representing Egyptian LE/person/day. This figure was then converted to US$ according to the official exchange rate at the time of the study (2007). The measure is presented in terms of $/day categories utilizing cut-off points similar to the World Bank’s international poverty lines (extreme poor: ⩽$1/day; poor: $1–1.99/day; near poor: $2–2.99/day; not poor: ⩾$3/day).
- (c)
The asset index was calculated using principal component analysis described elsewhere by Filmer and Pritchett (2001). This method allowed consolidation of information into a single variable for the analysis. It was based on a yes/no response to the presence or absence of more than 60 household assets (e.g., cooking facilities, toilet, utilities). Internal consistency (Chronbach’s alpha) of this index was calculated at r = 0.842. Weights were obtained for each item by dividing the score by the standard deviation of each item. Weighted scores were then summed across households and categorized into quartiles for the analysis.
- (d)
The subjective wealth index was based on self-report of whether the household was able to cover expenses for food, schooling, school supplies, private education lessons (a common aspect of Egyptian education), schoolbooks, doctor visits, medications, medical tests, housing rent or mortgage, water, lighting, electricity, gas, telephone, housing maintenance, transportation, and clothing. A score of 0 was given to households who could not afford the expense at all, 1 to those who could afford it at times, 2 to those who could usually afford the expense, and 3 to households that were always able to cover the expense. Internal consistency reliability of the resulting scale was r = 0.884 (Chronbach’s alpha). The range of scores was summed and divided into quartiles for the analysis.
- (e)
Father’s education was included as a measure of childhood SES. Since traditionally (and especially within the older generation) men are the principal breadwinners, it was this study’s belief that the father’s education would be a good marker of the respondent’s childhood SES. Father’s education may also have additional implications with regard to household culture, particularly for women (e.g., educated fathers may have more liberal stances on women’s rights to education, work, mobility). Father’s education was categorized as: greater than high school, high school, less than high school, and no formal education or illiterate.
2.2.3. Covariates
Childhood health status (self-report: excellent/very good, good, fair/poor), current health status (self-report: excellent/very good, good, fair/poor) and age (22–29, 30–39, 40–49, 50–59, 60+ yrs) were included as covariates in the analysis.
2.3. Data analysis
Descriptive statistics were conducted using Stata 8.2 (Statacorp, College Station, TX, USA) with weights to account for non-response and complex survey design. Multinomial logistic regression was conducted in which overweight and obese categories were compared with normal weight for men and women, separately. Bivariate analyses were conducted and statistical significance was determined using the Wald test with statistical significance set at p ⩽ 0.05. The final model included all SES indicators, mutually adjusted for one another. A check of variance inflation factors confirmed negligible collinearity between independent SES variables in the model (VIF ranges: 1–2). Predicted probabilities were calculated and presented in lieu of odds ratios for the final model since the outcome prevalence was high for both men and women in this sample. Confidence intervals were calculated using the delta method. Each category was predicted holding all other variables to the mean. Therefore, the predictions reflect the probability of having a certain weight status, assuming average characteristics across all other variables. Tests for linear trend were conducted by repeating the regressions using the continuous form of each variable and checking for a linear association at a significance level of p ⩽ 0.05. Finally, tests of proportion allowed for testing differences between specific categories of SES (e.g., 1st vs. 4th quartiles).
3. Results
Table 1 presents descriptive statistics for this study population. Among men, 36.4% were normal weight, 42.2% were overweight and 21.4% were obese. Among women, only 18.2% were normal weight, 33.3% were overweight, and 48.5% were obese. There was a significant trend of BMI by age for all adults, with overweight and obesity peaking in the upper-middle age groups of 40–49 and 50–59 yrs, and then tapering among those 60+ yrs. Over half of normal weight subjects were found in the younger age groups less than 40 yrs. The mean age was 43.8 yrs. A high percentage of both men (62.1%) and women (40.8%) had at least a high school education. By contrast, the majority of households in the survey were either poor (28.6% of men; 25.0% of women) or extremely poor (41.3% of men; 43.2% of women) based on household expenditures. Most respondents came from households in which the father’s education was below high school level (64.9% of men; 68.9% of women). Slightly more men reported being in excellent or very good current health status compared with women.
| Men (N = 1823) | Women (N = 1723) | |||
|---|---|---|---|---|
| Na | %b | Na | %b | |
| Dependent variable | ||||
| Normal weight (18.0–24.9 kg/m2) | 623 | 36.4 | 320 | 18.2 |
| Overweight (25.0–29.9 kg/m2) | 765 | 42.2 | 548 | 33.3 |
| Obese (⩾30 kg/m2) | 435 | 21.4 | 855 | 48.5 |
| Independent variables | ||||
| Age | ||||
| 22–29 yrs | 428 | 28.9 | 381 | 22.6 |
| 30–39 yrs | 428 | 17.1 | 431 | 18.2 |
| 40–49 yrs | 424 | 18.9 | 372 | 22.4 |
| 50–59 yrs | 274 | 16.6 | 281 | 19.0 |
| 60+ yrs | 269 | 18.6 | 258 | 17.9 |
| Education | ||||
| Greater than secondary | 562 | 37.5 | 366 | 31.4 |
| Secondary | 506 | 24.6 | 462 | 25.1 |
| Less than secondary | 585 | 31.4 | 527 | 27.9 |
| None | 169 | 6.6 | 366 | 15.4 |
| Missing | 1 | <0.1 | 2 | <0.1 |
| Household expenditures | ||||
| Not poor (⩾$3/day) | 164 | 13.4 | 141 | 13.6 |
| Near poverty ($2–2.99/day) | 198 | 11.0 | 166 | 12.9 |
| Poverty ($1–1.99/day) | 539 | 28.6 | 456 | 25.0 |
| Extreme poverty (⩽$1/day) | 845 | 41.3 | 878 | 43.2 |
| Missing | 77 | 0.1 | 82 | 0.1 |
| Asset index | ||||
| Highest quartile | 254 | 24.7 | 227 | 25.4 |
| 2nd Quartile | 530 | 24.7 | 472 | 25.4 |
| 3rd Quartile | 472 | 26.2 | 482 | 23.3 |
| Lowest quartile | 567 | 24.4 | 542 | 25.9 |
| Subjective Wealth Index | ||||
| Highest quartile | 329 | 22.6 | 313 | 21.6 |
| 2nd Quartile | 405 | 24.3 | 361 | 25.1 |
| 3rd Quartile | 549 | 28.6 | 447 | 22.3 |
| Lowest quartile | 540 | 24.5 | 602 | 31.0 |
| Father’s education | ||||
| Greater than secondary | 222 | 19.5 | 183 | 18.6 |
| Secondary | 177 | 12.8 | 123 | 7.9 |
| Less than secondary | 639 | 32.3 | 606 | 37.0 |
| None | 720 | 32.6 | 701 | 31.9 |
| Missing | 65 | <0.1 | 110 | 4.7 |
| General health (<15 yrs age) | ||||
| Excellent/very good | 678 | 37.2 | 672 | 36.2 |
| Good | 547 | 27.9 | 516 | 33.4 |
| Fair/poor | 598 | 34.8 | 534 | 30.4 |
| Missing | – | – | 1 | <0.1 |
| General health (current) | ||||
| Excellent/very good | 705 | 38.5 | 508 | 31.4 |
| Good | 708 | 35.5 | 593 | 36.5 |
| Fair/poor | 407 | 25.6 | 618 | 31.9 |
| Missing | 3 | <0.1 | 4 | <0.1 |
N represents the actual number of observations.
Percentages reflect sampling weights from complex survey design.
Survey proportions (%) study population characteristics, Cairo Urban Inequity Study (UIS), 2007.
Table 2 presents the predicted probabilities of normal weight, overweight and obesity stratified by sex. Tests of trend across SES predictors did not reveal linear associations.
| Men | Women | |||||
|---|---|---|---|---|---|---|
| Normal (n = 623) | Overweight (n = 765) | Obese (n = 435) | Normal (n = 320) | Overweight (n = 548) | Obese (n = 855) | |
| Education | ||||||
| Greater than secondary | 0.34 (0.23, 0.46) | 0.47 (0.35, 0.59) | 0.19 (0.14, 0.24) | 0.24 (0.08, 0.40) | 0.26 (0.15, 0.38) | 0.50 (0.36, 0.63) |
| Secondary | 0.30 (0.22, 0.37) | 0.48 (0.39, 0.56) | 0.23 (0.18, 0.28) | 0.09 (0.00, 0.18) | 0.36 (0.23, 0.48) | 0.56 (0.40, 0.71) |
| Less than secondary | 0.38 (0.22, 0.55) | 0.41 (0.22, 0.61) | 0.20 (0.12, 0.28) | 0.10 (−0.03, 0.24) | 0.35 (0.23, 0.47) | 0.55 (0.39, 0.72) |
| None | 0.36 (0.14, 0.59) | 0.38 (0.14, 0.62) | 0.26 (0.13, 0.38) | 0.08 (0.00, 0.23) | 0.48 (0.23, 0.72) | 0.44 (0.24, 0.64) |
| Household expenditures | ||||||
| Not poor, ⩾$3/day | 0.31 (0.01, 0.60) | 0.49 (0.25, 0.73) | 0.20 (0.04, 0.37) | 0.18 (0.02, 0.33) | 0.27 (0.01, 0.54) | 0.55 (0.28, 0.83) |
| Near poor $2–2.99/day | 0.36 (0.17, 0.54) | 0.45 (0.30, 0.60) | 0.19 (0.09, 0.30) | 0.21 (0.04, 0.37) | 0.27 (0.08, 0.46) | 0.52 (0.20, 0.84) |
| Poor, $1–1.99/day | 0.35 (0.28, 0.42) | 0.45 (0.35, 0.55) | 0.20 (0.11, 0.29) | 0.16 (0.08, 0.25) | 0.23 (0.15, 0.32) | 0.61 (0.46, 0.75) |
| Extreme poor, ⩽$1/day | 0.35 (0.28, 0.41) | 0.45 (0.40, 0.50) | 0.21 (0.14, 0.27) | 0.14 (0.10, 0.17) | 0.38 (0.32, 0.44) | 0.48 (0.44, 0.53) |
| Asset index | ||||||
| 1st Quartile | 0.39 (0.22, 0.55) | 0.46 (0.29, 0.64) | 0.15 (0.08, 0.23) | 0.14 (0.08, 0.20) | 0.47 (0.34, 0.59) | 0.39 (0.26, 0.52) |
| 2nd Quartile | 0.26 (0.12, 0.40) | 0.44 (0.28, 0.60) | 0.30 (0.22, 0.38) | 0.14 (0.04, 0.23) | 0.25 (0.12, 0.38) | 0.61 (0.41, 0.82) |
| 3rd Quartile | 0.35 (0.21, 0.49) | 0.37 (0.24, 0.50) | 0.28 (0.19, 0.37) | 0.15 (0.06, 0.24) | 0.21 (0.11, 0.31) | 0.64 (0.47, 0.81) |
| 4th Quartile (lowest) | 0.32 (0.16, 0.49) | 0.48 (0.26, 0.70) | 0.20 (0.10, 0.30) | 0.15 (0.05, 0.25) | 0.23 (0.14, 0.32) | 0.61 (0.46, 0.77) |
| Subj. wealth index | ||||||
| 1st Quartile | 0.32 (0.21, 0.42) | 0.46 (0.28, 0.63) | 0.23 (0.12, 0.34) | 0.13 (0.04, 0.23) | 0.27 (0.19, 0.35) | 0.60 (0.50, 0.69) |
| 2nd Quartile | 0.33 (0.21, 0.45) | 0.51 (0.29, 0.73) | 0.16 (0.02, 0.30) | 0.14 (0.01, 0.27) | 0.40 (0.29, 0.51) | 0.46 (0.31, 0.61) |
| 3rd Quartile | 0.35 (0.24, 0.46) | 0.44 (0.24, 0.64) | 0.21 (0.08, 0.33) | 0.16 (0.05, 0.26) | 0.37 (0.23, 0.52) | 0.47 (0.34, 0.60) |
| 4th Quartile (lowest) | 0.42 (0.27, 0.57) | 0.41 (0.23, 0.58) | 0.18 (0.08, 0.28) | 0.18 (0.09, 0.28) | 0.37 (0.22, 0.52) | 0.45 (0.33, 0.57) |
| Father’s education | ||||||
| Greater than secondary | 0.24 (0.12, 0.37) | 0.44 (0.33, 0.54) | 0.32 (0.21, 0.43) | 0.17 (0.01, 0.32) | 0.50 (0.29, 0.72) | 0.33 (0.20, 0.46) |
| Secondary | 0.51 (0.31, 0.71) | 0.39 (0.23, 0.55) | 0.10 (0.03, 0.17) | 0.10 (0.02, 0.19) | 0.23 (0.07, 0.39) | 0.67 (0.45, 0.89) |
| Less than secondary | 0.41 (0.30, 0.52) | 0.42 (0.32, 0.52) | 0.17 (0.09, 0.24) | 0.11 (0.07, 0.16) | 0.21 (0.13, 0.30) | 0.67 (0.57, 0.77) |
| None | 0.42 (0.31, 0.53) | 0.46 (0.36, 0.55) | 0.12 (0.06, 0.19) | 0.14 (0.08, 0.20) | 0.21 (0.10, 0.31) | 0.66 (0.55, 0.76) |
Final model was mutually adjusted for all SES variables simultaneously; predicted probabilities for each variable calculated holding all others to the mean; significant differences between highest and lowest SES categories are bolded.
Mean predicted probabilities (95% CIs) for normal weight, overweight and obesity outcomes based on final model Cairo Urban Inequity Study, 2007.a
For both men and women, differences within weight groups were generally not statistically significant across education levels. Of note, however, women with greater than a high school education were three times more likely to be normal weight compared with women with a high school education or less (PP: 0.24, 95% CI: 0.08, 0.40 vs. PP: 0.09, 95% CI: 0.00, 0.18), although this difference was not statistically significant.
Household assets were not statistically significantly associated with weight status for men. Women of the lowest quartile, however, had a 24.0% higher probability of being overweight compared with their counterparts in the highest assets quartile, a difference that was statistically significant.
The association between father’s education and weight operated in opposite directions by gender. Men with fathers who had greater than a high school education had almost three times the probability of being obese compared with men whose fathers had a high school education or lower. For women, those whose fathers had greater than a high school education exhibited approximately half the probability of being obese compared with those who came from childhood households in which the father had a high school education or lower.
No association of subjective wealth or household expenditures with weight was found for either men or women, nor were any clear trends seen across any of these groups.
4. Discussion
In this study, no evidence of statistically significant differences in overweight and obesity across SES groups in the adult Cairene population was found. The largely null SES-obesity associations in Cairo differ from trends in the developing world which show positive SES-obesity associations in context with comparable levels of economic development [8,11,20–23].
Among males, these findings were largely consistent with prior studies showing no significant SES-obesity associations [16]. The lack of SES-obesity association among women, however, differed from some previous findings.
A nationally representative Demographic and Health Survey in 2005 showed that Egyptian women of the highest wealth quintile were more than twice as likely to be obese compared with women of the lowest quintile (57.8% vs. 31.8%), although education level had no significant independent effect on obesity among this group (no formal education: 44.5% obesity; secondary education or higher: 47.6% obesity) [18]. Variations in sampling strategies may have contributed to differences between these findings and those of the DHS. The DHS sample included ever-married women of reproductive age (15–49 yrs) whereas this sample included all adult women (⩾22 yrs) regardless of marital status. Also, the DHS findings were based on national data which may have masked trends specific to Cairo. This is important because Cairo is the most densely populated city in Egypt, and it has a unique cultural and social environment, along with a vibrant urban culture.
Understanding the Cairene food environment may also help explain the lack of observed obesity disparities by household expenditure and subjective wealth. Cairo has the lowest level of food insecurity of all governorates in the country (4% in Cairo compared with 22% in the highest risk governorate of Dakhalia) [16,24], and this fact of widespread food availability in Cairo may influence obesity through different pathways in low versus high SES groups.
In particular, the Egyptian government’s food subsidy program may be contributing to this unusually “even” distribution of obesity across SES categories in Cairo. For over 25 yrs, the Egyptian government has heavily subsidized bread, wheat flour, sugar and cooking oil. Over 80% of citizens have access to food subsidy cards, and this ensures access to a core of calories for a majority of the population.
Given previous evidence showing a relation between micronutrient deficiency and obesity in this context [25], it is also possible that the Egyptian food subsidy program itself might be contributing to the high rates of overweight and obesity. This may be especially true for low SES individuals since they are more likely to access affordable calories despite their low nutritional value, and may be more limited in their ability to diversify calories with higher-nutrient foods, such as fruits, vegetables and meats (foods that are not subsidized by the government and therefore may be beyond their purchasing power). By contrast, individuals from higher SES groups may be able to access more both increased quantity and quality of foods, potentially leading to high levels of overweight and obesity as well, although through different mechanisms. In Cairo, restaurants and food delivery services largely cater to the wealthy and are open late into the night. The net result of the food subsidy program and the food-centered culture may be that calories (and many of them) are largely available and accessible throughout Cairo, even if social inequities exist in the quality of calories attained across SES groups.
Egypt has also far out-paced other lower-middle-income countries in its nutrition transition, particularly in urban areas such as Cairo. Monteiro et al. have noted that the shift from positive to inverse SES-obesity associations seems to be accelerated for women in developing countries, whereby the ‘crossover’ takes place at a lower GNP, usually around $2500 per capita [22]. These findings show that this crossover may be taking place at a much earlier stage for Cairene women.
A few important limitations are noted in this study. First, the delta method utilized by Stata to calculate 95% confidence intervals for predicted probabilities following a multinomial regression may result in wider confidence limits than would be expected using traditional maximum likelihood-based methods. Presence of survey questions regarding availability of food sources to the households included in the study (e.g. fast food, fresh fruits and vegetables) would have helped us parse potential mechanisms, although they would have to be tested further in longitudinal studies. And all the usual disclaimers regarding the inability to make causal inferences in cross-sectional studies apply to this analysis; these conclusions reflect only the associations between measures of SES and BMI generalized to the adult population in Cairo.
This study also has some notable strengths; it is the first published in the literature to take an in-depth look at SES-obesity associations in Cairo, the largest Egyptian city. The analysis also heeds the call of experts to simultaneously include multiple dimensions of SES in such studies; by utilizing data specifically designed to tackle questions of health inequities, this study was able to provide insight into the social epidemiology of obesity in this context [26].
The results of this study provide preliminary evidence that Cairo is dealing with a generally heavy obesity burden for all SES groups, and this is different than findings from other similar settings in the developing world. It is recommended that further studies focus on examining mechanisms, and that interventions be appropriately formulated to tackle the extraordinarily high prevalence of overweight and obesity experienced by Egyptians across the population, and that a social inequity lens be utilized to parse the potentially varying causal pathways attributable to this outcome. Addressing this public health challenge will be critical for improving population health among Cairenes and reducing the long-term costs associated with chronic diseases in this population [27–29]. There is a growing opportunity now to put these issues center stage after the recent global commitment that was made at the September 2011 United Nations High Level Meeting on Non-communicable Diseases (NCDs). This study contributes to the evidence upon which policies and programs can be built to address the challenge of obesity and downstream NCDs in the Egyptian population.
Conflict of interest
None declared.
References
Cite this article
TY  - JOUR
AU  - Mona Mowafi
AU  - Zeinab Khadr
AU  - Ichiro Kawachi
AU  - S.V. Subramanian
AU  - Allan Hill
AU  - Gary G. Bennett
PY  - 2013
DA  - 2013/10/16
TI  - Socioeconomic status and obesity in Cairo, Egypt: A heavy burden for all
JO  - Journal of Epidemiology and Global Health
SP  - 13
EP  - 21
VL  - 4
IS  - 1
SN  - 2210-6014
UR  - https://doi.org/10.1016/j.jegh.2013.09.001
DO  - 10.1016/j.jegh.2013.09.001
ID  - Mowafi2013
ER  -