
Hypertension in the Lebanese adults: Impact on health related quality of life
- DOI
- 10.1016/j.jegh.2015.02.003How to use a DOI?
- Keywords
- Hypertension; Quality of life; SF-8; Risk factors; Lebanese population
- Abstract
Cardiovascular disease is a major cause of morbidity and mortality worldwide, hypertension being one of their most prevalent risk factors. Information on health related quality of life (QOL) of hypertensive individuals in Lebanon is lacking. Our objectives were to evaluate QOL of hypertensive patients compared with non-hypertensive subjects and to suggest possible predictors of QOL in Lebanon. We conducted a case control study among individuals visiting outpatient clinics. Quality of life was assessed using the eight item (SF-8) questionnaire administered face to face to the study population, applied to hypertensive (N = 224) and non-hypertensive control (N = 448) groups. Hypertensive patients presented lower QOL scores in all domains, particularly in case of high administration frequency and occurrence of drug related side effects. Among hypertensive patients, QOL was significantly decreased with the presence of comorbidities (β = −13.865, p = 0.054), daily frequency of antihypertensive medications (β = −8.196, p < 0.001), presence of drug side-effects (β = −19.262, p = 0.031), older age (β = −0.548, p < 0.001), female gender (β = −21.363, p = 0.05), lower education (β = −22.949, p = 0.006), and cigarettes smoked daily (β = −0.726, p < 0.001); regular sport activity (β = 23.15, p < 0.001) significantly increased quality of life. These findings indicate the necessity for health professionals to take these factors into account when treating hypertensive patients, and to tackle special subgroups with attention to their deteriorated QOL.
- Copyright
- © 2015 Ministry of Health, Saudi Arabia. Published by Elsevier Ltd.
- Open Access
- This is an open access article under the CC BY-NC-ND license (http://creativecommons.org/licenses/by-nc-nd/4.0/).
1. Introduction
Cardiovascular disease (CVD) is a major cause of morbidity and mortality worldwide [1,2]. Globally, they account for approximately 17 million deaths a year [3]. Hypertension is considered a major cardiovascular risk factor with high prevalence in almost all countries, with a slow and silent progression [4]. Complications of hypertension are highly prevalent and account for 9.4 million deaths worldwide every year [5]. On another hand, the dramatic increase of longevity has brought attention that it should be accompanied with improvements in health-related quality of life (QOL). The World Health Organization (WHO) has summarized these concerns, stating that “adding years to life is an empty victory without adding life to years” [6]. Regardless of the condition type, patients’ QOL is adversely affected by chronic illness [7]; this is an important consideration in the management of asymptomatic conditions such as hypertension [8].
With this regard, studies assessing the impact of hypertension on QOL had been carried out in various countries. For example, Roca-Cusachs et al. assessed the impact of QOL clinical variables and reported that hypertensive patients experienced a significant reduction in QOL when compared with normotensive individuals [9]. Li et al. studied the Chinese population and observed that QOL was higher in normotensive individuals [10]. Bardage and Isacson found that QOL scores were poorer in hypertensive patients than in general population [11].
As far as Lebanon is concerned, a population based study conducted in 2005 revealed that the overall prevalence of declared hypertension was 23.1% [13]. Compared to other Mediterranean countries, Lebanon has a lower prevalence of hypertension; however, compared to other countries, [14,15], Lebanon still has a high prevalence of hypertension. Nevertheless, no study has been performed regarding the health related quality of life of hypertensive patients and its correlates. The objective of this study was to evaluate QOL of hypertensive patients compared to non-hypertensive subjects in Lebanon and to suggest possible predictors of their QOL.
2. Material and methods
2.1. Study design
This is an observational case control study carried out in hypertensive patients undergoing treatment and non-hypertensive individuals. Patients were randomly selected from those visiting outclinics of two tertiary care hospitals (Hamoud and Raee Hospitals). The Institutional Review Board of both institutions waived the need for an official approval to perform this observational study, provided it respected patients’ autonomy and confidentiality. The patients were informed about the objectives of the study and asked to give an oral consent. Only those who gave their consent to participate in the study were enrolled. Data were collected from the 2nd of March till the 1st of June 2014.
2.2. Study population
Patients enrolled were of both genders, aged 18 years and older and divided into two groups: Hypertensive group consisting of patients diagnosed with hypertension and taking antihypertensive medication for at least three months, while the control group consisted of non-hypertensive individuals (blood pressure < 120/90 mmHg); the latter should be healthy or consulting for acute health related problems, such as urinary tract infections or otitis. Exclusion criteria were the presence of chronic or disabling diseases, including decompensated diabetes, cancer, pregnancy, sequelae of stroke, decompensated heart failure, chronic kidney disease, liver failure, acute myocardial infarction within the past six months and the use of antipsychotic drugs.
2.3. Data collection
Data were acquired through a structured face to face interview. The questionnaire was administered in Arabic and included different sections that evaluated: socio-demographic data including sex, age, educational level and marital status, monthly income, body mass index and lifestyle data including smoking status, involvement in sports activities, alcohol, caffeine consumption and salt intake. Detailed health history was also assessed, in relation with the onset of the hypertension, the presence of associated complications and co-morbidity. Clinical data related to hypertension classification (controlled or uncontrolled), pharmacological management (class and number of antihypertensive drugs used) as well as any drug side-effects experienced were obtained. Blood pressure was recorded. Accordingly, controlled blood pressure was defined as systolic blood pressure ⩽ 140 mmHg and diastolic ⩽ 90 mmHg [16]. We also assessed the patients’ attitudes and knowledge about the severity of disease and the use of medication.
2.4. Quality of life measurement
We assessed the QOL using the SF-8 questionnaire. While one of the most widely used tools is the SF-36 generic QOL questionnaire, its derivative (SF-8) is an additional easier instrument used in population-based studies and would provide a candidate instrument for measuring QOL in hypertensive patients [12]. This questionnaire offers the advantage that scores can be readily compared with results from the original SF-36 version. Moreover, it represents a major advance in measuring QOL for purposes of achieving both brevity and comprehensiveness in population health surveys. [12].
SF-8 has eight items, relying on a single item to measure each of the eight domains of health in the SF-36 survey: physical functioning, physical role, bodily pain, general health, vitality, social functioning, emotional role and mental health. Physical functioning covers limitations in daily life due to health problems. The role physical scale measures role limitations due to physical health problems. The bodily pain scale assesses pain frequency and pain interference with usual roles. The general health scale measures individual perceptions of general health. The vitality scale assesses energy levels and fatigue. The social functioning scale measures the extent to which ill health interferes with social activities. The role emotional scale assesses role limitations due to emotional problems, and the mental health scale measures psychological distress [12].
The SF-8 was thus translated into Arabic by a bilingual Lebanese researcher, the main language of Lebanon. It is then back translated into English by another translator who has no knowledge of the English version. Forward translation into Arabic was conducted. The Arabic version was then pilot-tested for understanding in a small patient group before it was used. Its psychometric properties were also assessed in the Lebanese population.
2.5. Sample size
Sample size was calculated using Epi info7, assuming a type I error of 5% and a study power of 80% and a confidence interval of 95%. In the absence of baseline data, the exposure probability to hypertension was considered to be equal to 50% in healthy population. The minimal sample size necessary to show a twofold increase in the risk of hypertension consisted of 336 subjects. We decided to study about twice this number in a ratio case/control = 1/2 to have an adequate power for studying subgroups.
2.6. Statistical analysis
Data were entered and analyzed using Statistical Package for Social Sciences, version 19. No missing data were obtained. A p-value ⩽ 0.05 was considered significant in all tests. Quality control of data entry and cleaning were done. Descriptive statistics including frequency, mean, and standard deviation were used to summarize patients’ characteristics.
After data cleaning, items quality was assessed by analyzing the distribution of item responses of the SF-8 using aggregate endorsement frequencies. For instruments with around a 5 point response range such as the SF-8, any item with 2 or more adjacent response points showing less than 10% of the response on aggregate are problematic [17].
The QOL score was also validated by testing for inter-item correlation. The internal consistency of the SF-8 was assessed using Cronbach’s reliability coefficient alpha. Internal consistency of SF-8 items with the underlying constructs of physical component summary (PCS) and mental component summary (MCS) was assessed using Pearson correlation test [18]. It was hypothesized that there would exist strong correlations between the PCS and items 1–5, and strong correlations between MCS and items 6–8 assuming that items more closely related to a common dimension would show a correlation of ⩾ 0.50.
The major dependent variable was PCS, MCS, and overall QOL which is the sum of all individual domains of SF-8 items. Each domain was scored over 100 using a norm-based scoring method [19]. When PCS and MCS measures were calculated, higher summary scores indicated better health. Scores above and below 50 were considered above and below the average based upon results recorded by the developers of the SF-8 [12].
An appropriate bivariate analysis was done for every explanatory variable. For continuous variables used in comparison, we used Student test or ANOVA for variables with adequate normal distribution to compare between means. For non-normally distributed continuous variables, the Kruskal–Wallis test was used. For categorical variables, Chi2 and Fisher exact tests were used to compare percentages.
Multivariable analysis using linear regression was carried out to compare measures between groups of comparison, taking into account potential confounding variables that had a p < 0.20 in bivariate analysis. The analysis sought to explore factors associated with QOL using regression analysis. The final model was accepted after ensuring adequacy of data.
3. Results
During the study period, the number of subjects that agreed to participate in this study was 672 (out of 785; 85.6%); among them, 224 patients (33.3%) were included in the hypertension group and 448 (66.7%) in the control group. Patients who refused to participate did not deliver any information to the researcher.
3.1. SF-8 data quality, internal consistency and reliability
The response distributions of each item for the sensitivity aggregate endorsement frequency showed all 8 items performing well. Table 1 shows that no item of the SF-8 questionnaire has 2 or more adjacent responses showing < 10% of responses. Internal consistency measured by Pearson correlation is also presented in Table 1. These show a generally strong level of consistency (⩾0.60) of items 1–5 with PCS including general health (r = 0.744), physical functioning (r = 0.858), role physical limitation (r = 0.884), bodily pain (r = 0.765), and vitality (r = 0.765). Also, the results show strong correlation items 6–8 with MCS including social functioning (r = 0.5), mental health (r = 0.914), emotional role (r = 0.852).
| QOL items | Response option frequencies in N (%) | Internal consistency | ||||||
|---|---|---|---|---|---|---|---|---|
| 1 | 2 | 3 | 4 | 5 | 6 | r PCS | r MCS | |
| General health | 41 (6.1%) | 167 (24.9%) | 233 (34.7%) | 150 (22.3%) | 69 (10.3%) | 12 (1.8%) | 0.744 | 0.315 |
| Physical functioning | 205 (30.5%) | 192 (28.6%) | 148 (22%) | 113 (16.8%) | 14 (2.1%) | 0.858 | 0.194 | |
| Role physical limitation | 199 (29.6%) | 184 (27.4%) | 165 (24.6%) | 102 (15.2%) | 22 (3.3%) | 0.884 | 0.226 | |
| Bodily pain | 236 (35.1%) | 88 (13.1%) | 103 (15.3%) | 156 (23.2%) | 81 (12.1%) | 8 (1.2%) | 0.765 | 0.286 |
| Vitality | 69 (10.3%) | 227 (33.8%) | 273 (40.6%) | 95 (14.1%) | 8 (1.2%) | 0.636 | 0.407 | |
| Social functioning | 296 (44%) | 153 (22.8%) | 127 (18.9%) | 93 (13.8%) | 3 (0.4%) | 0.409 | 0.500 | |
| Mental health | 206 (30.7%) | 107 (15.9%) | 172 (25.6%) | 164 (24.4%) | 23 (3.4%) | 0.153 | 0.914 | |
| Role emotional limitation | 316 (47%) | 142 (21.1%) | 124 (18.5%) | 83 (12.4%) | 7 (1%) | 0.196 | 0.852 | |
Distribution of frequencies & internal consistency of SF-8 (N = 672).
Reliability Cronbach’s alpha of the model (SF-8) was 0.868 with average intraclass correlation coefficient (ICC) = 0.868 (95%CI = 0.853–0.883; p < 0.001). Cronbach’s alpha of each of the two summaries PCS was 0.882 and that of MCS was 0.763 which is very high (>0.7). Moreover, the removal of any item of the score was accompanied by a decrease in the model’s Cronbach’s alpha.
3.2. Socio-demographic characteristics of the study population
The comparison of characteristic differences between hypertension and control groups is shown in Table 2. Both groups were homogenous regarding gender (p = 0.557). Participants were mostly females in hypertension and control groups (59.00% versus 62.27%). Hypertension individuals were older, less educated, widowed or divorced, retired or never working, have less monthly income and more financial support and were more overweight and obese (p < 0.001).
| Characteristics | Hypertension group N = 224 | Control group N = 448 | P-value |
|---|---|---|---|
| Age in years mean (SD) | 59.53 (12.08) | 40.57(13.23) | <0.001 |
| Sex n (%) | |||
| Males | 90 (40.17%) | 169 (37.72%) | 0.557 |
| Females | 134 (59%) | 279 (62.27%) | |
| Educational level: n (%) | |||
| Illiterate | 30 (13.39%) | 12 (2.67%) | <0.001 |
| Elementary | 73 (32.25%) | 54 (12.05%) | |
| Intermediate | 56 (25,00%) | 100 (22.32%) | |
| Secondary | 25 (11.16%) | 92 (20.53%) | |
| University | 40 (17.80%) | 190 (42.41%) | |
| Marital status: n (%) | |||
| Single | 11 (4.91%) | 87 (19.41%) | <0.001 |
| Married | 183 (81.69%) | 354 (79.01%) | |
| Divorced/widowed | 30 (13.39%) | 7 (1.56%) | |
| Employment: n (%) | |||
| Unemployed | 138 (61.61%) | 195 (43.52%) | <0.001 |
| Employed | 60 (26.78%) | 239 (53.34%) | |
| Retired | 26 (11.61%) | 14 (3.12%) | |
| Working hours: n (%) | |||
| None | 160 (71.42%) | 207 (46.21%) | <0.001 |
| [3–8] h | 29 (12.94%) | 85 (12.27%) | |
| [7–16] h | 35 (15.62%) | 156 (34.82%) | |
| Monthly income: n (%) | |||
| [500,000–1,000,000 L.L.] | 98 (43.75%) | 116 (25.89%) | <0.001 |
| [1,000,000–2,000,000 L.L.] | 94 (41.96%) | 239 (53.34%) | |
| [>2,000,000 L.L.] | 32 (14.28%) | 93 (20.75%) | |
| Living: n (%) | |||
| Alone | 37 (16.51%) | 13 (2.9%) | <0.001 |
| With family | 187 (83.48%) | 435 (97.09%) | |
| Financial support: n (%) | |||
| Yes | 146 (65.7%) | 89 (19.86%) | <0.001 |
| No | 78 (34.82%) | 359 (80.13%) | |
| BMI*: mean (SD) | 28.324 (4.604) | 26.113 (3.724) | <0.001 |
| Underweight n (%) | 0 (0%) | 4 (0.89%) | |
| Normal n (%) | 53 (23.66%) | 178 (39.73%) | |
| Overweight n (%) | 109 (48.66%) | 202 (45.08%) | |
| Obese n (%) | 62 (27.67%) | 64 (14.28%) | |
Data presented as mean (SD) and number (%) were performed using T test and Chi2 respectively and a p-value < 0.05 is considered significant.
Body mass index.
Socio-demographic characteristics of the study population.
3.3. Health related quality of life
Controls had higher significant scores (p < 0.05) than hypertensive individuals in all domains of the QOL score. Controls showed better QOL in general health, physical functioning, role physical limitation, bodily pain, vitality, and PCS with (p < 0.001). They also showed better health performance in mental health related items including social functioning (p = 0.033), mental health (p = 0.011), emotional limitation role (p < 0.001), and MCS (p = 0.026) (Fig. 1).
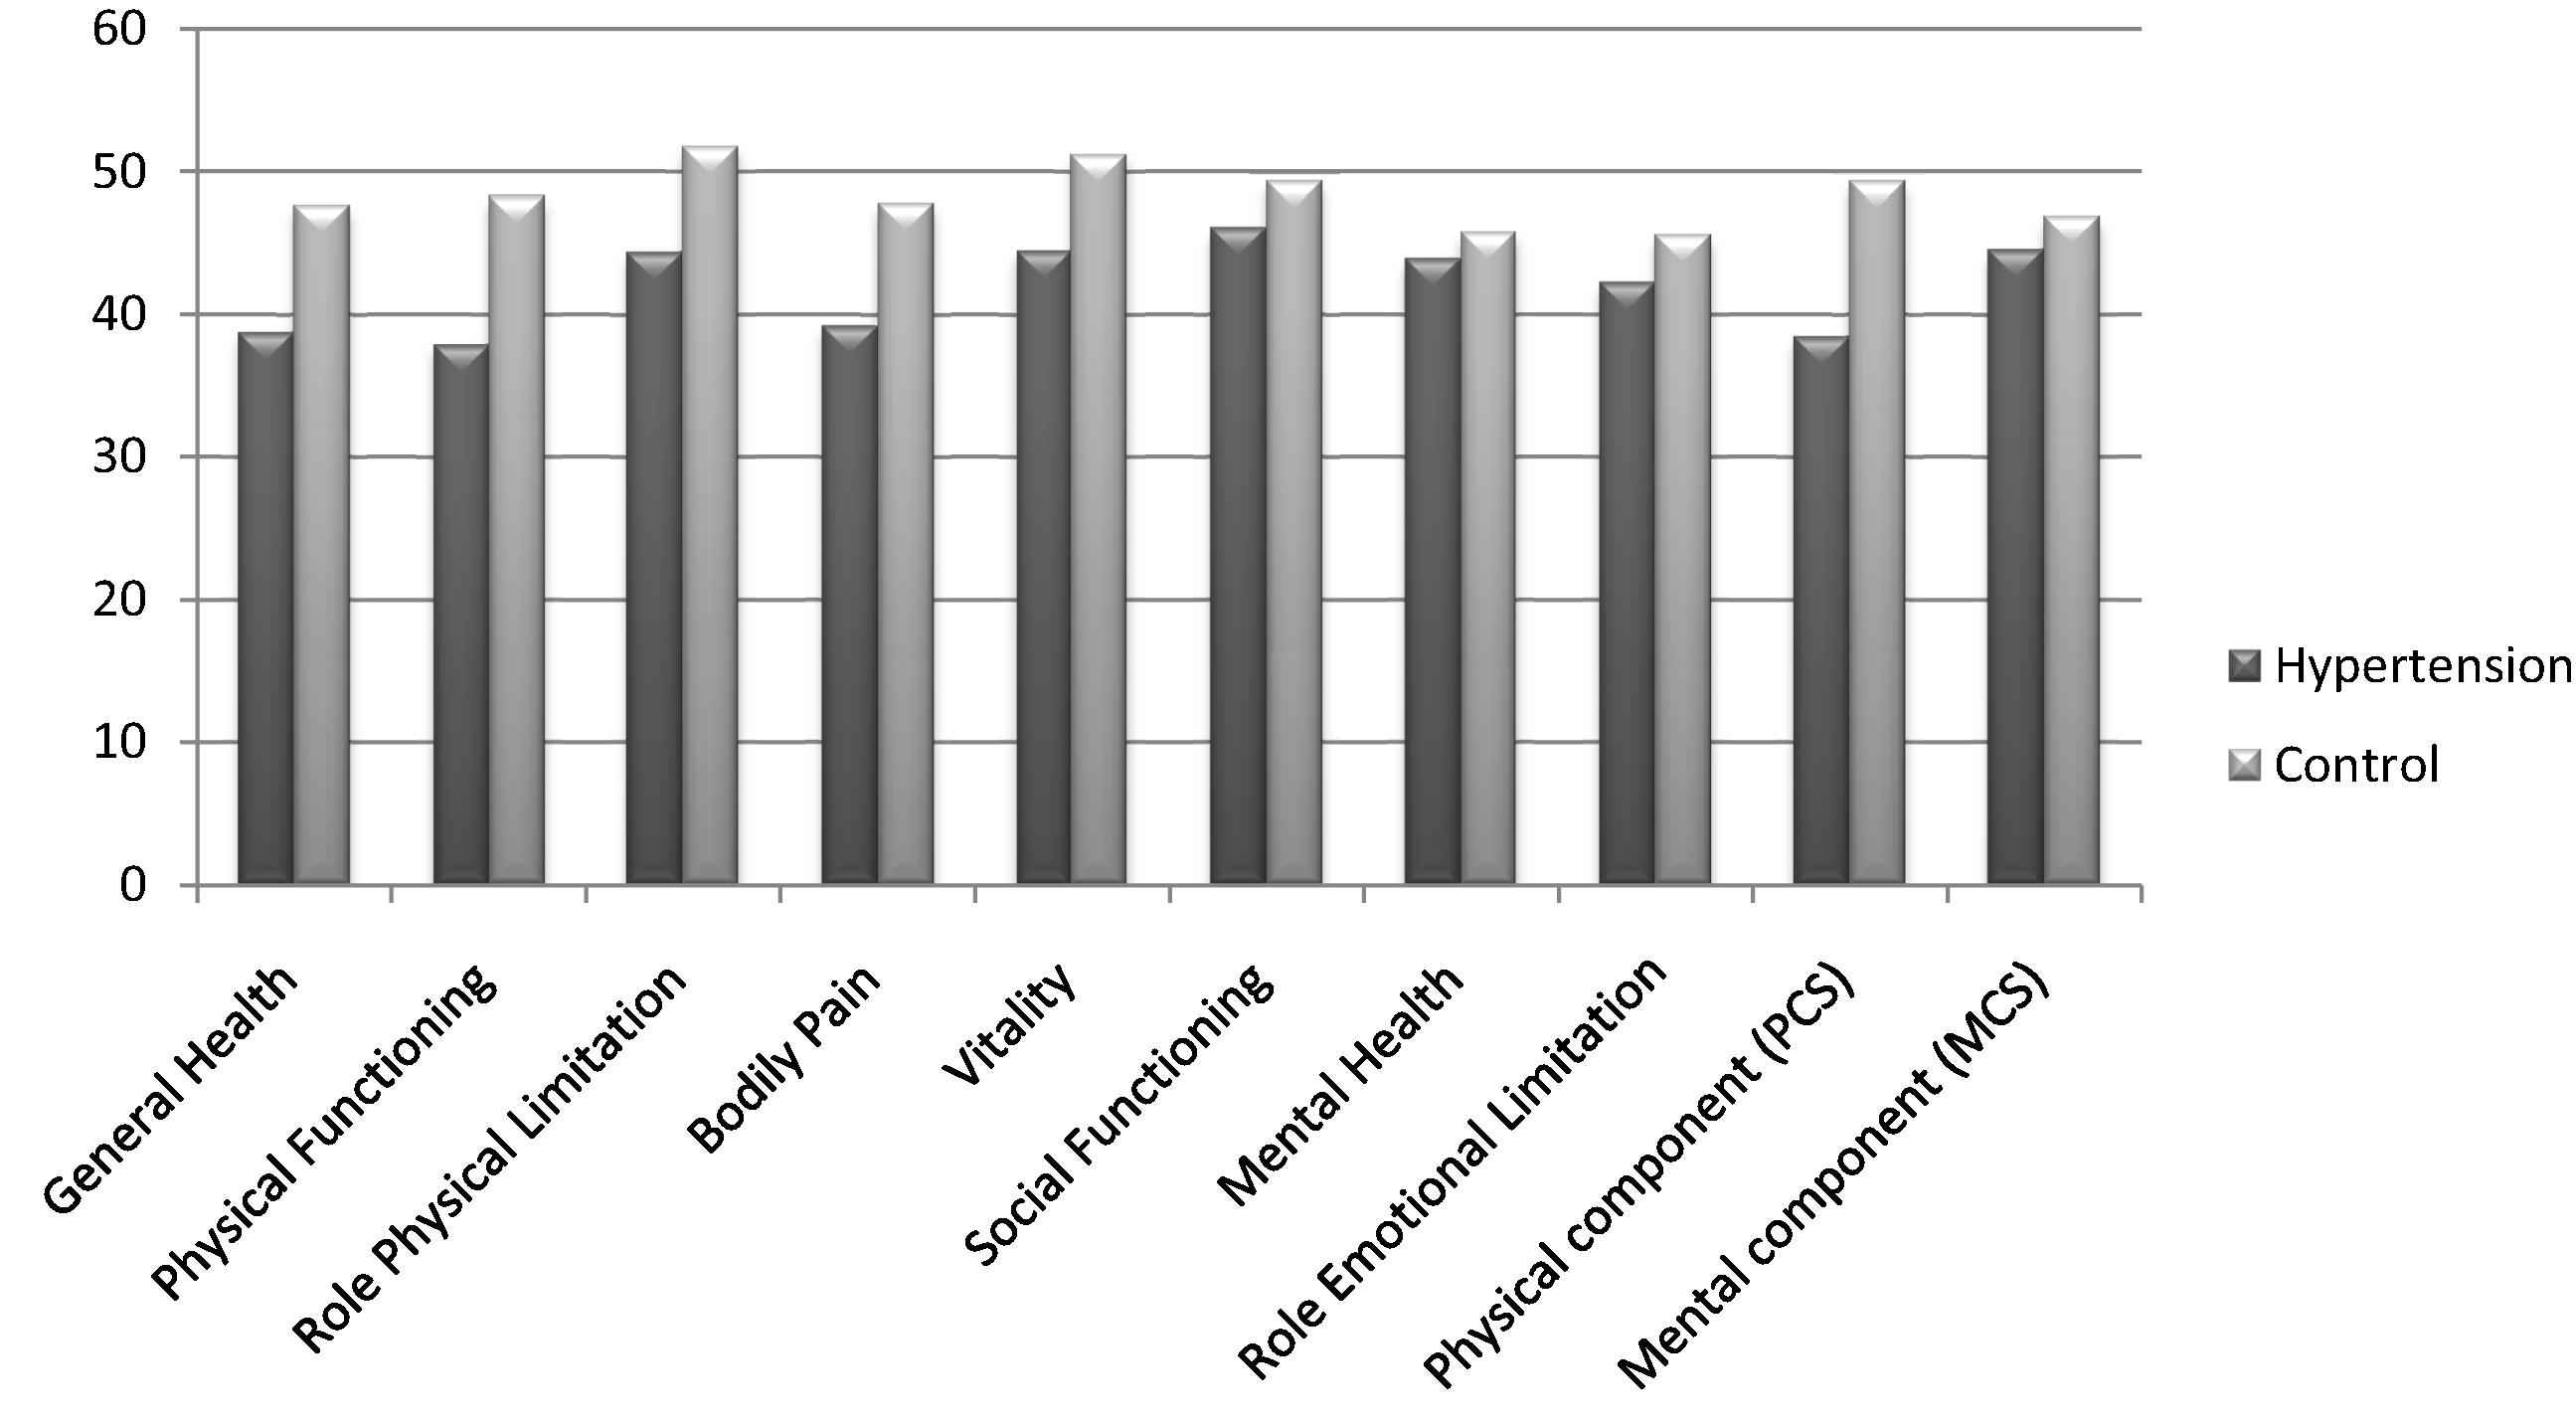
Mean scores of each SF-8 domain, comparing hypertension and control groups. Data are presented as means; statistical significance was tested using T test, all p-values were < 0.05.
3.4. Multivariable analyses
In the multivariable linear regression model (Table 3), we found that the presence of hypertension (β = −17.241, p = 0.009, 95%CI: [−30.166, −4.317]) and mood disorder (β = −17.241, p < 0.001, 95%CI: [−58.011, −16.661]) were negatively associated to QOL. Increasing age (β = −0.388, p < 0.001, 95%CI: [−7.52, −0.24]) and female gender (β = −14.485, p = 0.037, 95%CI: [−23.323, −5.648]) also significantly affected QOL where females had lower QOL than males. Practicing regular sport (β = 15.937, 95%CI: [6.362, 25.513]) and higher education level (β = 15.937, 95%CI: [8.451, 27.68]) were positively associated to QOL (p < 0.001). Moreover, the presence of more comorbidities was adversely correlated the overall QOL (β = −8.083, p = 0.009, 95%CI: [−14.184, −1.982]). The frequency of medication intake/day was the most significant risk factor affecting overall QOL (β = −11.602, p = 0.001, 95%CI: [−18.673, −4.531]) where patients with lower frequency of medication had better QOL.
| Predictors | Un stand. β | Stand. β | 95%CI lower upper | p-Value | |
|---|---|---|---|---|---|
| Linear regression; dependent variable: QOL overall | |||||
| Hypertension | −17.241 | −0.128 | −30.166 | −4.317 | 0.009 |
| Gender | −14.485 | −0.111 | −23.323 | −5.648 | 0.037 |
| Age | −0.388 | −0.095 | −0.752 | −0.024 | <0.001 |
| Education (University) | 18.065 | 0.134 | 8.451 | 27.68 | <0.001 |
| Regular sport | 15.937 | 0.109 | 6.362 | 25.513 | 0.001 |
| Number of comorbidities | −8.083 | 0.120 | −14.184 | −1.982 | 0.009 |
| Mood disorder | −17.241 | −0.121 | −58.011 | −16.661 | <0.001 |
| Frequency of drugs/day | −11.602 | −0.186 | −18.673 | −4.531 | 0.001 |
| Linear regression; dependent variable: physical component (PCS) | |||||
| Hypertension | −2.074 | −0.144 | −5.292 | −1.332 | 0.001 |
| Gender | −2.555 | −0.114 | −4.115 | −0.995 | 0.001 |
| Age | −0.117 | −0.168 | −0.173 | −0.061 | <0.001 |
| Education (University) | 2.415 | 0.105 | 0.934 | 3.897 | 0.001 |
| Regular sport | 3.461 | 0.139 | 2.002 | 4.921 | <0.001 |
| Working hours | 1.830 | 0.760 | 0.192 | 3.467 | 0.076 |
| No cigarette/day | −0.053 | −0.066 | −1.020 | −0.005 | 0.031 |
| Presence of comorbidity | −3.631 | −0.166 | −5.385 | −1.878 | <0.001 |
| Mood disorder | −3.250 | −0.062 | −6.435 | −0.660 | 0.045 |
| Frequency of drugs/day | −2.074 | −0.195 | −3.139 | −1.010 | <0.001 |
| Linear regression; dependent variable: mental component (MCS) | |||||
| Regular sport | 1.932 | 0.077 | 0.091 | 3.774 | 0.04 |
| Smoking waterpipe | −2.555 | −0.081 | −4.908 | −0.202 | 0.033 |
| Drinking coffee | −3.084 | −0.094 | −5.498 | −0.671 | 0.012 |
| Mood disorder | −7.582 | −0.143 | −11.502 | −3.663 | <0.001 |
| Frequency of drugs/day | −1.940 | −0.181 | −2.746 | −1.134 | <0.001 |
CI: confidence interval, p < 0.05 is considered significant, β: regression coefficient.
Multivariable Analysis of QOL score and its components.
In the multivariable linear regression model estimating the predictors of PCS (Table 3), we found that the frequency of medications/day was the most significant inverse correlate (β = −11.602, p = 0.001, 95%CI: [−3.139, −1.01]). Age (β = −0.117, 95%CI: [−0.173, −0.061]) and gender (β = −2.555, 95%CI: [−4.115, −0.995]) were also inversely correlated with PCS (p < 0.001). Regular sport (β = 3.461, p < 0.001, 95%CI: [2.002, 4.921]) and education (β = 2.415, p = 0.001, 95%CI: [0.934, 3.897]) were positively correlated with PCS, while working effect was not statistically significant (p = 0.076). Moreover, comorbidities were adversely associated with PCS (β = −3.631, p < 0.001, 95%CI: [−5.385, −1.878]) whereas hypertension (β = −2.074, 95%CI: [−5.292, −1.332]) and mood disorders (β = −17.241, 95%CI: [−6.435, −0.66]) were negatively associated with PCS (p < 0.001). In addition, higher daily cigarettes reduced PCS significantly (β = −0.053, p = 0.031, 95%CI: [−1.02, −0.005]).
In the multivariable linear regression model estimating the predictors of MCS (Table 3), regular sport was positively associated with MCS (β = 1.932, p < 0.05, 95%CI: [0.091, 3.774]). The frequency of medications/day was the most significant risk factor to be negatively correlated with MCS (β = −1.94, p < 0.001, 95%CI: [−2.746, −1.134]). The presence of mood disorders significantly lowered MCS (β = −7.582, p < 0.001, 95%CI: [−11.502, −3.663]). Moreover, smoking waterpipe (β = −2.555, p = 0.033, 95%CI: [−4.908, −0.202]) and drinking coffee (β = −3.084, p = 0.012, 95%CI: [−5.498, −0.671]) were associated with lower MCS scores.
3.5. Intragroup analysis of QOL: hypertensive individuals
Female gender and age were significantly associated with lower QOL (β = −21.363 p = 0.001, 95%CI: [−34.353, −8.374] and β = −0.548, p = 0.044, 95%CI: [−1.08, −0.016], respectively). Higher education level (β = 22.949, p = 0.006, 95%CI: [6.798, 38.101]) and regular sport (β = 23.15, p < 0.001, 95%CI: [9.969, 36.33]) were positively associated with QOL. The presence of drugs side effects (β = −19.262, p = 0.031, 95%CI: [−36.702, −1.822]) and of comorbidities (β = −13.865, p = 0.054, 95%CI: [−27.992, .262]) were negatively associated with overall QOL. Moreover, the increase in daily cigarettes (β = −0.726, p < 0.001, 95%CI: [−1.127, −0.324]) and salt consumption (β = −15.728, p = 0.049, 95%CI: [−31.418, −0.038]) was adversely correlated with overall QOL. The frequency of medications/day (β = −8.193, p = 0.058, 95%CI: [−16.669, 0.282]) also reduced the overall QOL (Table 4 ).
| Predictors | Un stand. β | Stand. β | 95%CI lower upper | p-Value | |
|---|---|---|---|---|---|
| Linear regression (in hypertension group) dependent variable: QOL overall | |||||
| Gender | −21.363 | −0.196 | −34.353 | −8.374 | 0.001 |
| Age | −0.548 | −0.123 | −1.080 | −0.016 | 0.044 |
| Education (University) | 22.949 | 0.164 | 6.798 | 38.101 | 0.006 |
| Regular sport | 23.150 | 0.199 | 9.969 | 36.33 | <0.001 |
| Drugs side effects | −19.262 | −0.125 | −36.702 | −1.822 | 0.031 |
| Presence of comorbidity | −13.865 | −0.117 | −27.992 | 0.262 | 0.054 |
| Frequency of drugs/day | −8.193 | −0.12 | −16.669 | 0.282 | 0.058 |
| High Salt consumption | −15.728 | −0.112 | −31.418 | −0.038 | 0.049 |
| Linear regression (in hypertension group) dependent variable: physical component (PCS) | |||||
| Gender | −4.308 | −0.185 | −7.286 | −1.330 | 0.006 |
| Age | −0.241 | −0.241 | −0.353 | −0.130 | <0.001 |
| Regular sport | 4.200 | 0.170 | 1.474 | 7.926 | 0.017 |
| Working hours | 4.493 | 0.143 | 0.647 | 8.339 | 0.022 |
| Number of cigarettes/day | −0.101 | −0.138 | −0.184 | −0.019 | 0.016 |
| Frequency of drugs/day | −1.595 | −0.110 | −3.374 | 0.185 | 0.079 |
| Dyslipidemia | −4.493 | −0.203 | −7.259 | −2.009 | 0.001 |
| Angiotensin related drugs | 3.663 | 0.112 | 0.012 | 5.314 | 0.049 |
| Combination | 2.998 | 0.121 | 0.285 | 5.712 | 0.03 |
| Understand severity of hypertension | −5.019 | −0.117 | −9.735 | −0.303 | 0.037 |
| Linear regression (in hypertension group) dependent variable: mental component (MCS) | |||||
| Regular sport | 3.546 | 0.144 | 0.340 | 6.752 | 0.030 |
| Number of cigarettes/day | −0.117 | −0.159 | −0.211 | −0.032 | 0.015 |
| Drugs side effect | −4.584 | −0.141 | −8.799 | −0.369 | 0.033 |
CI: confidence interval, p < 0.05 is considered significant, β: regression coefficient.
QOL predictors among hypertensive patients.
In the multivariable linear regression model estimating the predictors of PCS (Table 4), female gender (β = −4.308, p = 0.006, 95%CI: [−34.353, −8.374]) and older age (β = −0.241, p < 0.001, 95%CI: [−1.08, −0.16]) were strongly and inversely associated with PCS. Practicing regular sport (β = 23.15, p = 0.017, 95%CI: [9.969, 36.33]) and increasing working hours (β = 4.493, p = 0.022, 95%CI: [0.647, 8.339]) were positively correlated with PCS. Moreover, the number of cigarettes/day (β = −0.101, p = 0.016, 95%CI: [−0.184, −0.019]) as well as the frequency of medication taken/day were negatively associated with PCS (β = 1.595, but p = 0.079). Dyslipidemia negatively affected PCS (β = −4.493, p = 0.001, 95%CI: [−7.259, −2.009]). In addition, angiotensin converting enzyme inhibitors/angiotensin receptors blockers (β = 3.663, p = 0.049, 95%CI: [0.012, 5.314]) and combination drugs had positive statistically significant correlation with PCS (β = 2.998, p = 0.03, 95%CI: [0.285, 5.712]). However, understanding the severity of the disease was associated with significant negative association on PCS (β = −5.019, p = 0.037, 95%CI: [−9.735, −0.303]).
In the multivariable linear regression model estimating the predictors of MCS (Table 4), regular sport was positively correlated with MCS (β = 1.932, p = 0.03, 95%CI: [0.34, 6.752]). Increasing the number of cigarette/day was the most significant risk factor negatively associated with MCS (β = −0.117, p = 0.015, 95%CI: [−0.211, −0.032]). Drugs side effects were negatively correlated with MCS (β = −4.584, p = 0.003, 95%CI: [−8.799, −0.369]).
4. Discussion
The SF-8 health survey was internally consistent and a reliable tool for the assessment of the quality of life of patients in Lebanon. Hypertensive patients had a poor QOL with lower scores in all domains of the SF-8 in comparison with non-hypertensive individuals in both physical and mental domains, taking into account differences in other characteristics. Although this study contradicts the traditional concept that claims hypertension as an asymptomatic disease, it is consistent with studies that demonstrate the impact of hypertension on QOL [9–11]. The clinical significance of these differences in QOL is established [12]: given that differences found between hypertensive and control individuals were well above 2 for all physical components items (11 points on PCS), and between 2 and 3 for mental component items, hypertension seems to affect mainly affect physical health in the Lebanese population.
Moreover, the present study showed QOL was affected by several factors: hypertensive males and younger individuals had better QOL, which corroborates the data obtained by Bardage and Isacson [11]. For men the QOL score was better in all domains. The facts that men had better QOL scores may be possibly due to them being more tolerant to chronic diseases, thus less emotionally affected by them when compared to women [11]. With regard to age, younger hypertensive patients had better QOL: in fact, during the aging process, health hazards may arise as a result of physiological changes, making the individual more prone to chronic diseases which can affect QOL [10]. Patients with a higher level of education had higher QOL scores in overall QOL and PCS. The level of education influences the ability to understand information, which favors knowledge on the disease and treatment adherence. Therefore, patients with a higher level of education may have better QOL scores [20]. Individuals with employment status and higher working hours also had higher QOL scores in the physical domain and this finding is in agreement with other study [21].
Furthermore, the dimensions of the QOL score were found to be significantly associated with many lifestyle factors. Smoking was significantly and negatively associated with QOL in the selected population as well as the magnitude of this association was determined by the number of cigarettes smoked. Waterpipe smoking was also significantly associated with poorer mental score outcomes, possibly associated with a number of deleterious health outcomes due to the withdrawal effect of high nicotine concentrations. This finding is similar to those reported by Wilson et al. [22]. However, regular sport was significantly and positively correlated with QOL in all domains. Remaining physically active can enhance functional capacity and mental well-being to maintain QOL and independence. Besides, caffeine was negatively associated with MCS score. Caffeine is known to elevate systolic blood pressure and diastolic blood pressure at rest and during mental and exercise stress [23]. In addition, high salt consumption was shown to reduce QOL significantly in hypertensive group. A strong association between increased sodium intake and blood pressure has been shown to be correlated with QOL [24]. This leads to stronger enthusiasm for strict control of sodium intake for hypertensive people.
As expected, the presence of comorbidities was associated with lower QOL in hypertensive patients. This finding is consistent with that of Wang et al. [19], showing a greater decline in functioning than those with only one condition. Depression and anxiety were significantly more associated with lower score of QOL. This is due to the negative effect of depression on mood performance and eventually on the functional capacity. Also, we observed that dyslipidemia significantly reduced QOL in hypertensive patients. This is due to the negative effect of dyslipidemia on the physical performance. These findings suggest that effective treatment and prevention of chronic diseases may be important to preserve the QOL; the latter suggestion remains to be established in adequate prospective studies.
As for medications, the use of angiotensin converting enzyme inhibitors, angiotensin receptor blockers and drug combinations improved the physical score. This finding is in concordance with a previous study that analyzed selected aspects of the QOL such as physical performance [25]. However, β blockers may actually worsen the QOL [26], which is consistent with our results. Of the drugs evaluated in our study, calcium channel blockers and diuretics appeared to have non-significant effects on the QOL and were associated only with a decline in physical health. The present study also revealed a significant unfavorable influence of drug side-effects on quality of life, particularly in overall QOL and MCS. Studies show that there is a deficit in the QOL of hypertensive patients because of the adverse effects of the drugs used in the antihypertensive treatment [9]. It is therefore essential for clinicians to select the drug best tolerated by individual patients to balance their needs with the best quality of life. Moreover, the increase in the dose frequency per day and the increased number of prescribed medications were the primary factors associated with lower QOL in hypertensive patients. This is consistent with another study suggesting that the overuse of medications decrease the QOL [19]. The use of over-the-counter medications was also associated with lower QOL, probably because of the perception of overmedication or the consequences of adverse effects on hypertensive patients. Knowledge of the hypertension severity was significantly correlated with PCS, perhaps because patients felt stigmatized after discovering that they had the disease. Moreover, neither drug cost per patient, nor the presence of a medical insurance could predict the QOL. This finding is supported by evidence from literature [27]. Finally, when evaluating the influence of the number of antihypertensive drugs, the controlled status of BP and the duration of hypertension on QOL, no significant difference were found in any of the domains studied. However, another study verified that hypertensive patients who were under treatment and whose BP levels were under control had higher QOL than those with uncontrolled blood pressure [10]. This discrepancy may be explained by the low subsample size.
Although our study has several points of strength, since this is the first study that formally assesses the QOL of hypertensive patients compared with general individuals in Lebanon, it has several limitations. To begin with, it is a cross-sectional study; therefore, it does not allow causality to be attributed to the observed associations. The baseline characteristics differ between the hypertension and control group; this may introduce potential confounding factors that were taken into account during multivariable analyses; however, residual confounding may still be possible, due to confounders that we may have not adequately measured. Moreover, there could also be a possibility of respondent and information bias, since the results of our study were based on a face to face questionnaire. Another study limitation was the incapacity to assess the influence of the antihypertensive drug associations on QOL of hypertensive individuals due to the large number of combinations. In addition, the lower than expected prevalence of common diseases (e.g., peripheral artery disease, neuronal diseases, chronic venous insufficiency) may suggest that polymorbidity was underreported. However, since the associations we found were all consistent with the literature and of biological plausibility, we have no reason to believe that our results suffer from serious methodological flaws.
5. Conclusion
In Lebanon hypertensive patients presented a lower QOL scores in all domains of SF-8 than non-hypertensive individuals. Therefore, it is essential to find medical and social alternatives that have a favorable influence on QOL; this can be achieved by the development of drugs that provide blood pressure control and favorable effects on QOL with minimal side effects. Hence, effective health interventions should ensure maintenance of desirable QOL in order to prevent or reduce comorbidities of hypertension. There is a necessity for health professionals to take these factors into account when treating hypertensive patients, and to tackle special subgroups with attention to their deteriorated QOL.
Conflict of interest
No potential conflicts of interest were disclosed.
Acknowledgement
The authors thank the Lebanese University for funding this project.
References
Cite this article
TY  - JOUR
AU  - Malak Khalifeh
AU  - Pascale Salameh
AU  - Amal Al Hajje
AU  - Sanaa Awada
AU  - Samar Rachidi
AU  - Wafa Bawab
PY  - 2015
DA  - 2015/03/12
TI  - Hypertension in the Lebanese adults: Impact on health related quality of life
JO  - Journal of Epidemiology and Global Health
SP  - 327
EP  - 336
VL  - 5
IS  - 4
SN  - 2210-6014
UR  - https://doi.org/10.1016/j.jegh.2015.02.003
DO  - 10.1016/j.jegh.2015.02.003
ID  - Khalifeh2015
ER  -